Báo cáo y học: "Exogenous glucosamine globally protects chondrocytes from the arthritogenic effects of IL-1β" docx
Bạn đang xem bản rút gọn của tài liệu. Xem và tải ngay bản đầy đủ của tài liệu tại đây (368.75 KB, 14 trang )
Open Access
Available online />Page 1 of 14
(page number not for citation purposes)
Vol 8 No 6
Research article
Exogenous glucosamine globally protects chondrocytes from the
arthritogenic effects of IL-1β
Jean-Noël Gouze
1
, Elvire Gouze
1
, Mick P Popp
2
, Marsha L Bush
1
, Emil A Dacanay
1
, Jesse D Kay
1
,
Padraic P Levings
1
, Kunal R Patel
1
, Jeet-Paul S Saran
1
, Rachael S Watson
1
and
Steven C Ghivizzani
1
1
Department of Orthopaedics and Rehabilitation, Gene Therapy Laboratory, University of Florida, College of Medicine, PO Box 100137, Gainesville,
FL 32610-0137, USA
2
Interdisciplinary Center for Biotechnology Research, University of Florida, Gainesville, FL 32610-0137, USA
Corresponding author: Jean-Noël Gouze,
Received: 27 May 2006 Revisions requested: 28 Jun 2006 Revisions received: 19 Sep 2006 Accepted: 16 Nov 2006 Published: 16 Nov 2006
Arthritis Research & Therapy 2006, 8:R173 (doi:10.1186/ar2082)
This article is online at: />© 2006 Gouze et al.; licensee BioMed Central Ltd.
This is an open access article distributed under the terms of the Creative Commons Attribution License ( />),
which permits unrestricted use, distribution, and reproduction in any medium, provided the original work is properly cited.
Abstract
The effects of exogenous glucosamine on the biology of articular
chondrocytes were determined by examining global
transcription patterns under normal culture conditions and
following challenge with IL-1β. Chondrocytes isolated from the
cartilage of rats were cultured in several flasks either alone or in
the presence of 20 mM glucosamine. Six hours later, one-half of
the cultures of each group were challenged with 10 ng/ml IL-1β.
Fourteen hours after this challenge, RNA was extracted from
each culture individually and used to probe microarray chips
corresponding to the entire rat genome. Glucosamine alone had
no observable stimulatory effect on the transcription of primary
cartilage matrix genes, such as aggrecan, collagen type II, or
genes involved in glycosaminoglycan synthesis; however,
glucosamine proved to be a potent, broad-spectrum inhibitor of
IL-1β. Of the 2,813 genes whose transcription was altered by IL-
1β stimulation (P < 0.0001), glucosamine significantly blocked
the response in 2,055 (~73%). Glucosamine fully protected the
chondrocytes from IL-1-induced expression of inflammatory
cytokines, chemokines, and growth factors as well as proteins
involved in prostaglandin E
2
and nitric oxide synthesis. It also
blocked the IL-1-induced expression of matrix-specific
proteases such as MMP-3, MMP-9, MMP-10, MMP-12, and
ADAMTS-1. The concentrations of IL-1 and glucosamine used
in these assays were supraphysiological and were not
representative of the arthritic joint following oral consumption of
glucosamine. They suggest, however, that the potential benefit
of glucosamine in osteoarthritis is not related to cartilage matrix
biosynthesis, but is more probably related to its ability to globally
inhibit the deleterious effects of IL-1β signaling. These results
suggest that glucosamine, if administered effectively, may
indeed have anti-arthritic properties, but primarily as an anti-
inflammatory agent.
Introduction
Osteoarthritis (OA) is a chronic, disabling condition for which
there is no cure and few useful treatments. OA primarily affect
the hips, knees and distal interphalangeal joints of the hands
and is generally associated with a progressive loss of articular
cartilage accompanied by sclerosis of the subchondral bone
[1,2]. Clinical features include joint pain, instability, limitation of
motion and functional impairment. The pathogenesis of OA,
although not yet well understood, is often linked to joint injury,
biomechanical alterations and aging. Many investigators con-
sider cytokines, such as IL-1, as well other inflammatory medi-
ators synthesized locally by synovial cells and chondrocytes,
to be key contributors to the progression of the disease [3,4].
The failure of conventional pharmacologics to satisfactorily
control OA probably explains the increasing use of self-treat-
ments such as glucosamine and other 'nutraceuticals' [5-7].
Indeed, over the past several years, glucosamine has been
widely endorsed by the lay-press as a useful over-the-counter
remedy for OA, with estimated annual sales exceeding $700
million in the United States alone.
DMEM = Dulbecco's modified Eagle's medium; ECM = extracellular matrix; IL = interleukin; NF-κB = nuclear factor kappa B; NO = nitric oxide; OA
= osteoarthritis; PCR = polymerase chain reaction; TNF = tumor necrosis factor.
Arthritis Research & Therapy Vol 8 No 6 Gouze et al.
Page 2 of 14
(page number not for citation purposes)
Although anecdotal evidence of the capacity of glucosamine
to relieve OA symptoms is widespread, its mode of action is ill-
defined. D-Glucosamine, the biologically active form, serves
as a metabolic precursor in the synthesis of several classes of
compounds requiring amino sugars, including the proteogly-
cans, glycosaminoglycans, and hyaluronate. Because these
compounds are essential extracellular matrix (ECM) compo-
nents of connective tissues, a common perception is that oral
consumption of large quantities of glucosamine leads to ele-
vated intra-articular concentrations and thereby enhances syn-
thesis of the articular cartilage matrix. This belief, however, has
never been conclusively demonstrated in vivo. Reports of the
efficacy of glucosamine have been inconsistent in controlled
clinical studies, leaving doubts among the scientific commu-
nity and skepticism that its ingestion as a dietary supplement
mediates a meaningful biological response in the joint tissues
[8-11]. Indeed, the recent findings of the multicenter, double-
blind, placebo-controlled Glucosamine/chondroitin Arthritis
Intervention Trial were somewhat mixed [12]. This trial,
intended to resolve and clarify the clinical effectiveness of
these supplements with regard to OA, has perhaps had the
reverse effect and has fueled the controversy.
In attempts to describe more clearly the effects of elevated
glucosamine on cartilage biology, several laboratory studies
have been undertaken that suggest glucosamine may have
specific chondroprotective properties. Initial work in vitro
showed that glucosamine could moderate certain aspects of
the deleterious response of chondrocytes to stimulation with
IL-1 [13] or lipopolysaccharide [14]. These aspects included
inhibition of phospholipase A
2
activity [15], prostaglandin E
2
and nitric oxide (NO) synthesis [13], reduced COX-2 mRNA
and protein expression [16,17], and protection from reduced
proteoglycan synthesis in articular cartilage [13,18-20]. Inhibi-
tion of aggrecanase-dependent cleavage of aggrecan was
also observed in both rat and bovine cartilage explant cultures
when supplemented with glucosamine [21]. In addition, NF-
κB activation as well as the nuclear translocation of p50 and
p65 proteins was inhibited in chondrocytes cultured in the
presence of glucosamine, suggesting that glucosamine may
block inflammatory signaling [17,22].
Studies such as those already cited involving assays of individ-
ual genes and proteins have provided only a limited indication
of the response of articular chondrocytes to elevated levels of
exogenous glucosamine. Given the popularity of glucosamine
as a means to manage OA symptoms, and discrepancies
regarding its possible mode of action and true value as an anti-
arthritic, we performed gene expression analyses using micro-
arrays in an effort to determine how elevated levels of exoge-
nous glucosamine influence the global gene expression
patterns of articular chondrocytes. We found that addition of
glucosamine to the culture medium had no apparent stimula-
tory effect on the expression of biosynthetic genes but was a
surprisingly effective inhibitor of IL-1β, blocking its effects on
thousands of genes.
Materials and methods
Chondrocyte isolation and culture
Articular cartilage was isolated from the femoral heads of male
Wistar rats under aseptic conditions (Charles River Laborato-
ries, Boston, MA, USA). Chondrocytes were obtained by
sequential digestion of the cartilage with pronase and type II
collagenase (Invitrogen, Carlsbad, CA, USA) as previously
described [23]. After filtration to remove tissue debris, the
cells were cultured in 75-cm
2
flasks in complete DMEM (sup-
plemented with 10% fetal bovine serum and 1% penicillin–
streptomycin; Invitrogen) at 37°C in a humidified atmosphere
containing 5% CO
2
.
Experiments were subsequently performed with second-pas-
sage cultures, whereby the cells from the large cultures were
trypsinized, pooled and seeded into 20 flasks of 25 cm
2
vol-
ume. These flasks were then divided into four treatment
groups to evaluate the effects of glucosamine and IL-1 on glo-
bal transcription patterns (n = 5/group). To the culture
medium in one-half of the flasks was added glucosamine and
HCl (Sigma-Aldrich, St Louis, MO, USA) to a final concentra-
tion of 20 mM [13]. Six hours later, IL-1β was added at 10 ng/
ml to five of the flasks receiving glucosamine and to five of the
untreated flasks. Fourteen hours post IL-1β stimulation, and
immediately prior to RNA isolation, the conditioned media
were collected from all cultures and analyzed individually for
NO production as indicated by the nitrite levels. The total RNA
was then isolated individually from the respective cultures.
Nitrite assay
NO production was determined spectrophotometrically by
measuring in conditioned medium the accumulation of nitrite
(NO
2
-
), a stable breakdown product of NO. Nitrate in the
media were first converted to nitrite by the action of nitrate
reductase from Aspergillus niger (Roche, Florence, SC, USA).
Then 100 μl culture supernatant was mixed with 100 μl Griess
reagent (sulfanilamide (1% w/v)) in 2.5% H
3
PO
4
and N-naph-
thylethylenediamine dihydrochoride ((0.1% w/v) in H
2
O), and
was incubated at room temperature for 5 min in 96-well plates.
The absorbance at 550 nm was measured on a Multiskan
MCC microplate reader (Thermo, Waltham, MA, USA). The
nitrite concentration was calculated from a standard curve of
sodium nitrite and expressed as the micromolar concentration
[24].
After comparison of data by analysis of variance the different
groups were compared using Fisher's t test. Assays were per-
formed in quintuplet. P < 0.05 was considered significant.
Preparation of labeled copy RNA
The total RNA from each chondrocyte culture was extracted
individually and prepared for hybridization according to the
Available online />Page 3 of 14
(page number not for citation purposes)
GeneChip Expression Analysis Technical Manual (2001;
Affymetrix, Santa Clara, CA, USA). Briefly, cells were lysed in
the presence of Trizol solution (Sigma-Aldrich, St Louis, MO,
USA). Following extraction of the homogenate with chloro-
form, the total RNA was precipitated with isopropanol and
resuspended in 10 mM Tris–HCl, pH 8.0, 1 mM ethylenedi-
amine tetraacetic acid. Newly extracted RNA was then
cleaned using RNeasy mini columns as described by the man-
ufacturer (RNeasy Mini Protocol for RNA cleanup; Qiagen,
Valencia, CA USA).
The amount and quality of each RNA sample were assessed
by spectrophotometry. The four samples from each treatment
with the greatest OD 260/280 ratios were used for target
labeling as follows. A 3 μg aliquot of total RNA was used as a
template for cDNA synthesis (One-Cycle cDNA Synthesis Kit;
Affymetrix). First-strand synthesis and second-strand synthe-
sis were performed following the manufacturer's instructions.
The second-strand product was cleaned (GeneChip Sample
Cleanup Module; Affymetrix) and used as a template for in
vitro transcription with biotin-labeled ribonucleotides (Gene-
Chip IVT Labeling Kit; Affymetrix). The resulting cRNA product
was cleaned (GeneChip Sample Cleanup Module; Affymetrix),
and a 20-μg aliquot was heated at 94°C for 35 minutes in the
fragmentation buffer provided with the cleanup module
(Affymetrix).
Array hybridization
Microarray hybridization and data analyses were performed by
the Gene Expression Core of the Interdisciplinary Center for
Biotechnology Research at the University of Florida. Fifteen
micrograms of adjusted cRNA from each sample was hybrid-
ized for 16 hours at 45°C to Affymetrix GeneChip Rat Genome
230 2.0 arrays (Affymetrix). After hybridization, each chip was
stained with a streptavidin–phycoerythryn conjugate (Invitro-
gen-Molecular Probes, Carlsbad, CA, USA), was washed, and
was visualized with a microarray scanner (Genearray Scanner;
Agilent Technologies, Santa Clara, CA, USA). Images were
inspected visually for hybridization artifacts. In addition, quality
assessment metrics were generated for each scanned image
and were evaluated based on empiric data from previous
hybridizations and on the signal intensity of internal standards
that were present in the hybridization cocktail. Samples that
did not pass quality assessment were eliminated from
analyses.
Generation of expression values
Microarray Suite (version 5; Affymetrix) was used to generate
*.cel files, and a computer program (Probe Profiler, version
1.3.11; Corimbia, Inc Berkeley, CA, USA) developed specifi-
cally for the GeneChip system (Affymetrix) was used to con-
vert intensity data into quantitative estimates, globally scaled
to 100, of gene expression for each probe set. The software
identifies informative probe pairs and downweights the signal
contribution of probe pairs that are subject to differential
cross-hybridization effects or that consistently produce no sig-
nal. The software also detects and corrects for saturation arti-
facts, outliers, and chip defects. A probability statistic was
generated for each probe set. The probability is associated
with the null hypothesis that the expression level of the probe
set is equal to 0 (background). Genes not significantly
expressed above the background in any of the samples (P <
0.05) were considered absent and removed from the data set.
Data analysis
A one-way analysis of variance for replicates was performed
on expression values to evaluate the presence of a treatment
effect (P < 0.0001). Genes for which there was a significant
treatment effect were subjected to a Tukey's honest significant
difference post-hoc test (P < 0.05). The expression values of
those genes considered to have a significant effect were nor-
malized by performing a Z-transformation, thereby generating
a distribution with mean 0 and standard deviation 1 for each
gene. K-means clustering and principal component analysis
were performed on normalized values (GeneLinker Gold 3.1,
Kingston, ON, Canada).
Real-time PCR analysis
cDNA was synthesized from 1 μg total RNA using M-MLV
reverse transcriptase and was primed with random hexamer
oligonucleotides (Invitrogen) in a 20 μl reaction. Amplification
by PCR was carried out in a 25 μl reaction volume using a
SYBR Green MasterMix (Eppendorf, Hamburg, Germany).
Relative expression levels were normalized to EF1α and calcu-
lated using the 2
-ΔCt
method [25]. Primer sequences for the
genes of interest are presented in Table 1. After comparison
of the data by analysis of variance, the different groups were
compared using Fisher's t test (n = 3; P < 0.05 considered
significant).
The data discussed in this publication have been deposited in
the National Center for Biotechnology Information Gene
Expression Omnibus [26] and are accessible through Gene
Expression Omnibus Series accession number GSE6119.
Results
In an effort to describe more fully the influence of glucosamine
on the metabolism of articular chondrocytes, we studied the
effects of exogenous glucosamine and IL-1β on global expres-
sion patterns using microarrays. Articular chondrocytes from
rats were seeded into several flasks, and the media in one-half
was supplemented with glucosamine at 20 mM. Six hours
later, IL-1β at 10 ng/ml was added to one-half of the flasks
receiving glucosamine and to one-half of the untreated flasks.
Fourteen hours post IL-1β stimulation, the conditioned media
were collected and analyzed for NO production.
Previous studies have shown that, under appropriate condi-
tions, glucosamine is an effective inhibitor of IL-1β-induced
NO synthesis in chondrocytes. To help ensure that subse-
Arthritis Research & Therapy Vol 8 No 6 Gouze et al.
Page 4 of 14
(page number not for citation purposes)
quent microarray data provided an accurate representation of
the effects of glucosamine and IL-1β on chondrocyte tran-
scription, NO levels were used to verify that the cultures were
viable and responded fully and reproducibly to both molecules
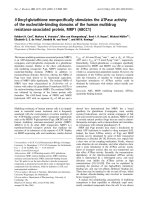
[13,22]. As shown in Figure 1, IL-1β alone was a potent stim-
ulus for NO production, generating a >10-fold increase in con-
ditioned media over background levels (28.3 ± 0.8 μM versus
2.4 ± 0.4 μM, respectively). In cultures receiving glucosamine
and IL-1β, NO synthesis was essentially at background levels.
Having confirmed that the culture systems were functioning
optimally, total RNA was extracted separately from each flask
and the OD 260/280 ratios were determined. RNA samples
with ratios greater than 1.8 were used to prepare labeled
cRNA probes, which were then hybridized to individual
Affymetrix 230 2.0 array chips representing the complete rat
genome.
Of the 31,042 probe sets (genes) present on the array,
27,061 were detected significantly above background on at
least one array set. Analysis of the overall results of the
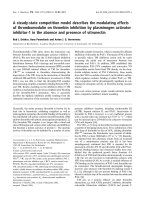
hybridization using hierarchical clustering of the samples
showed a high degree of similarity among the samples within
each treatment group (Figure 2). As expected, large differ-
ences were noted between the expression patterns of
untreated chondrocytes and those receiving IL-1β alone, illus-
trating the dramatic impact of IL-1β stimulation on chondro-
cyte biology. In stark contrast, however, the transcription
Table 1
Primer sequences used to quantify gene expression with real-time PCR
Gene Sequence (5' to 3')
Cartilage link protein Forward, GCATCAAGTGGACCAAGCTA
Reverse, GTAACTCCAATGCCACCACA
Collagen alpha 1 type II Forward, GTGGAGCAGCAAGAGCAAGGA
Reverse, CTTGCCCCACTTACCAGTGTG
CXCL5 (LIX) Forward, CACCCTGCTGGCATTTCTG
Reverse, AACCATGGCCGAGAAAGGA
MMP-3 Forward, CTGGAATGGTCTTGGCTCAT
Reverse, CTGACTGCATCGAAGGACAA
MMP-9 Forward, CCACCGAGCTATCCACTCAT
Reverse, GTCCGGTTTCAGCATGTTTT
MMP-12 Forward, TGCAGCTGTCTTTGATCCAC
Reverse, TCCAATTGGTAGGCTCCTTG
TIMP-3 Forward, GTACACAGGGCTGTGCAACTTTGTG
Reverse, CTTCTGCCGGATGCAGGCGTAGTG
EF1alpha Forward, GATGGCCCCAAATTCTTGAAG
Reverse, GGACCATGTCAACAATGGCAG
Figure 1
Nitric oxide production in chondrocytes following culture with elevated glucosamine and subsequent challenge by IL-1βNitric oxide production in chondrocytes following culture with elevated
glucosamine and subsequent challenge by IL-1β. Articular chondro-
cytes from rats were seeded into 20 flasks, which were divided into
four groups. Glucosamine was added to a final concentration of 20 mM
to two of the groups. Six hours later, 10 ng/ml IL-1β was added to one
group receiving glucosamine and to one previously untreated group.
NO production was assessed by measurement of nitrite in the condi-
tioned media from the four respective groups: untreated control, glu-
cosamine (Gln) alone, IL-1β alone, and glucosamine with IL-1β. Results
are expressed in μM nitrite, each bar representing the mean of five
assays. Error bars represent one standard deviation. *P < 0.05 versus
glucose control.
Available online />Page 5 of 14
(page number not for citation purposes)
profiles of the treatment groups cultured in the presence of
glucosamine, both with and without IL-1β, clustered closely
together on one branch of the hierarchical tree with high cor-
relation. The striking similarity of expression patterns between
these two groups indicated that, in the presence of glu-
cosamine, IL-1β had little influence on global transcription pat-
terns in chondrocytes. Furthermore, the expression patterns of
the treatment groups receiving glucosamine, both with and
without IL-1β, together shared a greater degree of similarity
with the samples in the untreated control group than the group
receiving IL-1β alone. The results of the individual treatment
groups are now discussed in more detail.
Effects of glucosamine alone on chondrocyte global
expression patterns
Overall, relative to untreated controls, incubation of chondro-
cytes with glucosamine alone led to a global shift in expression
across the genome. Of the 2,433 genes that showed a signif-
icant response (P < 0.0001), expression of 1,506 genes
decreased while expression of 927 genes increased. A list of
genes with known function that showed the greatest response
(a decrease in RNA signal by at least 80%, or an increase of
at least fivefold) is presented in Table 2.
No clear pattern was observed among the types of genes that
showed the greatest increase in RNA levels following expo-
sure to glucosamine. Curiously, MMP-13 (also termed colla-
genase-3) – a protease specific for type II collagen, a primary
ECM component of articular cartilage – was among the few
genes whose expression was strongly stimulated (in this case
approximately eightfold) by glucosamine. Interestingly, several
of the genes that showed a strong reduction in expression par-
ticipate in regulation of the cell cycle and cell division.
The data shown in Tables 3 and 4 further describe the effects
of glucosamine alone on chondrocyte expression patterns. Of
relevance to OA, incubation with exogenous glucosamine
alone led to about a twofold reduction in the expression of sev-
eral genes associated with the synthesis of cartilage ECM,
such as collagen type II, biglycan, and cartilage link protein, as
well as a twofold increase in MMP-3 RNA (Table 4). Beyond
these, glucosamine had no significant stimulatory effect at any
level on the expression of genes associated with the synthesis
and maintenance of articular cartilage ECM. These include
articular cartilage collagens, types VI, IX, XI and X, as well as
aggrecan. No significant increase in the synthesis of genes
important for glycosaminoglycan synthesis was observed,
including UDP-glucose pyrophosphorylase, UDP-glucose
dehydrogenase and hyaluronan synthase, among others (data
not shown).
Effects of IL-1β alone on global expression patterns in
chondrocytes
In our assays, IL-1β alone significantly affected the expression
of 2,813 genes (P < 0.0001). Among these, 1,675 genes
showed a reduction in RNA level while 1,138 genes showed
increased expression. A list of genes with known function that
showed the greatest response to IL-1β (a decrease by at least
80% or an increase of at least fivefold) is presented in Table
5. As seen from the table, incubation with IL-1β dramatically
increased the expression of numerous inflammatory cytokines
(IL-1α, IL-1β, IL-6, and IL-23), chemokines (CCL3, CCL5,
CCL7, CXCL1, CXCL2, and CXCL5), and growth factors
(BMP-2, BMP-6, BMP-7, and FGF-9) as well as proteins
involved in the synthesis of prostaglandin E
2
and NO (phos-
pholipase A
2
, COX-2, prostaglandin E
2
synthase, and NO syn-
thase). By increasing the expression of matrix
metalloproteinases (MMP-3, MMP-9, MMP-10, MMP-12, and
MMP-13) while inhibiting the expression of genes encoding
essential components of the ECM (such as collagen type II
and aggrecan-1), the elevated IL-1β also shifted the biology of
the chondrocytes, at least at the RNA level, toward articular
cartilage degradation. The response of the chondrocytes to
stimulation with IL-1β alone was therefore largely consistent
Figure 2
Changes in global expression patterns of chondrocytes induced by glucosamine and IL-1βChanges in global expression patterns of chondrocytes induced by glucosamine and IL-1β. A two-way agglomerative hierarchical clustering of sam-
ples. The treatment groups are indicated by the legend on the left (also see text; Gln, glucosamine). Only the normalized signal values of genes with
a significant (P < 0.0001) treatment effect were included. Each row represents a sample and each column a gene. Color intensities reflect relative
signal values, whereby red represents a higher level of gene expression, and green a lower level relative to the mean across all samples for each
gene. On the right, hierarchical clustering of the samples is indicated both within and among treatment groups. Longer lines represent greater dis-
similarity between samples. For these samples, one of the untreated control samples and two samples from the glucosamine-alone groups were
eliminated from the final analysis because they did not satisfy the quality control criteria of the microarray analysis.
Arthritis Research & Therapy Vol 8 No 6 Gouze et al.
Page 6 of 14
(page number not for citation purposes)
with previous single-gene studies [3,27] and high-throughput
studies, and further demonstrated the potency of this cytokine
as a mediator of inflammation and its capacity to influence
chondrocyte metabolism, particularly with respect to arthritis.
Effects of IL-1 on expression patterns of chondrocytes
cultured in the presence of glucosamine
Although glucosamine alone had no direct stimulatory effect
on the expression of genes associated with ECM synthesis, as
indicated in Tables 3, 4, 5 it proved to be a surprisingly potent,
broad-spectrum inhibitor of IL-1 stimulation across the entire
genome. Indeed, of the 2,813 genes whose expression was
significantly affected by IL-1 alone, either increased or
decreased, 6-hour preincubation of the chondrocytes with glu-
cosamine significantly blocked that effect in 2,055 genes
(~73%). Furthermore, of the IL-1β-sensitive genes whose
altered expression was not inhibited by exogenous glu-
cosamine, closer examination of the data revealed that glu-
cosamine alone had the same type of effect as IL-1 on that
gene and, likewise, enhanced or repressed expression (see
Tables 3, 4, 5).
With regard to arthritis, Tables 3 and 4 represent genes with
important roles in inflammation and articular cartilage ECM
maintenance that were significantly affected by IL-1 alone. In
parallel, the response of these genes to glucosamine alone,
and to IL-1β in the presence of glucosamine, is also shown. As
reflected in these tables, glucosamine significantly inhibited
Table 2
Genes whose expression showed the greatest change following incubation of chondrocytes with elevated glucosamine alone
Genes whose mean RNA levels were reduced >80% relative to untreated control cultures
Anaphase-promoting complex subunit
8
Cyclin-dependent kinase inhibitor 3 Kinesin-like protein 1 Selenium binding protein 2
Bone morphogenetic protein 4 Cytoskeleton associated protein 2 Kinesin-related protein KRP1 Shc SH2-domain binding protein 1
Calmodulin DVS27-related protein Lactose operon repressor
a
Solute carrier family 4, member 4
Carbonic anhydrase 3 Dynein, cytoplasmic, intermediate chain
1
Microtubule-associated motor KIF4 Sphingomyelin phosphodiesterase 3,
neutral
Cell cycle protein division p55CDC ER transmembrane protein Dri 42 NAD-dependent 15-
hydroxyprostaglandin deshydrogenase
Testin (TES1/TES2)
Cell division cycle 2 homolog A Esk splice form 1 Neural precursor cell expressed,
developmentally downregulated gene
4A
a
Thymidine kinase 1
Cell proliferation antigen Ki-67 Frizzled related protein (sfrp2 gene)
a
Neuropilin Topoisomerase (DNA)2 alpha
Cell-cycle-dependent 350K nuclear
protein
G2/mitotic-specific cyclin B
1
a
NUF2R protein Transforming acidic coiled-coil
containing protein 3
c-fos-induced growth factor (vascular
endothelial growth factor D)
Glycine amidinotransferase (l-
arginine:glycine amidinotransferase)
Pituitary tumor-transforming 1 Ubiquitin conjugating enzyme
Chemokine (C–X–C motif) ligand 12
a
Heat shock protein 90 beta Polo-like kinase homolog Vascular endothelial growth factor D
precursor
Clathrin light chain A (Lca) Hyaluronon mediated motility receptor
(RHAMM)
Protein regulating cytokinesis 1
Cyclin B
1
Insulin-like growth factor binding
protein 3
Rac GTPase-activating protein 1
a
Genes whose mean RNA levels were increased more than fivefold relative to untreated controls
Aldose reductase-like protein High mobility group AT-hook 1 Plasminogen activator inhibitor 2 type a Vesicle-associated membrane protein
1
ATP-binding cassette, subfamily G
(WHITE), member 1
Matrix metalloproteinase 13 Smhs 1 protein V-maf musculoapaneurotic
fibrosarcoma oncogene family protein
B
CD28 antigen Myo-inositol 1-phosphate synthase A1 Sodium-coupled ascorbic acid
transporter 2
FXYD domain containing ion transport
regulator 2
NADH-ubiquitone oxidoreductase
MLRQ subunit
Solute carrier family 1, member 3
a
Multiple probe sets.
Available online />Page 7 of 14
(page number not for citation purposes)
Table 3
Relative signal values of inflammatory genes significantly affected by IL-1 and/or glucosamine
Gene Treatment group
No glucosamine, no IL-1 Glucosamine, no IL-1 IL-1, no glucosamine Glucosamine with IL-1
Arginosuccinate synthetase 6.3 19.4 2247.3 267.2
β-Nerve growth factor 16.1 21.6 196.2 13.0
Bone morphogenetic protein 2 42.7 57.7 375.4 100.2
Bone morphogenetic protein 4 494.9 77.3 147.7 68.2
Bone morphogenetic protein 6 60.9 13.9 435.9 85.9
Bone morphogenetic protein 7 0.9 5.8 76.2 8.2
CCL3 (MIP-1a) - 0.1 690.7 2.6
CCL5 (RANTES) 2.1 2.7 310.1 8.1
CCL7 (MCP-3) 32.2 69.4 3076.0 662.8
CCL22 (MDC) 0.3 0.6 47.2 5.4
Cdc42 GTPase inhibiting protein 105.0 116.5 189.4 124.4
Colony-stimulating factor 1 126.9 51.1 307.8 140.8
Colony-stimulating factor 2 - 20.1 1210.7 17.6
Colony-stimulating factor 3 - 6.0 1253.7 6.5
CXCL1 (GROa) 168.2 36.6 1730.6 496.2
CXCL2 (GROb) - 37.5 2988.2 92.4
CXCL5 (LIX) 2.0 2.4 441.3 16.2
CXCL10 (IP-10) 10.7 8.1 74.4 15.6
CXCL11 (I-TAC) - - 110.2 3.4
CXCL12 (SDF-a/b) 122.8 5.9 88.7 10.9
Cyclooxygenase 1 184.0 593.4 192.2 493.1
Cyclooxygenase 2 61.9 117.0 3493.9 405.5
Cysteine knot superfamily 1 (bone morphogenetic protein
antagonist 1)
460.4 308.6 2174.9 732.7
Cytokine-induced neutrophil chemoattractant-2 15.2 54.4 3466.1 624.2
Dual-specificity phosphatase 6 179.9 88.9 658.7 109.9
Endothelial PAS domain protein 1 69.9 38.0 208.9 52.2
Fibroblast growth factor 7 1294.4 1078.9 1318.9 1745.9
Fibroblast growth factor 9 12.0 29.5 155.7 26.7
Fibroblast growth factor receptor 1 605.2 653.7 329.3 638.5
I-κBα 126.9 81.7 1108.4 399.0
I-κBβ 55.6 96.6 298.2 139.2
I-κBγ (NF-κB p105 subunit) 124.2 107.9 471.2 163.6
Insulin-like growth factor binding protein 3 81.6 7.4 249.9 10.4
Insulin-like growth factor binding protein 5 174.4 569.0 737.8 229.5
IL-1α 1.5 3.2 175.3 4.5
IL-1β - 2.4 119.4 2.7
IL-6 57.3 53.4 1717.8 159.0
IL-11 - - 124.4 -
IL-13 receptor, α 1 174.8 144.5 337.4 148.0
Arthritis Research & Therapy Vol 8 No 6 Gouze et al.
Page 8 of 14
(page number not for citation purposes)
the expression of the majority of genes whose products are
responsible for driving the arthritogenic activities of IL-1.
These products include the primary cytokines, chemokines,
synthetic and proteolytic proteins associated with the pathol-
ogy of OA. The protection, however, was not complete or uni-
form for all genes. For example, the IL-1β-enhanced
expression of COX-2, NO synthase, and IL-6 was inhibited by
>90%; however, in certain other cases it was less inhibited –
such as CD44, which was inhibited by ~50%. Expression of a
few key genes, such as collagen type II and MMP-13,
appeared not to be protected; however, Tables 3 and 4 show
that expression of these genes was also downregulated and
enhanced, respectively, by prior incubation with glucosamine
alone.
The protective effect of glucosamine was not limited specifi-
cally to inflammatory genes and ECM-related genes, but
encompassed numerous gene types across the entire. Inter-
estingly, the inhibitory effect of glucosamine toward IL-1 sign-
aling appeared far more influential on genes whose expression
was enhanced by IL-1β stimulation than on those genes in
which expression was repressed. This is best illustrated in
Table 5, where glucosamine was found to significantly block
IL-1β-induced expression in 107 of the 110 genes whose
RNA level was increased greater than fivefold. Expression of
two of the exceptions, MMP-13 and ring finger protein 28, was
found similarly enhanced by glucosamine alone. Only the IL-1-
enhanced expression of the IL-13 receptor α
2
chain was unaf-
fected (P < 0.0001) by glucosamine. Conversely, of the 35
genes whose transcription was repressed >80% by IL-1,
preincubation with glucosamine significantly prevented that
effect in only 10 genes. Glucosamine alone, however, also
downregulated transcription of the remaining 25 genes. With
very few exceptions, therefore, preincubation with glu-
cosamine effectively inhibits the response of chondrocytes to
subsequent stimulation with IL-1β.
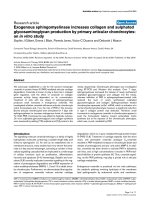
In an effort to validate the results of our microarray analyses,
using total RNA from the individual samples we generated
cDNA and used real-time PCR to determine the relative
changes for several genes of interest. As shown in Figure 3,
the patterns of expression of the six genes analyzed in this
manner were very similar to those from the microarray data.
Discussion
Using global expression analyses we studied the influence of
glucosamine on the molecular biology of the chondrocyte,
both alone and following challenge with IL-1β. Somewhat con-
trary to popular belief and several published reports, we found
no evidence that elevated levels of exogenous glucosamine
increased the transcription of genes with products associated
with the synthesis of articular cartilage ECM components.
Unlike the dramatic response elicited by IL-1β alone, whereby
dozens of genes in related classes were strongly affected,
IL-23α subunit p19 - - 766.5 -
Janus kinase 2 89.7 102.9 251.0 128.7
JunB proto oncogene 129.5 89.0 377.8 148.4
Mitogen-activated protein kinase phosphatase (CPG21) 19.1 47.5 300.2 52.3
Nitric oxide synthase 2 0.1 2.1 1033.9 66.1
Ornithine aminotransferase 1080.5 1125.0 868.6 1059.1
Ornithine decarboxylase antizyme inhibitor 322.1 239.4 336.9 186.6
Phospholipase A
2
, group 2A 175.5 44.7 2085.9 358.0
Phospholipase A
2
, group 4A 269.9 303.2 668.2 339.7
Phospholipase A
2
, group 5 44.0 18.2 260.7 66.7
Platelet-derived growth factor A 439.8 492.9 745.9 597.5
Prostaglandin E
2
synthase 32.8 46.9 3845.8 183.7
Pyrroline-5-carboxylate 602.5 643.8 348.3 609.3
Rel-B 31.6 28.7 186.2 71.5
Small inducible cytokine A
2
221.4 711.0 4835.8 2945.5
Small inducible cytokine A
20
26.9 137.8 4206.1 1609.7
Solute carrier family 7 (cationic amino acid transporter), member
8
8.1 19.4 560.3 21.7
Sox-4 533.0 460.8 248.5 572.2
TNF-induced protein 6 119.8 49.3 262.3 71.1
Table 3 (Continued)
Relative signal values of inflammatory genes significantly affected by IL-1 and/or glucosamine
Available online />Page 9 of 14
(page number not for citation purposes)
many by more than 100-fold, the response to glucosamine
was much more subtle. Since only a handful of genes were
stimulated more than fivefold, we were not able to assemble a
clear image of the net effect of glucosamine alone on chondro-
cyte biology. It was only in samples challenged with IL-1β that
a beneficial effect of glucosamine became evident. Indeed,
preincubation with glucosamine rendered the chondrocytes
essentially unresponsive to subsequent IL-1 stimulation, and
thereby proved to be highly chondroprotective. Our findings
here are in close agreement with previous single-gene analy-
ses that showed elevated glucosamine inhibited the IL-1-
induced expression of isolated genes such as COX-2, NO
synthase and IL-6, among others [13,17-20,22]. It is only
through the use of microarray technology, as shown here –
which permits simultaneous examination of the relative expres-
sion of all known genes – that a comprehensive profile can be
developed and the breadth of glucosamine-mediated chon-
droprotection is fully appreciated.
It should be emphasized that the conditions used in this study
represent supraphysiological levels of both glucosamine and
IL-1. As such, the results are not reflective of the in vivo situa-
tion encountered following oral administration of glucosamine
in OA; nor are they representative of the amplitude of the bio-
logical response that may be achieved. This, however, was not
the intention behind the experimental design. Our goal was to
provide a comprehensive depiction of the effects of glu-
cosamine on the biology of the chondrocyte. We therefore
selected doses of both IL-1 and glucosamine that provided
robust responses in our bioassay (NO synthesis). When
Table 4
Relative signal values of articular cartilage extracellular-matrix-related genes significantly affected by IL-1 and/or glucosamine
Gene Treatment group
No glucosamine, no IL-1 Glucosamine, no IL-1 IL-1, no glucosamine Glucosamine with IL-1
A disintegrin and metalloproteinase domain 15
142.9 121.3 64.9 98.3
A disintegrin and metalloproteinase domain 17
434.6 533.1 897.4 616.6
ADAMTS-1
457.0 202.1 996.0 359.7
ADAMTS-4
79.2 149.8 76.0 149.4
Aggrecan-1
162.6 154.7 47.1 117.3
Biglycan
80.9 26.1 126.8 19.2
Cartilage link protein
662.1 284.3 75.9 166.7
Chondroitin sulfate proteoglycan 2 (Versican)
135.3 45.3 418.1 60.0
Collagen type II alpha 1, chain precursor
106.4 42.0 3.8 20.6
Collagen type III alpha 1
2710.2 2720.0 1320.4 2242.6
Collagen type VIII alpha 1
622.6 362.5 857.9 493.8
Collagen type XI alpha 1
2510.6 2090.9 1471.5 1830.9
Laminin
α
-4 chain precursor
238.3 510.2 158.6 410.8
Matrix metalloproteinase 2
1014.0 1388.4 1825.7 1886.2
Matrix metalloproteinase 3
894.7 1966.4 5787.4 4223.6
Matrix metalloproteinase 9
- 11.1 2194.0 36.5
Matrix metalloproteinase 10
- 7.8 271.2 39.6
Matrix metalloproteinase 12
4.9 13.4 1132.0 84.9
Matrix metalloproteinase 13
268.3 2126.9 4497.4 3871.2
Syndecan 2
1515.8 1292.9 656.8 963.4
Syndecan 4
927.7 796.8 2049.2 1327.5
Thrombospondin 4 precursor
2535.4 2217.7 1224.9 1662.6
TIMP-1
1786.8 1857.2 3049.8 2311.4
TIMP-2
995.9 937.0 726.9 923.1
TIMP-3
1317.1 1983.9 1105.3 1859.0
Arthritis Research & Therapy Vol 8 No 6 Gouze et al.
Page 10 of 14
(page number not for citation purposes)
Table 5
Genes whose expression showed the greatest change following incubation of chondrocytes with elevated IL-1β alone: genes of
known function whose expression was most affected by IL-1 alone
Genes whose RNA levels were reduced >80% relative to untreated control cultures
• A disintegrin and metaloproteinase
domain 33
• c-fos-induced growth factor (vascular
endothelial growth factor D)
Kruppel associated box zinc finger 1 • Smoothelin
• Actin alpha 1 • Collagen type II alpha 1, chain
precursor
• Microfibril-associated glycoprotein
precursor
Solute carrier family 39 (iron-regulated
transporter), member 1
Aggrecan 1 Crystallin, alpha B • Midline 1 • Sphingomyelin phosphodiesterase 3,
neutral
• Ankyrin-like repeat protein Distal-less homeobox • Mitochondrial ribosomal protein L53 • Transforming growth factor, beta 2
• Annexin III (Lipocortin III) • DVS27-related protein Myocilin precursor • Zinc finger protein SLUG (neutral
crest transcription factor Slug)
Cadherin-8 precursor • Dynein, cytoplasmic, intermediate
chain 1
• NAD-dependent 15-
hydroxyprostaglandin dehydrogenase
Calpain 6 • Enolase 3, beta Osteomodulin (osteoadherin)
• Carbonic anhydrase 3 Four and a half LIM domains 1 • Palmdelphin
a
Cartilage link protein 1
a
• Heat shock protein HSP 90 beta
a
• Phosphoribosyl pyrophosphate
synthestase 2
• Caveolin 3 Insulin-like growth factor binding
protein 4 precursor
• Programmed cell death protein 7
Genes whose RNA levels were increased more than fivefold relative to untreated controls
Adaptor protein with pleckstrin
homology and src homology 2 domains
Cyclooxygenase-2 Keratin, type II cryosqueletal 8 Plasminogen activator, urokinase
receptor
Adenosine A2B receptor Cytochrome P450, family 26, subfamily
b, polypeptide 1
Lactose operon repressor Prostaglandin E synthase
a
Adenosine monophosphate deaminase
3
Cytochrome P450, subfamily 7B,
polypeptide 1
a
Laminin beta-2 chain precursor Purigenic receptor P2Y, G-protein
coupled 2
Aldose reductase-like protein Cytokine-induced neutrophil
chemoattractant-2
a
MAP-kinase phosphatase (cpg21) RAB27B, member RAS oncogene
family
Apoptotic death agonist BID EGL nine homolog 3 (C. elegans) Matrix metalloproteinase 3 Rat VL30 element
a
Arginosuccinate synthetase Endothelial cell-specific molecule 1 Matrix metalloproteinase 9
a
Receptor-interacting serine-threonine
kinase 2
ATP-binding cassette, sub-family G
(WHITE), member 1
Epiregulin precursor Matrix metalloproteinase 10 RelB
BCL2-related protein A1 Fatty acid binding protein 4 Matrix metalloproteinase 12 Retinol-binding protein 1
Beta-nerve growth factor F-box protein Fbx5 • Matrix metalloproteinase 13 • Ring finger protein 28
Bloom's syndrome protein homolog
(mBLM)
Fibroblast growth factor 9 Mesothelin Schlafen 4
Bone morphogenetic protein 2
a
Follistatin Microtubule-associated protein Small inducible cytokine A2
Bone morphogenetic protein 6
a
Fos-like antigen 1 6
a
Smhs1 protein
Bone morphogenetic protein 7 Gardner-Rasheed feline sarcoma viral
(Fgr) oncogen homolog
Mitochondrial solute carrier protein Solute carrier family 1, member 1
Brain-specific angiogenesis inhibitor 1-
associated protein 2
GATA-binding protein 2 Myotubularin related protein 7 Solute carrier family 1, member 3
CCL3 (Mip-1a) Gro NADH-ubiquinone oxidoreductase
MLRQ subunit
Solute carrier family 7 (cationic amino
acid transporter, y
+
system), member 1
CCL5 (RANTES) Growth arrest specific 7 Neurofilament, heavy polypeptide Solute carrier family 11, member 2
CCL7 (MCP-3) GTP cyclohydrolase 1 Neuron specific protein PEP-19
(Purkinje cell protein 4)
Solute carrier family 20 (phosphate
transporter), member 1
CD44 antigen High mobility group AT-hook 1 Neuropeptide Y Superoxide dismutase 2
Chemokine receptor (LCR1)
a
IκB-α Neurospin precursor T-cell death associated gene
Available online />Page 11 of 14
(page number not for citation purposes)
attempting to interpret the ensuing microarray data, therefore,
we could be confident that the cells received functional doses
of both molecules. In doing this, we aimed to provide a repre-
sentation of the types of effects that might be achieved if glu-
cosamine could be delivered to the joint tissues at functionally
effective doses.
Although the underlying mechanisms that drive OA are not
completely understood, a broader appreciation for the involve-
ment of inflammatory cytokines such as IL-1 has emerged over
the past several years [28]. Our results here underscore the
potential of IL-1β as an arthritic mediator with the capacity to
drive the key pathways typically associated with the pathogen-
esis of OA. As shown here, as well as by others, IL-1 abruptly
shifts the metabolism of the chondrocyte stimulating the
expression of numerous genes, such that the cells responsible
for maintenance of the articular cartilage matrix are converted
into effector cells that degrade the matrix and produce numer-
ous inflammatory and chemoattractant molecules. Although
our experiments were performed with high concentrations of
IL-1 that far exceed physiological levels, IL-1 is a potent
cytokine with a strong spare receptor effect. It is easy to envi-
sion how persistent exposure at much lower levels may more
slightly, but fundamentally, alter the biology of the chondro-
cytes, effecting over time a gradual but steady shift toward car-
tilage degradation. Pharmacologics that can effectively inhibit
the activities of this and other inflammatory cytokines could
therefore be highly beneficial in the treatment of arthritic
conditions.
Acetaminophen and nonsteroidal anti-inflammatory drugs
such as ibuprofen and naproxen (and until recently celecoxib
and rofecoxib) are the most widely used pharmacologics in the
management of OA [29]. The latter are thought to specifically
inhibit the activity of the cyclooxygenases, enzymes that medi-
ate the conversion of arachidonic acid to prostaglandins. As
demonstrated here, however, prostaglandin synthesis only
accounts for one of many of the pathologic processes that
occur in response to inflammatory cytokines such as IL-1.
Thus, while cyclooxygenase inhibitors are useful in the man-
agement of certain symptoms, primarily pain, much of the
underlying pathogenesis of OA goes unchecked. In our exper-
iments exogenous glucosamine effectively rendered the
chondrocytes unresponsive to IL-1 stimulation. A potential
advantage of this amino sugar is therefore its capacity to
inhibit inflammatory signaling across the entire spectrum.
In previous work, we and others have demonstrated that IL-1-
mediated NF-κB activation and nuclear translocation were
reduced in chondrocytes in the presence of elevated exoge-
nous glucosamine [17,22]. We recently found that glu-
cosamine also inhibits aspects of inflammatory signaling by
TNFα (unpublished observation). Others have shown its ability
to block the effects of lipopolysaccharide in chondrocytes as
well as other cell types. Lipopolysaccharide and IL-1 have
overlapping cell signaling pathways mediated through Toll-like
and IL-1 receptors, respectively [30,31]. Ligand binding of
these receptors leads to activation of Myd88, IL-1 receptor-
activated kinases, and TNF receptor-associated factor 6,
which in turn activates cytosolic NF-κB. Inflammatory TNF
receptor 1 signaling, mediated through the TNF receptor-
associated death domain adaptor protein, and interaction with
receptor interacting protein and TNF receptor-associated fac-
tor 2 also work to activate NF-κB. For these inflammatory
Cholesterol 15-hydroxylase IκB-β (nuclear factor kappa B p105
subunit)
Nitric oxide synthase 2 Testis-specific protein Bs13
Claudin-3 Inhibin beta-A Organic cation transporter OCTN1 Tissue factor pathway inhibitor 2
Colony stimulating factor 2
(granulocyte-macrophage)
Inhibitor of apoptosis protein 1 Parvalbumin Tissue-type transglutaminase
Colony stimulating factor 3 Insulin-like growth factor-binding
protein 5
Phosphodiesterase 4B, cAMP-specific
(dunce (Drosophila) homolog
phosphodiesterase E
4
)
Toll-like receptor 2
Complement factor B precursor (C3/
C5 convertase)
Interleukin 1 alpha Phospholipase A2, group 5 Tumor necrosis factor alpha-induced
protein 2
a
CXCL1 (GROa) Interleukin 1 beta Phospholipase A2, group IIA (platelets,
synovial fluid)
Tumor necrosis factor receptor
superfamily member 5 precursor
CXCL2 (GROb) Interleukin 6 (interferon, beta 2) Phospholipid scramblase 1 Tumor necrosis factor receptor
superfamily member 9 precursor
CXCL5 (LIX) Interleukin 23, alpha subunit p19 Plasminogen activator inhibitor 2 type A Uridine phosphorylase
CXCL10 (IP-10) • Interleukin 13 receptor, alpha 2 Plasminogen activator, tissue
a
Represents multiple probe sets. Bold circles indicate genes for which the IL-1-mediated effects on transcription were not inhibited by exogenous
glucosamine (see text).
Table 5 (Continued)
Genes whose expression showed the greatest change following incubation of chondrocytes with elevated IL-1β alone: genes of
known function whose expression was most affected by IL-1 alone
Arthritis Research & Therapy Vol 8 No 6 Gouze et al.
Page 12 of 14
(page number not for citation purposes)
agents, therefore, NF-κB activation appears perhaps the earli-
est common site for intervention by glucosamine. Whether this
inhibition occurs through direct interaction with glucosamine
or downstream products of the hexosamine pathway, or is a
secondary consequence of other cellular processes influ-
enced by elevated glucosamine, has yet to be established.
While the NF-κB pathway is a central player in inflammatory
signal transduction, IL-1 and TNF also share the capacity to
activate the stress-activated protein kinase/c-Jun N-terminal
kinase and p38 mitogen-activated protein kinase, as well as
others [32,33]. In previous work, however, glucosamine did
not appear to inhibit nuclear translocation of activator protein
1 following stimulation of chondrocytes with IL-1 [22]; how-
ever, the relationship between this signaling pathway and glu-
cosamine has not been studied in detail. Given the breadth of
chondroprotection provided by glucosamine as shown here, it
is likely that these signaling pathways also are functionally
blocked by glucosamine.
In light of the capacity of glucosamine to influence signal trans-
duction and cellular metabolism, an additional consideration is
how sustained exposure to elevated levels may influence
chondrocyte biology, and in turn influence the vitality of articu-
lar cartilage in the long term. From our experiments, it appears
that glucosamine alters the overall responsiveness of the
chondrocyte to inflammatory signaling. Along these lines, ele-
vated glucosamine has also been found to cause a loss of sen-
sitivity to stimulation of insulin and IGF-1 receptor tyrosine
kinase activity in certain cells in culture, and leads to insulin
resistance in experimental animals [34-36]. How consumption
of glucosamine may alter the capacity of the chondrocyte to
respond to other external stimuli, including various anabolic
signals, therefore remains uncertain. These studies have not
been undertaken but should be considered in light of our
results here and of the popularity of glucosamine as a nutri-
tional supplement.
Despite the results of our microarray and other in vitro assays
that have demonstrated the capacity of glucosamine to
impede inflammatory stimulation in vitro, the clinical value of
glucosamine in the treatment of OA remains controversial
[11,37]. The recently published results of the Glucosamine/
chondroitin Arthritis Intervention Trial showed that, across the
larger population of patients with OA, glucosamine and chon-
Figure 3
Real-time PCR analyses of cDNA generated from chondrocytes treated with glucosamine (Gln) and IL-1βReal-time PCR analyses of cDNA generated from chondrocytes treated with glucosamine (Gln) and IL-1β. Data presented as the mean + standard
error of the mean (n = 3). *P < 0.05 versus untreated, #P < 0.05 versus IL-1β alone.
Available online />Page 13 of 14
(page number not for citation purposes)
droitin sulfate were no more effective than placebo [12]. In a
predetermined subpopulation of those with moderate to
severe pain, however, there appeared to be significant benefit.
The basis for these discrepancies is unknown. One possible
explanation may be the relative participation of inflammatory
cytokines in different subpopulations; perhaps the effects of
glucosamine and chondroitin are better realized in patients
with more severe OA that have greater involvement of IL-1.
Another reason for the limited clinical response overall may be
the extent to which glucosamine enters the human circulation
and the joint space after the recommended oral dose. Several
studies suggest that effective intra-articular concentrations
may not always be achieved [38]. The route of administration
may therefore be key to reach the necessary concentration of
glucosamine to take full advantage of its potential effects. A
method by which it may be possible to generate effective
levels of glucosamine in the joint tissues is through local gene
transfer of the enzyme glutamine 6-phosphate-amido-trans-
ferase, which is a limiting enzyme in glucosamine synthesis.
The proof of concept has already been demonstrated [39,40],
laying the foundation for new directions to exploit the thera-
peutic potential of glucosamine in OA.
Conclusion
Using the assays used in the present study, the anti-arthritic
properties attributed to the consumption of glucosamine do
not appear related to cartilage matrix synthesis, but more
related to its ability to globally inhibit the deleterious effect of
IL-1β signaling. The data suggest that the potential benefit to
ingestion or administration of glucosamine lies primarily with
its anti-inflammatory properties and not with the replenishment
of the ECM. These results support the use of glucosamine as
an anti-arthritic agent if it can be administered at the appropri-
ate dosage to joint tissues.
Competing interests
The authors declare that they have no competing interests.
Authors' contributions
J-NG conceived of and carried out the study. EG and SCG
participated in the study design and coordination. MPP per-
formed the array hybridization and the data analysis. MLB,
EAD, JDK, PPL, KRP, JSS and RSW contributed to scientific
discussions and helped to draft the manuscript. All authors
read and approved the final manuscript.
Acknowledgements
This work was supported in part by grants AR053661 and AR48566
from the National Institute for Arthritis Musculoskeletal and Skin Dis-
eases of the National Institutes of Health.
References
1. Dieppe P, Chard J, Lohmander S, Smith C: Osteoarthritis. Clin
Evid 2002, 7:1071-1090.
2. Felson DT, Lawrence RC, Hochberg MC, McAlindon T, Dieppe
PA, Minor MA, Blair SN, Berman BM, Fries JF, Weinberger M, et
al.: Osteoarthritis: new insights. Part 2: treatment approaches.
Ann Intern Med 2000, 133:726-737.
3. Fernandes JC, Martel-Pelletier J, Pelletier JP: The role of
cytokines in osteoarthritis pathophysiology. Biorheology 2002,
39:237-246.
4. Martel-Pelletier J, Alaaeddine N, Pelletier JP: Cytokines and their
role in the pathophysiology of osteoarthritis. Front Biosci
1999, 4:D694-D703.
5. Kaufman DW, Kelly JP, Rosenberg L, Anderson TE, Mitchell AA:
Recent patterns of medication use in the ambulatory adult
population of the United States: the Slone survey. JAMA 2002,
287:337-344.
6. Smalley WE, Ray WA, Daugherty JR, Griffin MR: Nonsteroidal
anti-inflammatory drugs and the incidence of hospitalizations
for peptic ulcer disease in elderly persons. Am J Epidemiol
1995, 141:539-545.
7. Tamblyn R, Berkson L, Dauphinee WD, Gayton D, Grad R, Huang
A, Isaac L, McLeod P, Snell L: Unnecessary prescribing of
NSAIDs and the management of NSAID-related gastropathy in
medical practice. Ann Intern Med 1997, 127:429-438.
8. D'Ambrosio E, Casa B, Bompani R, Scali G, Scali M: Glu-
cosamine sulphate: a controlled clinical investigation in
arthrosis. Pharmatherapeutica 1981, 2:504-508.
9. McAlindon T, Formica M, LaValley M, Lehmer M, Kabbara K: Effec-
tiveness of glucosamine for symptoms of knee osteoarthritis:
results from an internet-based randomized double-blind con-
trolled trial. Am J Med 2004, 117:643-649.
10. Muller-Fassbender H, Bach GL, Haase W, Rovati LC, Setnikar I:
Glucosamine sulfate compared to ibuprofen in osteoarthritis
of the knee. Osteoarthritis Cartilage 1994, 2:61-69.
11. Reginster JY, Deroisy R, Rovati LC, Lee RL, Lejeune E, Bruyere O,
Giacovelli G, Henrotin Y, Dacre JE, Gossett C: Long-term effects
of glucosamine sulphate on osteoarthritis progression: a ran-
domised, placebo-controlled clinical trial. Lancet 2001,
357:
251-256.
12. Clegg DO, Reda DJ, Harris CL, Klein MA, O'Dell JR, Hooper MM,
Bradley JD, Bingham CO 3rd, Weisman MH, Jackson CG, et al.:
Glucosamine, chondroitin sulfate, and the two in combination
for painful knee osteoarthritis. N Engl J Med 2006,
354:795-808.
13. Gouze JN, Bordji K, Gulberti S, Terlain B, Netter P, Magdalou J,
Fournel-Gigleux S, Ouzzine M: Interleukin-1β down-regulates
the expression of glucuronosyltransferase I, a key enzyme
priming glycosaminoglycan biosynthesis: influence of glu-
cosamine on interleukin-1β-mediated effects in rat
chondrocytes. Arthritis Rheum 2001, 44:351-360.
14. Byron CR, Orth MW, Venta PJ, Lloyd JW, Caron JP: Influence of
glucosamine on matrix metalloproteinase expression and
activity in lipopolysaccharide-stimulated equine chondrocytes.
Am J Vet Res 2003, 64:666-671.
15. Piperno M, Reboul P, Hellio Le Graverand MP, Peschard MJ,
Annefeld M, Richard M, Vignon E: Glucosamine sulfate modu-
lates dysregulated activities of human osteoarthritic chondro-
cytes in vitro. Osteoarthritis Cartilage 2000, 8:207-212.
16. Shikhman AR, Kuhn K, Alaaeddine N, Lotz M: N-acetylglu-
cosamine prevents IL-1β-mediated activation of human
chondrocytes. J Immunol 2001, 166:5155-5160.
17. Largo R, Alvarez-Soria MA, Diez-Ortego I, Calvo E, Sanchez-Per-
naute O, Egido J, Herrero-Beaumont G: Glucosamine inhibits IL-
1β-induced NFκB activation in human osteoarthritic
chondrocytes. Osteoarthritis Cartilage 2003, 11:290-298.
18. Chan PS, Caron JP, Rosa GJ, Orth MW: Glucosamine and chon-
droitin sulfate regulate gene expression and synthesis of nitric
oxide and prostaglandin E
2
in articular cartilage explants.
Osteoarthritis Cartilage 2005, 13:387-394.
19. Bassleer C, Rovati L, Franchimont P: Stimulation of proteogly-
can production by glucosamine sulfate in chondrocytes iso-
lated from human osteoarthritic articular cartilage in vitro.
Osteoarthritis Cartilage 1998, 6:427-434.
20. Fenton JI, Chlebek-Brown KA, Caron JP, Orth MW: Effect of glu-
cosamine on interleukin-1-conditioned articular cartilage.
Equine Vet J Suppl 2002, 34:219-223.
21. Sandy JD, Gamett D, Thompson V, Verscharen C: Chondrocyte-
mediated catabolism of aggrecan: aggrecanase-dependent
cleavage induced by interleukin-1 or retinoic acid can be inhib-
ited by glucosamine. Biochem J 1998, 335:59-66.
Arthritis Research & Therapy Vol 8 No 6 Gouze et al.
Page 14 of 14
(page number not for citation purposes)
22. Gouze JN, Bianchi A, Becuwe P, Dauca M, Netter P, Magdalou J,
Terlain B, Bordji K: Glucosamine modulates IL-1-induced acti-
vation of rat chondrocytes at a receptor level, and by inhibiting
the NF-kappa B pathway. FEBS Lett 2002, 510:166-170.
23. Kuettner KE, Pauli BU, Gall G, Memoli VA, Schenk RK: Synthesis
of cartilage matrix by mammalian chondrocytes in vitro. I. Iso-
lation, culture characteristics, and morphology. J Cell Biol
1982, 93:743-750.
24. Green LC, Wagner DA, Glogowski J, Skipper PL, Wishnok JS,
Tannenbaum SR: Analysis of nitrate, nitrite, and
15N
nitrate in
biological fluids. Anal Biochem 1982, 126:131-138.
25. Livak KJ, Schmittgen TD: Analysis of relative gene expression
data using real-time quantitative PCR and the 2(-Delta Delta
C(T)) Method. Methods 2001, 25:402-408.
26. National Center for Biotechnolgy Information Gene Expres-
sion Omnibus [ />]
27. Malemud CJ, Islam N, Haqqi TM: Pathophysiological mecha-
nisms in osteoarthritis lead to novel therapeutic strategies.
Cells Tissues Organs 2003, 174:34-48.
28. Goldring SR, Goldring MB: The role of cytokines in cartilage
matrix degeneration in osteoarthritis. Clin Orthop Relat Res
2004, 427(Suppl):S27-S36.
29. Pavelka K: Symptomatic treatment of osteoarthritis: paraceta-
mol or NSAIDs? Int J Clin Pract Suppl 2004, 144:5-12.
30. Bowie A, O'Neill LA: The interleukin-1 receptor/Toll-like recep-
tor superfamily: signal generators for pro-inflammatory inter-
leukins and microbial products. J Leukoc Biol 2000,
67:508-514.
31. Dauphinee SM, Karsan A: Lipopolysaccharide signaling in
endothelial cells. Lab Invest 2006, 86:9-22.
32. Hu WH, Johnson H, Shu HB: Activation of NF-kappaB by FADD,
Casper, and caspase-8. J Biol Chem 2000, 275:10838-10844.
33. Inoue J, Ishida T, Tsukamoto N, Kobayashi N, Naito A, Azuma S,
Yamamoto T: Tumor necrosis factor receptor-associated factor
(TRAF) family: adapter proteins that mediate cytokine
signaling. Exp Cell Res 2000, 254:14-24.
34. Sakai K, Clemmons DR: Glucosamine induces resistance to
insulin-like growth factor I (IGF-I) and insulin in Hep G2 cell
cultures: biological significance of IGF-I/insulin hybrid
receptors. Endocrinology 2003, 144:2388-2395.
35. Han DH, Chen MM, Holloszy JO: Glucosamine and glucose
induce insulin resistance by different mechanisms in rat skel-
etal muscle. Am J Physiol Endocrinol Metab 2003,
285:E1267-E1272.
36. Bailey CJ, Turner SL: Glucosamine-induced insulin resistance
in L6 muscle cells. Diabetes Obes Metab 2004, 6:293-298.
37. Chard J, Dieppe P: Glucosamine for osteoarthritis: magic, hype,
or confusion? It's probably safe-but there's no good evidence
that it works. BMJ 2001, 322:1439-1440.
38. Laverty S, Sandy JD, Celeste C, Vachon P, Marier JF, Plaas AH:
Synovial fluid levels and serum pharmacokinetics in a large
animal model following treatment with oral glucosamine at
clinically relevant doses. Arthritis Rheum 2005, 52:181-191.
39. Gouze JN, Stoddart MJ, Gouze E, Palmer GD, Ghivizzani SC,
Grodzinsky AJ, Evans CH: In vitro gene transfer to chondrocytes
and synovial fibroblasts by adenoviral vectors. Methods Mol
Med 2004, 100:147-164.
40. Gouze JN, Gouze E, Palmer GD, Kaneto H, Ghivizzani SC,
Grodzinsky AJ, Evans CH: Adenovirus-mediated gene transfer
of glutamine: fructose-6-phosphate amidotransferase antago-
nizes the effects of interleukin-1β on rat chondrocytes. Oste-
oarthritis Cartilage 2004, 12:217-224.