Báo cáo khoa học: " Biological impact of geometric uncertainties: what margin is needed for intra-hepatic tumors" ppsx
Bạn đang xem bản rút gọn của tài liệu. Xem và tải ngay bản đầy đủ của tài liệu tại đây (895.09 KB, 12 trang )
Kuo et al. Radiation Oncology 2010, 5:48
/>Open Access
RESEARCH
© 2010 Kuo et al; licensee BioMed Central Ltd. This is an Open Access article distributed under the terms of the Creative Commons At-
tribution License ( which permits unrestricted use, distribution, and reproduction in any
medium, provided the original work is properly cited.
Research
Biological impact of geometric uncertainties: what
margin is needed for intra-hepatic tumors?
Hsiang-Chi Kuo*
1,2
, Wen-Shan Liu
3
, Andrew Wu
1,4
, Dennis Mah
1
, Keh-Shih Chuang
2
, Linda Hong
1
, Ravi Yaparpalvi
1
,
Chandan Guha
1
and Shalom Kalnicki
1
Abstract
Background: To evaluate and compare the biological impact on different proposed margin recipes for the same
geometric uncertainties for intra-hepatic tumors with different tumor cell types or clinical stages.
Method: Three different margin recipes based on tumor motion were applied to sixteen IMRT plans with a total of
twenty two intra-hepatic tumors. One recipe used the full amplitude of motion measured from patients to generate
margins. A second used 70% of the full amplitude of motion, while the third had no margin for motion. The biological
effects of geometric uncertainty in these three situations were evaluated with Equivalent Uniform Doses (EUD) for
various survival fractions at 2 Gy (SF
2
).
Results: There was no significant difference in the biological impact between the full motion margin and the 70%
motion margin. Also, there was no significant difference between different tumor cell types. When the margin for
motion was eliminated, the difference of the biological impact was significant among different cell types due to
geometric uncertainties. Elimination of the motion margin requires dose escalation to compensate for the biological
dose reduction due to the geometric misses during treatment.
Conclusions: Both patient-based margins of full motion and of 70% motion are sufficient to prevent serious dosimetric
error. Clinical implementation of margin reduction should consider the tumor sensitivity to radiation.
Background
Primary hepatocellular carcinoma (HCC) and liver
metastases are common in East Asia and Africa. The vol-
ume of liver cancer patients in the United States increases
each year [1]. Due to the poor tolerance of the whole liver
to radiation, radiation therapy (RT) has conventionally
played a very limited role in treating liver cancer.
Recently, advanced RT techniques (3D conformal & ste-
reotactic radiotherapy) have been applied to unresectable
focal intrahepatic cancer to improve the local control rate
without serious radiation-induced liver disease (RILD)
[2,3]. Michigan's group [2] has showed that HCC treat-
ment with RT is promising. In particular, the response
rate, measured by the shrinkage of the tumor volume,
could be as high as 90%. In 2002, HC Park et al [4] found
the response rates of HCC were 29.2%, 68.6%, and 77.1%
for doses 40 Gy, 40-50 Gy, and 50 Gy, respectively (corre-
sponding to a BED of 47.2 Gy, 47.2-59 Gy, and 59 Gy,
respectively). Another group [5] found that the response
rates were 46.7% in biological equivalent dose (BED) <50
Gy and 72.8% in BED > 50 Gy. For the treatment of HCC
with portal vein thrombosis (PVT), two other groups
[6,7] also showed a dose dependence of the local tumor
response. These clinical results [2-6] &[7] reveal that
intra-hepatic tumor radiation response is dose dependent
regardless of the presence of PVT.
Another potential biologic marker of local recurrence
after radiotherapy is the intrinsic tumor radiosensitivity.
Using SF
2
(surviving fraction of tumor cell colony at 2 Gy)
as an end point for intrinsic radiosensitivity, some clinical
studies have evaluated the correlation of SF
2
with clinical
stage as an independent prognostic factor of local tumor
control [8-10]. These studies demonstrated a close asso-
ciation of SF
2
with recurrence of cervix, and head and
neck tumors, but not glioblastomas. The mechanism of
radiosensitivity of hepatocarcinoma cells after radiother-
apy is not well understood. However, laboratory studies
* Correspondence:
1
Department of Radiation Oncology, Montefiore Medical Center, USA
Full list of author information is available at the end of the article
Kuo et al. Radiation Oncology 2010, 5:48
/>Page 2 of 12
[11] have confirmed that SF
2
was significantly correlated
with the hepatic carcinoma cell radiosensitivity. Since
radiosensitivity is an important factor influencing the
prognosis of radiotherapy treatment, it is important to
consider the radiation response for different clinical
stages and the tumor cell types in the treatment of intra-
hepatic tumors.
An intra-hepatic tumor is a lesion situated within the
abdomen, which has great geometric uncertainty due to
respiratory motion (1~2.5 cm) [12] and daily setup varia-
tions (0.5~1 cm). These uncertainties may affect the
radiotherapy treatment outcome especially for Intensity
Modulated Radiotherapy (IMRT) delivery. The effects of
organ motion on dose delivery by dynamic multi-leaf col-
limators (DMLC) have been studied extensively [13-15].
These results showed that the interplay between MLC
leaf motion and organ motion did not influence the
expected dose to the moving organ in highly fractionated
IMRT delivery (approximately thirty fractions). They also
found that a one cm motion margin is clinically accept-
able in terms of fluence distortion and CTV (clinical tar-
get volume) coverage. Investigations of the influence of
setup uncertainty on target coverage have focused on less
mobile targets such as on head and neck and prostate
cancer [16,17]. Recently Balter [18] evaluated the setup
uncertainties on treatment plans for focal liver tumors
and found the change of the effective normal liver volume
difference was within 3%.
Geometric uncertainties are traditionally overcome by
adding adequate margin to CTV to ensure target dose
coverage and normal tissue sparing. ICRU (International
Commission on Radiation Units and Measurements)
report 62 [19] introduced the concept of an internal mar-
gin (IM) to take into account variations in size, shape, and
position of the CTV in reference to the patient's anatomi-
cal reference points and also the concept of a setup mar-
gin (SM) to take into account all uncertainties in patient-
beam positioning in reference to the treatment machine
coordinate system. Report 62 suggests, instead of adding
the internal margin and the setup margin linearly, a com-
promise has to be sought. The majority of the margin
schemes are aimed at maintaining a minimum dose (e.g.
95% of the prescribed dose) to the CTV for a majority (e.
g. 90%) of a patient population or a group of test plans
[20,21]. For liver, the uncertainty attributed to respiratory
motion is large compared to other setup errors and
should be considered separately. Mckenzie et al [22] pro-
posed a full respiratory motion amplitude (A) be added
on top of other errors. Ten Haken et al [23] proposed the
elimination of the respiratory margin while escalating the
dose to an amount with the same normal tissue complica-
tion probability (NTCP) of normal liver. Van Herk et al
[21] proposed a 0.7 A margin for motion amplitudes
larger than one cm. These studies compared the geomet-
rical impact for fractionated treatment with or without
biological model. Molinelli et al [24] compared different
margin protocols with 0 mm, 5 mm, and 10 mm in either
radial or cranial-caudal directions for SBRT treatment of
liver with single tumor type of SF
2
= 0.5.
Table 1 summarizes the margin recopies and purposes
of these studies. None of these studies correlate the size
of margin with different clinical stage or the cell types of
different radiosensitivity. Since the clinical stage and the
radiosensitivity of different cell types are important prog-
nostic factors of the tumor response and tumor control,
we hypothesize that the margin defined for intrahepatic
tumors should also consider variations in radiosensitivity
which would depend upon different tumor cell types and
different clinical stages. Here, different proposed margin
schemes were compared for the dose smearing results on
the targets with the same geometric uncertainties. EUD is
an approach which calculates a uniform dose value from
a non-uniform dose distribution that would result in the
same biological effects (the survival of the same number
of clonogens) in both. The non-uniform dose distribu-
tions after the dose smearing were converted into EUD at
different SF
2
values to evaluate the biological impact of
geometric uncertainties. After correlating SF
2
of the HCC
tumor cell with different cell types and HCC stage, the
biological impact of the geometric uncertainty was taken
into account to guide the clinical decision of creating
margins for different stages of intra-hepatic tumors.
Methods
Data acquisition
Eight patients with unresectable tumors within the liver
were planned with non-gated and gated techniques (Var-
ian RPM system). The details of the RPM system have
been described in detail previously [25]. Briefly, a small
plastic box with infra-red (IR) reflective markers is placed
on the patient. An array of IR LEDs illuminates the box
while a camera monitors the displacement of the box due
to patient breathing. The respiratory motion for each
patient was recorded through the observation of the dia-
phragm movement under the fluoroscopy with the RPM
system installed on a Ximatron simulator (Varian Medi-
cal Systems, Palo Alto, USA). The diaphragm's move-
ments during a 100% amplitude window (peak to trough)
and another 50% amplitude window (mid-peak to trough)
were measured in order to expand the CTV and generate
a PTV (planning target volume). The maximum motion
extent measurements with the 50% amplitude window
were made in order to increase the number of analyzed
plans in this study consisting of smaller extents of
motion. The trajectories of the movements were also
plotted as a motion distribution of f
p
(r) where r is the dis-
placement of the diaphragm relative to the end exhalation
Kuo et al. Radiation Oncology 2010, 5:48
/>Page 3 of 12
position p. A total of 11 CTVs from eight patients (three
of the patients have two lesions) were contoured from CT
in this study. Each patient was planned using both the full
and half amplitudes of motion such that sixteen plans
were generated in total.
The study with motion from fluoroscopy assumed that
the liver was dragged by the diaphragm along the cranial-
caudal direction without any changes in size and shape.
CT images with 5 mm thickness used for treatment plan-
ning were acquired at end exhalation. Calculations were
performed at a 2.5 mm grid size. The objectives of the
planning were to minimize the mean dose to the normal
tissue with at least 95% of the PTV covered with 50 Gy.
In contrast to the motion study without considering the
deformation, a single patient was planned with 4DCT
images for comparison. The 4DCT image set was
acquired using a GE (General Electric Medical system,
Buckinghamshire, UK) Lightspeed 16-slice CT scanner
with Varian's RPM system. Images were scanned at 0.5
seconds per revolution and a 4DCT protocol developed
by Rietzel et al [26] was followed. The reconstructed CT
images had a voxel size of 2.5 mm in the superior-inferior
(SI) direction, and 1 mm in the anterior-posterior (AP)
and right-left (RL) directions. After the 10 phase CT
images were sorted and organ motion was studied in the
GE Advantage4D workstation, the 10 phase CT images
were exported to Varian Eclipse (version 8.6) worksta-
tion. A 4D planning scheme was performed which incor-
porated the patient's motion model in 3D
Margin design
The planning target volume (PTV) was generated accord-
ing to recommendations of ICRU Report 62 with internal
margins (IM) and setup margins (SM). The CTV to PTV
expansion was calculated by the root of the sum of
squares of IM and SM. Brock et al [27] have investigated
intra-hepatic lesions including an isotropic 5 mm expan-
sion for setup error, an inferior margin for the patient-
specific range of the diaphragm movement due to breath-
ing, and an addition 3 mm superior expansion for repro-
ducibility of the exhale state [28]. Based upon the margin
design in Brock's definition of PTV, we compared the
effect of geometric uncertainty with different margin rec-
ipes. Conventionally, we would select a PTV margin
around a CTV. The aim of this study was to obtain infor-
mation on the discrepancy between the static and motion
blurred IMRT dose distribution resulting from geometri-
cal error. To reduce the number of plan calculations, we
considered the reverse approach, which is to keep the
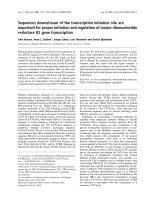
PTV constant, but change the size of the CTV (figure 1).
Hence, we introduce the CTV, CTV
a
and CTV
b
described
as follows.
1) The lesion on CT images enhanced with contrast
was defined as the CTV. The full diaphragmatic
motion (the amplitude of respiration) and the PTV
expansion method described above were applied for
the CTV margin.
2) To comply with Van Herk's 70% motion margin
recipe, the original CTVs were expanded 0.3 A cau-
dally as CTV
a
such that CTV
a
could construct the
same PTV from an expansion of Van Herk's margin.
3) We approximate elimination of the motion margin
by creating CTV
b
with the addition of another 0.5 cm
margin to CTV
a
(i.e. one CT slice, due to CT thick-
ness, the exact number of full motion elimination was
Table 1: Summary of motion margin recipes and the study designs.
Author Recipe Biological model Purpose
Haken et al. 1997 0A NTCP (Lyman model)
TD
50
= 45 Gy, m = 0.15, m = 0.69;
TCP (Simple logistic function)
D
50
= 60 Gy, k = 4;
To investigate potential benefits of
eliminating motion margin through liver
tumor treated with conformal therapy
McKenzie et al. 2000 A No How should motion margin be
combined with other margins around CTV
Van Herk et al. 2003 0.7A
α/β = 1~10
To investigate biologic and physical
fractionation effects of random
geometric errors and respiration motion
with Gaussian blurring of the plan dose
Molinelli et al. 2008 0
5 mm
10 mm
EUD(SF
2
= 0.5)
gEUD(a = -20)
To quantify the potential benefits of
CTV-to-PTV margin reduction for SBRT of
liver tumor
This study 1A
0.7A
0A
D
ref
= 2 Gy; SF
2
= 0.3, 0.5,0.7
To investigate adequate margin for
different clinical stage of liver tumor
treated with fractionation IMRT
BED D
D
=++()1
a
b
EUD D SF SF
ref
i
N
DD
N
iref
=∗
⎡
⎣
⎢
⎢
⎤
⎦
⎥
⎥
∑
ln ( ) / ln( )
/
1
22
Kuo et al. Radiation Oncology 2010, 5:48
/>Page 4 of 12
difficult to reached) in both cranial and caudal direc-
tions. This expansion simulates a further margin
reduction in the cranial-caudal direction from the
PTV.
With the above approximations, all three CTVs are
expanded to the same PTV. CTV is the original clinical
target volume, CTV
a
is close to a clinical target volume
with a reduced margin of 0.7A, and CTV
b
is close to a
clinical target volume excluding a motion margin but
including a setup margin.
Incorporation of geometric errors: Two step convolution
Convolution is a mathematical model for combining two
functions into a third function. It is an established proce-
dure for converting an input object (function 1, either an
image, fluence, or dose distribution) in motion (function
2, either a filter, motion distribution, or probability distri-
bution) into an output object (function 3, same attribute
as function 1) with the motion smearing effect. When the
input object is an image, motion will blur the image in the
same way that a moving object is blurred in photography.
When the input object is a fluence or dose distribution,
motion will blur the fluence or dose. Convolution incor-
porates the motion function to output an object which
simulates the blurred image, fluence, or dose distribution.
Motion smearing of the fluence or dose distribution
causes the broadening of the penumbra and the degrada-
tion of the target coverage. This study applied a two-step
convolution to simulate the dose received by the patient.
The first step convolved the fluence created by the MLC
with the patient's moving diaphragm distribution to gen-
erate an effective fluence. The second step convolved the
dose matrix calculated from the effective fluence with a
Gaussian distribution representing the setup error. The
first step considered the inhomogeneity of the body. The
second step assumed that the body is homogeneous. The
effective fluence method for the dose distortion by
patient motion has been validated in our previous study
[15].
Sixteen IMRT plans were created for PTV and PTVg
(maximum motion extent taken from the 50% motion
window) of eight liver patients for a total of 24 CTVs. The
dose prescription was 50 Gy to the PTV with 2 Gy per
fraction (25 fractions) for each plan. The dynamic MLC
motion files from the planning system (Varian, Cadplan,
Varian Medical Systems, Palo Alto, USA) were then con-
volved with the motion function [11] to obtain the effec-
tive fluence
where x
k
r
(t) and x
k
l
(t) denote the positions of the right
and left leaves (relative to the iso-center), respectively, of
the kth leaf pair. I is the intensity distribution generated
from the leaf motion (which is in perpendicular direction
to the diaphragm movement in this study). For an arbi-
trary point in the organ, p, if the fluence has no distortion
due to the motion of an organ, χ is constant. In the calcu-
lation of the fluence following distortion due to organ
motion, χ is substituted for the pre-known motion func-
tion,
Where f
p
() is the motion function for point p; ζ is the
period; A is the motion amplitude; t is the beam-on-time,
and t
o
is the initial phase. In the calculation of the convo-
lution, the specific patient motion trajectory distribution
f
p
() acquired in previous section was incorporated into
equation (1). During the convolution process, the initial
phase was randomly sampled 25 times to simulate 25 dif-
ferent treatments. The static fluences and the effective
fluences were incorporated back to the planning system
for forward dose calculation [29]. The dose distributions
of static fluences were considered as static plans without
motion and the dose distributions of effective fluences
were considered as plans incorporating motion.
After the dose distribution was obtained from the effec-
tive fluence, a second convolution was performed by con-
volving the dose matrix with a three dimensional
Gaussian probability distribution function [30,31],
ΦpIxt Ixtdt
r
k
l
k
=−−
∫
(() )( ())
cc
(1)
cz
=+ft t A
p
(;,)
0
(2)
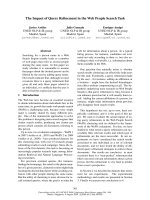
Figure 1 An illustration of the three margins designed in this
study. 1) CTV applied a full respiratory motion margin in the caudal di-
rection; 2) CTV
a
added a 0.3 A expansion on CTV in the caudal direction
to simulate a 0.7 A margin recipe; 3) CTV
b
expanded CTV
a
by 0.5 cm in
both cranial-caudal directions to simulate no motion margin recipe.
Kuo et al. Radiation Oncology 2010, 5:48
/>Page 5 of 12
where D
m
is the dose matrix incorporating with motion
effect, D
mr
(R) is the expected dose distribution (at
R(x,y,z)) blurred by the random setup uncertainty. The
random setup uncertainty is described by an isotropic 3-
D Gaussian distribution (PDF
G
) with a standard deviation
of 0.5 cm in the anterior-posterior (AP), lateral (LAT),
and caudal-cranial (CC) directions [31].
Systematic Error
Systematic error might occur during the image acquisi-
tion or treatment execution. To compare the effects of
random and systematic errors, an arbitrary offset of 0.5
cm (in contrast to random error and the criteria of an
acceptable tolerance in practice) was applied at isocenter
for the effective fluence before the final dose calculations
were done at 1) caudal (-z) direction; 2) cranial (+z) direc-
tion; 3) 0.35 cm at both of the right lateral (x) and anterior
(y) direction. The latter represents the expansion in both
x and y directions such that (x
2
+y
2
)
1/2
= 0.5.
Plan Evaluation
EUD as defined by Niemierko [32] is given by,.
Equation 4 was used to compare the effect of geometric
uncertainties on EUD by varying the parameter SF
2
over a
range of values (0.3, 0.5, and 0.7) to represent very radio-
sensitive, medium radiosensitive, and radioresistant
tumor cell types, respectively. D
ref
, the reference fraction
dose, was 2 Gy in this study in conjunction with SF
2
.
The static plans were compared with plans incorporat-
ing geometric uncertainties for CTV, CTV
a
, CTV
b
and
PTV in terms of cold spots, as defined by: 1) the dose
encompassing 99% of the volume (D
99%V
), 2) the fraction
of the target volume with dose 10% (V
90%D
), and 5% lower
(V
95%D
) than the prescription dose. To compare the bio-
logical effects, DVHs were converted to equivalent uni-
form dose (EUD), using equation (4), then the impact of
geometric uncertainty was calculated as the percentage of
dose error:
where EUD
GU
, and EUD
plan
are the EUD with and with-
out geometric uncertainty, respectively.
Statistical Analysis
The plan evaluation results at the above end points
(D
99%V,
V
90%D
, V
95%D
, %(ΔEUD) at SF
2
= 0.3, 0.5, and 0.7)
for different margins (different CTVs) were analyzed
using SAS software (SAS institute inc., release 8.1). The
statistical significance of the difference between these
end points was determined using a two sided paired sam-
ple t test, where the end points of the CTVs are paired by
patient. Differences of the results were reported to be sig-
nificant at p < 0.05.
Comparison with 4D study
A study incorporated 4D CT data which accounted for
the organ deformation during respiration was compared
with the study above. The details of the 4D method were
mentioned in a separate report [33]. In brief, a 4D plan
was done by warping the static dose distribution of differ-
ent phases of CT images with a 3D deformation map such
that the overall dose at each tissue voxel was accumulated
at the reference CT image. The 3D deformation map was
generated after deformable registration registered 4D CT
images into the reference CT image. A diffeormorphic
registration algorithm was built upon ITK's (Insight Seg-
mentation and Registration Toolkit) environment to per-
form the deformable registration. Another in-house
program was developed to synchronize dynamic MLC
segments with respiration phases such that static dose
distribution of different phases can be obtained from the
sorted synchronized DMLC segments. To account for the
random set up uncertainty, a convolution similar to equa-
tion (3) was applied at the static dose distribution of each
respiration phase before the dose distribution was
warped with the deformation map. After the dose warp-
ing, the deformed dose distributions from each respira-
tory phase were summed together as the simulated 4D
dose distribution.
Results
The CTV volumes ranged between 7 and 206 cc (mean 88
cc) and the motion amplitudes ranged from 0.9 to 1.9 cm
(mean 1.33 cm). The three different CTVs (CTV, CTV
a
and CTV
b
) and their volumes with PTV margins are
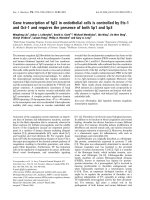
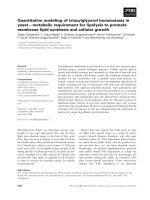
listed in table 2. Figure 2 shows dose volume histograms
(DVH) averaged over the patient population. The solid
lines refer to the original plan and the dashed lines refer
to the plan with the effects of geometric uncertainties due
to organ motion and random setup error. Also shown are
the different data points of intrest (D
99%V,
V
90%D
, and
V
95%D
). The error bars on these points indicate the range
over the patient population. Since the margin for the
CTV and CTV
a
are sufficient to overcome the effect of
geometric errors, their DVHs with and without motion
are effectively identical. The mean ±1SD of the D
99%V,
DR DR PDFRRdR
mr m G
Rxyz
() ( ’) ( ’) ’
’( , , )
=•−
∫∫∫
(3)
EUD Gy D
N
SF SF
ref
i
N
DD
iref
() ln ( ) /ln( )
/
=∗
⎡
⎣
⎢
⎢
⎢
⎤
⎦
⎥
⎥
⎥
∑
1
22
(4)
%()%*
()
ΔEUD
EUD
GU
EUD
plan
EUD
plan
=
−
100
(5)
Kuo et al. Radiation Oncology 2010, 5:48
/>Page 6 of 12
V
90%D
, and V
95%D
for CTV after the geometric uncertain-
ties were 5.2 ± 3.9 (Gy), 1.3 ± 3.7 (%), and 7.7 ± 13.6 (%),
respectively. Despite a slightly smaller margin than CTV
a
,
similar results hold for CTV
b
, although the coverage for
the chosen end points, on average, is lower. Specifically,
the mean ±1SD of the D
99%V,
V
90%D
, and V
95%D
after the
geometric uncertainties were 12.3 ± 6 (Gy), 3.2 ± 4.6 (%),
and 8.6 ± 8.6 (%), respectively. Finally, in Figure 2(d), the
PTV can be considered as a target without any margin for
geometric uncertainties. Here, the effect of motion is dra-
matic and a large portion of the target volume will receive
an unacceptably low dose.
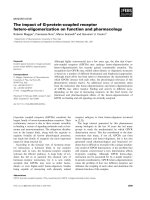
Figure 3 shows a box plot of the variation of the biolog-
ical response %(ΔEUD) to the presence of geometric
uncertainties for different targets and different survival
rates. Both the value and standard deviation of %(ΔEUD)
increase as the margin decreases. The box plot also shows
how %(ΔEUD) changes as survival rates (SF2) change.
There is no significant change as SF2 increases for both of
CTV and CTVa. The geometric uncertainties induced
biological effects quantified as %(ΔEUD) error, were 1.4 ±
1.9%, 1.4 ± 1.9%, and 1.6 ± 1.9% for SF2 of 0.7, 0.5 and 0.3,
respectively. For CTVa, the values of %(ΔEUD) were 1.6 ±
1.8%, 1.7 ± 2.0%, and 2.1 ± 2.3% for SF2 of 0.7, 0.5 and 0.3,
respectively, which are statistically indistinguishable from
CTV. However, for CTVb and PTV, the mean value and
variation (as measured by range and standard deviation)
both decrease with as SF2 increases. The biological
effects were 2.5 ± 2%.1, 3.4 ± 2.4%, and 5.3 ± 3.5% for SF2
of 0.7, 0.5 and 0.3, respectively, for CTVb. The biological
impact was largest when there were no motion and setup
margins at all (i.e. when CTV = PTV).
To establish if the results from figures 2 &3 are statisti-
cally significant, a paired sample t test was used to com-
pare the difference between CTV and CTV
a
and the
difference between CTV and CTV
b
in terms of D
99%V,
V
90%D
, V
95%D
, %(ΔEUD) at SF
2
= 0.3, 0.5, and 0.7. The
results of this test are listed in Table 3. The geometric
uncertainty has the same effect on physical and biological
DVH for CTV and CTV
a
. However, the difference in
Table 2: Patient data with amplitudes, targets and the margins in this study (P3, P5, and P6 have two lesions).
patient Amplitude Volume (cc)
cm* CTV CTV
a
CTV
b
PTV
P1 1.4 89 121 161 213
0.7 175
P2 1.7 206 266 344 439
0.9 352
P3 1.8 89;23 148;44 222;70 291;103
1 220;86
P4 1.9 90 126 191 367
1 314
P5 1.2 77;7 107;17 149;31 183;43
0.6 152;40
P6 0.9 111;42 139;57 184;77 250;117
0.5 214;111
P7 1.1 163 215 287 325
1.115284561
P8 1.6 141 200 284 791
0.8 645
* Each patient was planned with the full and half amplitudes of motion such that sixteen plans were generated in total.
Kuo et al. Radiation Oncology 2010, 5:48
/>Page 7 of 12
dosimetric impact between CTV and CTV
b
is significant
using most endpoints. We calculated the correlation
between the %(ΔEUD
0.5
) on CTV
b
, motion amplitude, the
amount of margin on CTV
b
, and the %(ΔEUD
0.5
) on CTV.
The correlation coefficients between CTV
b
and the rest
of the parameters (amplitude, margin, and %(ΔEUD
0.5
) on
CTV
b
were 0.14, 0.58 and 0.32, respectively. The stron-
gest correlation between the %(ΔEUD
0.5
) on CTV
b
is with
the margin size (or more specifically, the lack thereof).
Figure 4 displays the dosimetric error (equation 5) com-
parisons for both the motion plus random and motion
plus systematic errors. We grouped the data into subsets,
one for amplitude > 1 cm and the other < 1 cm. The data
are shown for different CTVs resulting from the different
margin recipes over a range of tumor cell types. The sys-
tematic errors (combined with motion error) displayed in
the figure were the worst case of the three simulated cen-
ter offsets (as systematic errors) in the caudal-cranial and
the transverse directions. The results showed that as we
combined motion and random error, CTV
b
had a mean
%(ΔEUD) reduction of 3%~6%, which made no signifi-
cant difference between the two groups. On the contrary,
combined motion with systematic error, for the group of
motion amplitude > 1 cm, the CTV
a
had a mean
%(ΔEUD) reduction of 2%~5%, CTV
b
had a mean
Figure 2 The effects of geometric uncertainty on the DVH of different targets. The DVH curves are the mean curves from different patients in
this study. (a), (b), (c) & (d) correspond to CTV, CTV
a
, CTV
b
, and PTV, respectively. The ο, ᮀ, Δ symbols show the mean reduction of the D
99%V
, V
90%D
, and
V
95%D
from the original DVH curves. The bar across the symbols are the range of the data set.
Kuo et al. Radiation Oncology 2010, 5:48
/>Page 8 of 12
%(ΔEUD) reduction of 3%~11%. These mean %(ΔEUD)
errors were twice as high for the group of motion ampli-
tude < 1 cm.
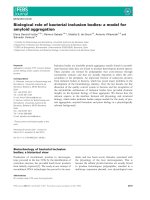
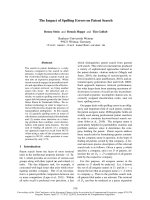
For the case with 4D data, figure 5a and 5b display the
dose profiles without geometry effects ("P"), with set up
error ("SM"), with motion error ("IM"), and with geome-
try impact ("G", combines "SM" & "IM") in AP ("Y"), and
Sup/Inf ("Z") directions, respectively. The motion in the
RT/LT direction is not shown since the effect is smaller
than the effect in the AP direction. The displacements of
the 95% dose position from planning iso-center due to
different geometry uncertainty are summarized in table
4. The degradations (negative value) of the 95% dose posi-
tion were 3 mm, 2.4 mm, and 12.9 mm in RT/LT, AP, and
Sup/Inf directions, respectively. Set up uncertainty has
effect relatively isotropic in all directions. Respiration
Figure 3 Box plot of %(ΔEUD) vs. different CTVs with different radiation sensitivity. The range indicated by the error bars, the 1
st
and median
and the third quartiles, shown as a line, and upper and lower limits of the box, respectively and the average indicated by the points for different mar-
gins as indicated by CTV, CTV
a
and CTV
b
.for a) SF
2
= 0.3, b) SF
2
= 0.5, and c) SF
2
= 0.7 on the x-axis.
Table 3: The p-values of the paired sample t test for CTV with CTV
a
, and CTV with CTV
b
.
CTV
a
CTV
b
D
99%V
0.049 <0.0001
V
90%D
0.1231 0.0066
V
95%D
0.7049 0.6471
%(ΔEUD
0.7
)0.4017 0.0002
%(ΔEUD
0.5
) 0.2526 <0.0001
%(ΔEUD
0.3
) 0.088 <0.0001
Two data sets are the statistically the same if the p-value is larger than 0.05.
Kuo et al. Radiation Oncology 2010, 5:48
/>Page 9 of 12
motion dominates the geometry impact in the inferior
direction only. Figure 5c and 5d show the DVH of the
plans with and without different geometry uncertainties
for targets with sufficient margins (CTV & CTV
a
) and
without sufficient margins (CTV
b
& PTV). The EUD
errors from the geometry errors are summarized in table
3 for SF
2
of 0.3, 0.5 and 0.7, respectively. The geometric
error impact is insignificant for CTV and CTV
a
. It has a
small impact for CTV
b
of sensitive cell type (SF
2
equal to
0.3).
Discussion
Margin design is critical for the dose received by the
tumor. An optimum margin is the aperture that ensures
the dose received by target with the least possible amount
of irradiation of normal tissue. In this study, three differ-
ent margin recipes were tested. Both CTV to PTV and
CTV
a
to PTV are sufficient to accommodate respiration
and setup error. Our T-test results at different end points
all indicated that the margin recipe of CTV can be
replaced by margin recipe of CTV
a
; however, the margin
recipe of CTV
b
cannot replace the margin recipe of CTV
without any compensation.
The CTV
b
has insufficient margin by 0.5 cm to 1 cm.
For the cases of motion amplitude larger than 1 cm (table
2), the margin from CTV
b
to PTV is close to the margin
with random setup error only. This approximates the case
in Ten Haken's study [23] where the motion margin was
eliminated. In their study, elimination of motion facili-
tates dose escalation of about 11% for the same normal
tissue complication probability. However, due to the dose
smearing effect, the geometric uncertainty results in an
actual escalated BED by approximately 5~8%, depending
upon the radiation sensitivity of the tumor cell. This
ignores systematic errors. If systematic errors exist dur-
ing the treatment, the potential dose escalation would be
negated by the geometric delivery inaccuracy. In the
group of amplitudes greater than 1 cm in Figure 4 with
combined motion and systematic errors, CTV
b
had a
mean %(ΔEUD) reduction ranging from 3% to11% and a
maximum reduction ranging from 6% to 20%. These also
reflect the fact that systematic error has a serious impact
Figure 4 The effects of motion plus random error and motion
plus systematic error. The percentage dose errors are shown for pa-
tients with motion amplitudes greater than 1 cm and less than 1 cm.
Data are shown for different margin recipes resulting in different CTVs
(CTV, CTV
a
, and CTV
b
) and over a variety of different radiosensitivities
(SF
2
= 0.7, 0.5 and 0.3). The effects of motion plus random error and mo-
tion plus systemic error are separated in the two graphs. The error bars
indicate 1 standard deviation.
Table 4: The motion characteristics of the case plan with 4D scheme.
Lt/Rt AP Sup/Inf
Max. displacement 1.6 mm 5.0 mm 13.0 mm
95%_SM -2.5/-3.3 -1.8/-1.6 -4.0/-5.0
95%_IM +1.0/-0.4 -2.4/+3.0 +1.4/-8.8
95%_G -1.3/-3.2 -2.4/+2.6 -1.9/-12.6
EUD
SF0.3
EUD
SF0.5
EUD
SF0.7
CTV_G 1.010 1.010 1.009
CTV
a
_G 1.006 1.006 1.006
CTV
b
_G 0.976 0.986 0.990
PTV_G 0.788 0.854 0.909
The change of the 95% dose position of the dose profiles due to different geometry uncertainties and biological impact (EUD) for different
margins are summarized.
Kuo et al. Radiation Oncology 2010, 5:48
/>Page 10 of 12
on the equivalent dose received by the target compared to
random error. The smaller margin the target has (as in
the group of amplitude less than one cm), the larger the
dosimetric error caused by the 0.5 cm systematic offset.
In practice, elimination of the motion margin should be
performed with reliable image guidance techniques
(IGRT), and a dose escalation scheme should be consid-
ered to compensate for the biologic dose reduction due to
the geometric misses during treatment.
We caution that our approach is not universally appli-
cable. Here, we reduced the size of the CTV without
altering the size of the PTV. In reality, it is the PTV vol-
ume that changes. If applied with constant CTV, PTV
with bigger margin would have a larger volume. This will
lead to different dose uniformity within the PTV and
more dose to normal tissue after the inverse planning of
IMRT. The dose gradient between the borders of the PTV
will be different, too. Since this study compared the cov-
erage of CTV with and without motion impact after large
(25) fractionation IMRT delivery, slight dose non-unifor-
mity (after inverse planning) within the PTV should not
affect the results of the CTV coverage in this study. Slight
different dose gradient will affect more at PTV and less at
CTVs after the dose smeared by motion. The irradiation
to normal tissue after motion impact is outside the scope
of this study, too. These are issues warrant further study.
The radiation sensitivity of the cell type has a strong
influence on the sensitivity of the target to margin reduc-
tion. This conclusion can be drawn from the results
shown in figures 3 and 4. Overall, since the dosimetric
effect resulting from geometric uncertainties is larger at
the target border, where the dose gradient is greater, the
radiosensitive tumor cells suffer more from the geometric
uncertainties when the margins were insufficient (e.g.,
CTV
b
in this study). The low dose volume generated by
geometric uncertainties has a larger biological impact on
more radiation sensitive tumor types. Low dose volumes
may be generated during the optimization process.
Although the cold spots were outside the CTV, the bio-
logical impact could be magnified after the dose blurring
by geometrical uncertainties.
Since the impact of the geometric uncertainties is
dependent on the tumor cell type, margin reduction
should also consider the clinical stage of the tumor and
Figure 5 Effects of geometrical uncertainty on the patient with 4D planning. (a) & (b) display dose profiles (OAX is the off axis distance) of the
static plan ("P") and with different geometric impact s("SM", "IM" &"G") in "Y" and "Z" directions, respectively. (c) & (d) display the DVH of the plans with
and without different geometric uncertainties for targets with sufficient margins (CTV & CTV
a
) and without sufficient margins (CTV
b
& PTV).
Kuo et al. Radiation Oncology 2010, 5:48
/>Page 11 of 12
the corresponding radiation sensitivity. An example of
the implementation is shown in figure 6, which is based
on the tumor and tumor cell response to radiation at dif-
ferent clinical stages listed at table 5. The survival frac-
tions of stage IIb and IIIb HCC are lower than 0.5, which
indicate radiation sensitive cell types, so the planning tar-
get should use generous margins (eg. 1
st
and 2
nd
margin
recipe in this study) to avoid the cold spots from geomet-
ric misses. For stage IV HCC or HCC with PVT, the radi-
ation response is poorer and the whole CTV is usually
too big to spare the normal liver, so a smaller margin (2
nd
and 3
rd
margin recipe in this study) can be considered. If
the motion margin is eliminated, 5% dose escalation is
suggested to compensate for tumor dose loss from geo-
metric uncertainties as shown in figure 4 where the mean
%(ΔEUD) reduction were between 2%~6% for CTV
b
.
This study considers the diaphragm as a surrogate for
liver motion and assumed that the liver has rigid motion
in Sup/Inf direction only. A case applied 4D planning
scheme with 3D deformable organ motion was studied
for comparison and is summarized in table 4. In this case,
the maximum displacement at RT/LT, AP, and Sup/Inf
are 1.6 mm, 5 mm and 13 mm, respectively. The results
show that the CTV with sufficient margins (CTV and
CTVa) have no dosimetric or biological impact from the
geometry uncertainty. When there is insufficient margin
(6 mm in this case), the EUD errors were 2.4%, 1.6% and
1% for SF2 of 0.3, 0.5, and 0.7, respectively. When no mar-
gin was applied (PTV), the EUD errors were 21.2%, 15.6%
and 9.1%, for SF2 of 0.3, 0.5, and 0.7, respectively. Com-
pared with the results of the rigid body assumption in fig-
ures 3 & 4, where CTV & CTVa have insignificant
dosimetric impacts, CTVb has mean EUD errors typi-
cally between 2~5% (with maximum of 8%), and PTV has
mean EUD errors typically between 6~12% ( with maxi-
mum 20%). This result demonstrates a similar conclusion
by Brock that deformation is insignificant in affecting the
dosimetric coverage of the target and the dose received
by normal liver [27]. In other words, this comparison val-
idates the expansion of motion margin design (figure 6) in
3D.
This study only considered SF
2
in the implementation
of EUD; in addition, the literature regarding the relation-
ship of the SF
2
with the cell type of intra-hepatic tumor is
very limited. Our method could over simplify the clinical
situation. However, the dose dependency of tumor
response of different intra-hepatic lesions among differ-
ent stages of HCC, metastasis lesions, and tumor with or
without PVT is very significant. Applying different mar-
gin design in clinical practice for a specific patient is not
uncommon due to patient's motion amplitude and plan-
ning goal of avoiding the RILD of the normal liver. Based
on these clinical experiences, this study proposes to com-
bine the laboratory findings, clinical results (compiled as
table 5) and the dosimetric effects of geometry uncer-
tainty (summarized as figure 4) in order to design a rea-
sonable and an achievable margin. Of course, further
study of the SF
2
, cell type and the dose response of the
intra-hepatic tumor are warranted.
Conclusions
The biological effects of the geometric uncertainties for
intrahepatic lesions depend on margin design and intrin-
sic radiation sensitivity of the tissue. More radiosensitive
tumor cells are more sensitive to the margin size. In the
simulation of this study, van Herk's 0.7 A margin is feasi-
ble if the inter- and intra- reproducibility of the respira-
tory motion is also considered. Elimination of the motion
Table 5: Response dose and survival fraction (SF
2
) for
different clinical stage of intra-hepatic tumor.
SF
2
for different clinical stage and pathology cell type (Liu, 2005)
Clinical stage
IIb IIIb IV
Pathology typing
Hepatocellular carcinoma 0.28 0.47 0.61
Bile duct epithelial carcinoma 0.41 0.57 0.78
Radiation dose needed for tumor response
response non response
HCC without PVT (Park, 2002) 50.1 Gy 44.3 Gy
HCC with PVT (Kim, 2005) BED 59.9 Gy BED 55.2 Gy
Figure 6 Clinical implementation of motion margin for intra-he-
patic tumor. PVT is portal vein thrombosis, A is the motion amplitude.
Kuo et al. Radiation Oncology 2010, 5:48
/>Page 12 of 12
margin could be beneficial to normal liver sparing with
dose escalation, however, the potential dose reduction
due to motion blurring on the dose distribution should
also be taken into account. The clinical implementation
of margin reduction should consider radiosensitivity of
the tumor.
Competing interests
The authors declare that they have no competing interests.
Authors' contributions
HK designed analyzed and interpreted data. KC participated software program-
ming. WL, CG and SK participated in contouring and helped revise the draft
manuscript.
AW, DM, LH and RY participated in study design, data analysis and helped
revise the draft manuscript. All authors read and approved the final manu-
script.
Author Details
1
Department of Radiation Oncology, Montefiore Medical Center, USA,
2
Department Biomedical Engineering and Environmental Sciences, National
Tsing Hua University, Taiwan,
3
Department of Radiation Oncology, University
Hospital of Chung-Shan Medical University, Taiwan and
4
Department of
Radiologic Sciences, Thomas Jefferson University, USA
References
1. El-Serag HB, Mason AC: Rising incidence of hepatocellular carcinoma in
the United States. N Engl J Med 1999, 340:745-750.
2. Robertson JM, Lawrence TS, Andrews JC, et al.: Long-term results of
hepatic artery fluorodeoxyuridine and conformal radiation therapy for
primary hepatobiliary cancers. Int J Radiat Oncol Biol Phys 1997,
37:325-330.
3. Dawson LA: Escalated focal liver radiation and concurrent hepatic
artery fluorodeoxyuridine for unresectable intrahepatic malignancies.
J Clin Oncol 2000, 18(11):2210-8.
4. Park HC, Seong J, Han KH, et al.: Dose-response relationship in local
radiotherapy for hepatocellular carcinoma. Int J Radiat Oncol Biol Phys
2002, 54:150-155.
5. Park W, Lim DH, Paik SW, et al.: Local radiotherapy for patients with
unresectable hepatocellular carcinoma. Int J Radiat Oncol Biol Phys 2005,
61:1143-50.
6. Kim DY, Park W, Lim DH, et al.: Three-dimensional conformal
radiotherapy for portal vein thrombosis of hepatocellular carcinoma.
Cancer 2005, 103:2419-26.
7. Ryo T, Ryuji M, Yuji B, et al.: Conformal radiation therapy for portal vein
tumor thrombosis of hepatocellular carcinoma. Radiother Oncol 2007,
84:266-271.
8. West CML, Davison SE, Burt PA, et al.: The intrinsic radiosesitivity of
cervical carcinoma: correlations with clinical data. Int J Radiat Oncol Biol
Phys 1995, 31:841-846.
9. Stausbol-Gron B, Overgaard J: Relationship between tumor cell in vitro
radiosensitivity and clinical outcome after curative radiotherapy for
squamous cell carcinoma of the head and neck. Radiother Oncol 1999,
50:47-55.
10. Burnet NG, Jena R, Jefferies SJ, et al.: Mathematical modeling of survival
of glioblastoma patients suggests a role for radiotherapy dose
escalation and predicts poorer outcome after delay to start treatment.
Clinical Oncol 2006, 18:93-103.
11. Liu ZZ, Huang WY, Lin JS, et al.: Cell survival curve for primary hepatic
carcinoma cells and relationship between SF2 of hepatic carcinoma
cells and radiosensitivity. World J Gastroenterol 2005, 11(44):7040-7043.
12. Langen KM, Jones DTL: Organ motion and its management. Int J Radiat
Oncol Biol Phys 2001, 50:265-278.
13. Bortfeld T, Jokivarsi K, Goitein M, et al.: Effects of intra-fraction motion on
IMRT dose delivery: statistical analysis and simulation. Phys Med Biol
2002, 47:2203-20.
14. Chui CS, Yorke E, Hong L: The effects of intra-fraction organ motion on
the delivery of intensity-modulated field with a multileaf collimator.
Med Phys 2003, 30:1736-46.
15. Kuo HC, Chuang KS, Liu WS, Wu A, Lalonde R: Analysis of the organ
motion effects on the effective influences for liver IMRT. Phys Med Biol
2007, 52:4227-44.
16. Goitein M: Organ and tumor motion. Seminars in Radiation Oncology
2004, 14:2-9.
17. Van Herk M: Error and Margins in Radiotherapy. Seminars in Radiation
Oncology 2004, 14:52-64.
18. Balter J, Brock K, Lam K, Tatro D, Dawson L, McShan D, Ten Haken R:
Evaluating the influence of setup uncertainties on treatment planning
for focal liver tumors. Int J Radiat Oncol Biol Phys 2005, 63:610-614.
19. ICRU Report 62: Prescribing, recording, and reporting photon beam
therapy (supplement to ICRU Report 50). International Commission on
Radiation Units and Measurement, Bethesda, MD; 1999.
20. Sdtroom JC, Heijmen BJ: Geometrical uncertainties radiotherapy
planning margins and the ICRU-62 report. Radiother Oncol 2002,
64:75-83.
21. Van Herk M, Witte M, Geer JVD, et al.: Biologic and Physical fractionation
effects of random geometric errors. Int J Radiat Oncol Biol Phys 2003,
57:1460-1471.
22. Mckenzie AL: How should breathing motion be combined with other
errors when drawing margins around clinical target volumes? British J
Radiology 2000, 73:973-977.
23. Ten Haken RK, Balter JM, Marsh LH, et al.: Potential benefits of eliminating
planning target volume expansions for patient breathing in the
treatment of liver tumors. Int J Radiat Oncol Biol Phys 1997, 38:613-617.
24. Molinelli S, Pooter J, Romero AM, et al.: Simultaneous tumor dose
escalation and liver sparing in stereotactic body radiation therapy
(SBRT) for liver tumours due to CTV to PTV margin reduction. Radiother
Oncol 2008, 87:432-438.
25. Wagman R, Yorke E, Ford E, et al.: Respiratory gating for liver tumors: use
in dose escalation. Int J Radiat Oncol Biol Phys 2003, 55:659-668.
26. Rietzel E, Liu AK, Doppke KP, Wolfgang JA, Chen AB, Chen GTY, Choi NC:
Design of 4D treatment planning target volumes. Int J Radiat Oncol Biol
Phys 2006, 66:287-295.
27. Brock KK, McShan DL, Ten Haken RK, Hollister SJ, Dawson LA, Balter JM:
Inclusion of organ deformation in dose calculation. Med Phys 2003,
30:290-295.
28. Balter JM, Lam KL, McGinn CJ, Lawrence TS, Ten Haken RK: Improvement
of CT-based treatment-planning models of abdominal targets using
static exhale imaging. Int J Radiat Oncol Biol Phys 1998, 41:939-943.
29. Kung JH, Zygmanski P, Choi N, et al.: A method of calculating a lung
clinical target volume DVH for IMRT with intrafractional motion. Med
Phys 2003, 30:1103-9.
30. McCarter SD, Beckham WA: Evaluation of the validity of a convolution
method for incorporating tumor movement and set-up variations into
the radiotherapy treatment planning system. Phys Med Biol 2000,
45:923-931.
31. Song W, Battista J, Dyk JV: Limitations of a convolution method for
modeling geometric uncertainties in radiation therapy: the
radiobiological dose-per-fraction effect. Med Phys 2004, 31:3034-3045.
32. Niemierko A: Reporting and analyzing dose distributions: A concept of
equivalent uniform dose. Med Phys 1997, 24:103-109.
33. Kuo HC, Mah D, Chuang KS, Wu A, Hong L, Yaparpalvi R, Spierer M, Kalnicki
S: A method incorporating 4D data for evaluating the dosimetric
effects of respiratory motion in single arc IMAT. Phys Med Biol 2010,
55:3479-3497.
doi: 10.1186/1748-717X-5-48
Cite this article as: Kuo et al., Biological impact of geometric uncertainties:
what margin is needed for intra-hepatic tumors? Radiation Oncology 2010,
5:48
Received: 2 February 2010 Accepted: 3 June 2010
Published: 3 June 2010
This article is available from: 2010 Kuo et al; licensee BioMed Central Ltd. This is an Open Access article distributed under the terms of the Creative Commons Attribution License ( ), which permits unrestricted use, distribution, and reproduction in any medium, provided the original work is properly cited.Radiation O ncology 2010, 5:48