Báo cáo khoa học: "The value of metabolic imaging to predict tumour response after chemoradiation in locally advanced rectal cancer" doc
Bạn đang xem bản rút gọn của tài liệu. Xem và tải ngay bản đầy đủ của tài liệu tại đây (473.98 KB, 8 trang )
RESEARC H Open Access
The value of metabolic imaging to predict
tumour response after chemoradiation in locally
advanced rectal cancer
Pablo Palma
1*
, Raquel Conde-Muíño
1
, Antonio Rodríguez-Fernández
2
, Inmaculada Segura-Jiménez
1
,
Rocío Sánchez-Sánchez
2
, Javier Martín-Cano
1
, Manuel Gómez-Río
2
, José A Ferrón
1
, José M Llamas-Elvira
2
Abstract
Background: We aim to investigate the possibility of using 18F-positron emission tomography/computer
tomography (PET-CT) to predict the histopathologic response in locally advanced rectal cancer (LARC) treated with
preoperative chemoradiation (CRT).
Methods: The study included 50 patients with LARC treated with preoperative CRT. All patients were evaluated by
PET-CT before and after CRT, and results were compared to histopathologic response quantified by tumour
regression grade (patients with TRG 1-2 being defined as responders and patients with grade 3-5 as non-
responders). Furthermore, the predictive value of metabolic imaging for pathologic complete response (ypCR) was
investigated.
Results: Responders and non-responders showed statistically significant differences according to Mandard’s criteria
for maximum standardized uptake value (SUV
max
) before and after CRT with a specificity of 76,6% and a positive
predictive value of 66,7%. Furthermore, SUV
max
values after CRT were able to differentiate patients with ypCR with
a sensitivity of 63% and a specificity of 74,4% (positive predictive value 41,2% and negative predictive value 87,9%);
This rather low sensitivity and specificity determined that PET-CT was only able to distinguish 7 cases of ypCR from
a total of 11 patients.
Conclusions: We conclude that 18-F PET-CT performed five to seven weeks after the end of CRT can visualise
functional tumour response in LARC. In contrast, metabolic imaging with 18-F PET-CT is not able to predict
patients with ypCR accurately.
Background
Over the past decade neoadjuvant chemo-radiotherapy
(CRT) has been increasingly employed in the treatment
of locally advanced rectal cancer (LARC). Clinical trials
have shown a reduction in tumour size and stage, as
well as a significant reduced risk of local recurrence.
Tumour responses to CRT, however, vary considerably.
While pathological complete response is noted in up to
30 percent of patients who undergo preoperative CRT
andevidencesuggeststhatcompleteresponseisasso-
ciated with better oncologic outcomes, serious side
effects and even no response - after weeks of treatment
-is observed in the remaining amount of patients [1].
The surgical approach largely depends on a valid
assessment of the preoperative extent of the tumour,
particularly for distally located tumours or those that
have been assessed as being nonresectable during pri-
mary staging. Regarding the further treatment, some
institutions raised the question whether ra dical surgery
should be necessary for patients with clinical complete
response to CRT [2,3]. Therefore, for the clinical prac-
tice, radiological prediction of the histopathological
tumour response is quite attractive because it could
enable response-guided modifications of the treatment
protocol. Clinical assessment after CRT is known to be
quite poor and conventional imaging modalities cannot
* Correspondence:
1
Division of Colon &Rectal Surgery - Department of Surgery, HUVN
Granada - Spain
Full list of author information is available at the end of the article
Palma et al. Radiation Oncology 2010, 5:119
/>© 2010 Palma et al; licensee BioM ed Central Ltd. This is an Open Access article distributed under the terms of the Creative Co mmons
Attribution License (http://cre ativecommons.org/licenses/by/2.0), which permits unrestricted use, distribution, and reproduction in
any medium, provided the original work is properly cited.
distinguish fibrosis or scar from viable tumour cells in
residual masses [4].
As a result, great demands are placed on imaging
modalities t hat provide a combination of metabolic and
morphologic information. Incorporation of 2-deoxy-2-
[18F]fluoro-D-glucose (18-FDG) positro n emission
tomography (PET) scans in the managem ent of patients
with cancer has increased with the introduction of this
modality into clinical practice [5].
After our preliminary experience with this technique
deal ing with staging of colorectal cancer [6], in the cur-
rent prospective study we aim to s pecifically determine
whether PET-CT scans could predict histopathological
response in patients with LARC after treatment with
preoperative CRT.
Methods
Patients characteristics
A cohort of 50 patients diagnosed with nonm etastasized
LARC was included in this study (UICC Stage II and
III). Preoperative TN staging was evaluat ed with mag-
netic resonance scan (MRI) and endorectal ultrasound
(US). All patients received neoadjuvant radiotherapy (28
fractions of 1.8 Gy, 5 fractions/week) with concomitant
chemotherapy (capecitabine, 825 mg/m2, twice daily
alone or in combination with oxaliplatine 50 mg/m2
once weekly), followed by surgery 8 weeks after comple-
tion of CRT. All patients underwent sequential FDG-
PET-CT imaging at two different time points: once
prior to neoadjuvant therapy and once just prior to sur-
gery (Figure 1 and 2).
PET-CT imaging and processing
All PET-CT scans were performed by use of a dedicated
Siemens Biograph 16, (Knoxville, Tennessee) with an axial
field of view of 16.2 cm, a slice thickne ss of 3 mm, and a
pixel spacing of 5.4 mm in both directions. The scanner is
equipped with ultrafast detector electronics (Pico3D) and
has a spatial resolution of approximately 6 mm at full-
width at-half-maximum. PET imaging was done in three
dimensions, requiring a proper scatter correction. CT-
based attenuation correction was performed. PET images
were reconstructed from the acquired list mode data, using
Fourier rebinding and ordered subset expectation maximi-
zation reconstruction (three dimensional) with two itera-
tions and eight subsets (Ordered subset expecta tion
maximization). After a fasting period of at least 6 hours
prior to FDG injection, patients received an intravenous
injection of 18-FDG, with the activity normalized for the
weight of the patient, followed by an injection of physiolo-
gic saline (10 ml). After an uptake period of 60 minutes,
the patient was positioned on a flat tabletop, using a mova-
ble laser alignment system in a ‘’head-first supine’’ position
with the arm elevated over the head to avoid beam h a rden-
ing artefacts as well as errors caused by truncation of the
field of view. A PET-CT scan of the whole body was per-
formed using an acquisition time of 2 to 4 (depending of
the patient’s weight) minutes per bed position. Addition-
ally, all PET data were normalized for the blood glucose
level m easured shortly before 18-FDG administration (Glu-
cocard G me ter; Menarini Diagnostic, Flor ence).
PET analysis
Standardized uptake values (SUV) were calculated f or
each tumour ( Syngo Multim odality Workplace vs2009A;
Siemens Medical Solutions; Siemens AG, Berlin). SUV is
a measurement of the uptake in a tumour normalized
on the basis of a distribution volume. It is calculated as
follows:
SUV Act kBq ml Act MBq BW Kg
Gluc
glu voi administered
=
() ()()
⎡
⎣
⎤
⎦
×// /
pplasma
mmol L 5 mmol L//. /
()()
⎡
⎣
⎤
⎦
0
In these calculations, Act
voi
is the activity measured in
the volume of interest (this is equals the voxel with
highest uptake in tumour), Act
administered
is the adminis-
tered activity corrected for the physical decay of FDG to
the start of acquisition, a nd BW is body weight. Dedi-
cated software was used to calculate the SUV
max
within
thetumourbefore(SUV1)andafterCRT(SUV2).Sub-
sequently, the regression index (RI), indicating the per-
cent reduction relative to the pre-treatment measured
value, were calculated (RI = [(SUV1-SUV2)/SUV1] ×
100) and correlated to the patholo gical tumour
response. Furthermore the absolute SUV1-SUV2 differ-
ence was calculated ( DSUV). If no residual metabolic
activity was present on the pre-surgical PET-CT scan,
the patient’s tumour was classified as a metabolic com-
plete responder, and the SUV w as calculated in the
same region of interest.
Pathological tumour response
For each patient, the pathological tumour response was
evaluated by determining the T RG (tumour regression
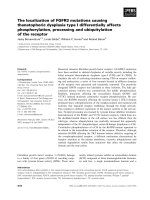
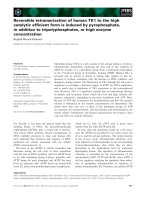
Figure 1 SUV2 values classified by tumour regression grade
criteria and ypStage criteria. Points are mean values; error bars
are 95% confidence interval.
Palma et al. Radiation Oncology 2010, 5:119
/>Page 2 of 8
grade), as proposed by Mandard et al.[7]Alltumours
were prospectively classified by an experienced patholo-
gist (JLM) who was blinded to the PET data, as follows:
TRG 1, complete tumour response; TRG2, residual can-
cer cells scattered through fibrosis; TRG 3, an increased
number of residual cancer cells, with predominant fibro-
sis; TRG 4, residual cancer outgrowing fibrosis; and
TRG 5, no regressive changes within the tumour. Based
on the TRG, the tumours were grouped into responders
(TRG 1 and 2) and non-responders (TRG 3-5). Further-
more, the pathological UICC classification (ypTN),
including those with complete response (ypCR), was col-
lected from the patients’ specimen pathology report.
Statistical analysis
Statistical analysis was performed using SPSS software
(PASW Statistics 17.0.2). Comparison of the post-CRT
SUVmax values vs. baseline was performed with the
paired-samples t-test, whereas the independent-samples
t-test was used to evaluate correlations between SUV, RI
and DSUV values and patient’ s classification as
responder or non-responder. Kruskal-Wallis test was
employe d to evalua te cor relations between SUV, RI and
DSUV values and the different TRG as well as the
UICC ypStage. Differences were considered to be signifi-
cant when the p-value was less than 0.05. The optimal
cut-off value for therapy-related decrease in SUVmax
was calculated by receiver-operating characteristic
(ROC) analysis. Sensitivity, specificity, and positive and
negative predictive values of 18F-FDG-PET-CT were
calculated using standard formulas.
Results
Patients and tumours characteristic
37 (74%) males and 13 (26%) femal es were included. The
age of the patients ranged between 36 and 80 years (mean
60). There were 35 (70%) patients with good to moderate
and 15 (30%) with poor differentiated adenocarcinoma. 6
(12%) patients revealed mucinous components. In 31
(62%) patients capecitabine was used as chemotherapy
combined with radiotherapy, in further 19 (38%) patients
oxaliplatine was added according to hospital guidelines.
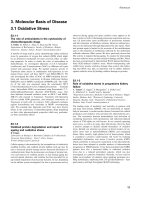
Figure 2 Partial metabolic response to CRT. 2A: Pre-CRT study - Intense rectal FDG uptake. 2B: Pre-CRT study - axial PET-CT images showing
hypermetabolic rectal mass. 2C: Post-CRT study - Tumour volume is reduced but considerable tumour uptake is still present. 2D: Axial PET-CT
images showing rectal mass in CT images with FDG uptake in PET images.
Palma et al. Radiation Oncology 2010, 5:119
/>Page 3 of 8
Treatment plan was followed by all 50 patients. Tumour
locati on ranged between 0 and 11 centimetres (cm) from
the anal verge (mean 6 cm).
Surgical data
Total mesorectal excision was performed in 48 patients
(96%). There was 1 patient (2%) with high anterior
resection (partial mesorectal excision) and another with
local resection after complete response. 15 of 50 (30%)
patients were submitted to abdomino-perineal resection
(APR) surgery and 33 (66%) to low anterior resection
(LAR). In 9 of 33 (27%) patients submitted to LAR, a
permanent colostomy was left. In all other cases with
LAR, protective ileostomy was indicated for three
months. Timing between CRT and surgery ranged
between 45-103 days (mean 59).
Histopathological analysis
According to Mandard’s criteria, the 50 patients treated
with preoperative CRT and surgery were classified as
TRG1 in 11 cases (22%), TRG2 in 9 (18%), TRG3 in 10
(20%), TRG4 in 12 (24%), and TRG5 in 8 (16%) (Table 1).
According to the prognostic value of TRG score, they were
classified into two groups: responders (TRG1-2; 20 patients
[40%]) and non-responders (TRG3-5; 30 patients [60%]).
According to the UICC classification, i.e. TNM cri-
teria, 10 patients (20%) were classified as ypStage 0
(ypCR), 15 patients (30%) as ypStage I, 11 patients (22%)
as ypStage II, and another 14 patients (28%) as ypStage
III (Table 2). Downstaging, no downstaging, and pro-
gression were found in 30 (60%), 19 (38%), and 1 (2%)
patient, respectively.
18F-FDG-PET/CT findings
The pre-treatment (SUV1) values ranged from 4,85 to
34,56 (mean 13,67). After completion of neoadjuvant
CRT, the glucose uptake (SUV2) values ranged from
2,36 to 15,85 (mean 5,7 3) (p < 0.001). DSUV and the
regression index (RI) mean and S D values were 7,9 (6,2
SD) and 53,2 (23,3 S D), respectively. DSUV assumed
negative value (SUV2 higher than SUV1) in 1 patient
(2%). The median time between the end of CRT and the
restaging PET and between PET and surgery was 42+6,3
and 17+10,7 days, respectively.
18F-FDG-PET/CT findings and pathological response
The correlation between SUV1, SUV2, DSUV, and RI
values resp. with the UICC Stage, and the TRG score
was o nly statistically significant for SUV2 values (Table
3 and Figure 3). Results of ROC analysis f or SUV1,
SUV2, DSUV, and RI adjusted to the group of respon-
ders are resumed in Table 4. To elaborate the informa-
tive value of PET with respect to predictability of
specific pathological response the cohort was divided
into two dichotomous groups: ypCR vs. no-ypCR (Table
5) and TRG1-2 vs. TRG3-5 (Table 6). Stratifying the
patients in responders and non-responders relating to
regression grade (TRG1-2 vs. TRG3-5), the RI values
were somewhat higher in the first group (59,65 +16,13
vs. 49,03+26,55, p = 0,116). The SUV1 and SUV2 values
differed statistically sign ifican t between respon ders and
non-responders (Table 6). DSUV was lower in the
responder group than in the non-responder. ROC analy-
sis found SUV2 to be the best predictor of response.
Using SUV2 value of 4,24 as the cut-off threshold for
defining response to therapy (AUC = 0.773, p < 0.001),
it is possible to discriminate between responders and
non-responders with a sensitivity of 70%, specificity of
76,6%, and PPV and NPV of 66,7%, and 79,3% respec-
tively. The overall accuracy was 74% (Table 4).
18F-FDG-PET/CT findings and ypCR
The SUV1 values were lower in the ypCR group than in
the no-ypCR group (11,28 SD 4,02 vs.14,34 SD 6,54,(p =
0,149), on the contrary the RI values were higher com-
paring the same groups (59,10 SD 16,88 vs. 5 1,64 SD
24,82) (table 5). The SUV2 was significantly different in
ypCR group vs. no-ypCR patients (Figure 3). ROC analy-
sis identified a 4,07 (SUV2) as the cut-off value to pre-
dict ypCR (AUC = 0,748, p = 0.001); relative specificity
and negative predictive value (NPV) were 74,4% and
87,9, respectively; whereas sensibility and positive pre-
dictive value (PPV) were 63% and 41,2, respectively;
total accuracy was 72% (Table 4).
Discussion
Positron emission tomography using fluoro-deoxy-glu-
cose has demonstrated added value in the clinical man-
agement of patien ts with colorectal cancer [6]. This
Table 1 Histopathological results: according to
preoperative clinical UICC-Stage and tumor regression
grade (TRG).
Stage n (%) TRG1 TRG2 TRG3 TRG4 TRG 5 Total
cStage II 3 (6) 1 (2) 4 (8) 7 (14) 5 (10) 20 (40)
cStage III 8 (16) 8 (16) 6 (12) 5 (10) 3 (6) 30 (60)
Total 11 (22) 9 (18) 10 (20) 12 (24) 8 (16) 50 (100)
Table 2 Histopathological results: according to UICC
stage before and after CRT
Stage
n (%)
ypStage
0
ypStage
I
ypStage
II
ypStage
III
Total
cStage II 3 (6) 10 (20) 6 (12) 1 (2) 20 (40)
cStage III 7 (14) 5 (10) 5 (10) 13 (26) 30 (60)
Total 10 (20) 15 (30) 11 (22) 14 (28) 50 (100)
Palma et al. Radiation Oncology 2010, 5:119
/>Page 4 of 8
includes primary staging, detection of recurrence, pre-
diction of individual prognosis, therapy response, and
evaluation of treatment response as assessed in this
investigation [8].
The interest in FDG-PET to assess tumour response
to CRT began in the early 1990 s. Rectal cancer is a dis-
ease model of particular interest, not only for its high
incidence, but also because an accurate and non-invasive
method to evaluate response to preoperative CRT could
lead to patients’ selection for minimally invasive surgical
approaches or even selection of candidates for additional
chemotherapy and observation without any kind of sur-
gery [2,3].
Experts at the Memorial Sloan-Kettering Cancer
Center reported a pioneer prospec tive assessment of
LARC response to preoperative CRT using FDG-PET
in 2000 [9]. Today, literature is mixed in regard to the
ability of 18-FDG-PET to predict response to neaodju-
vant treatment in patients with rectal cancer. The
majority of studies have reported post-treatment SUV
to be lower than pre-treatment scans, but posttreat-
ment SUV was not found to correlate with pCR.
Furthermore, combining PET and CT with fusing of
function and morphologic data has increased the sensi-
tivity and specificity in restaging of various malignant
tumours including LARC after CRT.
Recently, de Geus-Oei [8] analysed in an outstanding
review the difficulty in comparing the outcome of differ-
ent studies because of the use of several methods to
analyse i.e. visual FDG-PET response, SUVmax, SUV-
mean, SUV ratio or even TLG (change i n total lesion
glycolysis) and that even at different intervals after CRT,
varying from 12 days up to 7 weeks. It is interesting to
note that all analysed papers found a significant relation
of the investigated FDG-PET parameter to semiquantita-
tive histological response [10-15]. Referring to response
criteria, predictive values of FDG-PET response (nega-
tive predictive value) ranged between 83 to 100%; pre-
dictive values of FDG-PET non-response (positive
predictive value) varied from 77 to 100%. The authors
addressed that the mor e rigorous criteria of treatment
response were defined the worse results were obtained
[10-15].
Our results using SUVmax and performing the analy-
sis 5 to 7 weeks after completion of CRT are in accor-
dance with t hose found in li terature [8]. We noticed a
statistically significant difference between responders
and non-responders according to Mandard’scriteriafor
SUV 1 and SUV2 with a specificity of 76,6% and a PPV
of 66,7%. Furthermore, SUV2 values were able to differ-
ent iate patients with complete pathologic response with
a sensitivity of 63% and a specificity of 74,4% (PPV
41,2% and NPV 87,9%); This rather low sensitivity and
specificity determined that PET-CT was only able to dis-
tinguish 7 patients with confirmed pCR from a total of
11 (4 cases were false negative). In addition to that,
further 10 patients were false positive for pCR upon
PET-CT.
While there are substantial data regarding the rela-
tionship between pCR and improved oncologic outcome,
the prognostic significance of responders without pCR
has not been extensively evaluated [16]. In our investiga-
tion, sampli ng the histopat hological results according to
the UICC (TNM) and Mandard’s criteria appear to be
in accordance with daily practice in hospitals. Whether
Mandard’s 1 and 2 classes belong both unequivocally to
the responders is still a matter of discussion, on the
contrary pCR seems to represent one of the most
important prognostic factors leading to a more conser-
vative surgical therapy and even to a wait and see non-
resection policy in some series [2,3]. It should be also
underlined that several publications have focussed on
Table 3 Tumor 18F-FDG uptake before (SUV1) and after neoadjuvant CRT (SUV2) according to UICC and Mandard’s
criteria (Kruskal-Wallis test).
n SUV1 SUV2 DSUV RI
Mean SD p Mean SD p Mean SD p Mean SD p
UICC 0,130 0,10 0,825 0,658
0 10 11,7 3,8 4,2 2,0 7,4 3,5 60,9 16,5
1 15 15,7 7,1 6,4 2,7 9,3 8,1 53,1 23,1
2 11 15,9 7,3 7,7 3,7 8,2 7,6 43,6 35,0
3 14 10,9 4,0 4,4 1,2 6,4 3,8 55,5 14,6
TRG 0,678 0,02 0,967 0,676
1 11 11,2 4,0 4,2 1,9 7,0 3,7 59,1 16,8
2 9 12,2 3,8 4,5 1,5 7,6 3,4 60,3 16,1
3 10 14,0 6,4 5,6 1,9 8,4 6,9 53,1 20,7
4 12 15,1 7,1 6,4 2,7 8,7 8,1 51,1 24,1
5 8 13,6 6,1 8,1 4,3 7,6 8,2 40,7 36,6
Palma et al. Radiation Oncology 2010, 5:119
/>Page 5 of 8
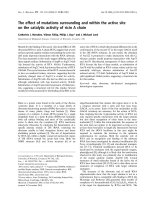
Figure 3 Complete metabolic response to CRT. 1A: Pre-CR T study - Intense rectal FDG uptake. 1B: Pre-CRT study - axial PET-CT images
showing hypermetabolic rectal mass. 1C: Post-CRT study - Absence of rectal FDG uptake 1D: Axial PET-CT images showing rectal mass in CT
images without FDG uptake.
Table 4 ROC analysis of 18F-FDG-PET findings for responders according to Mandard criteria (TRG1-2) and specifically
to complete pathological response (ypCR).
Variable End-point Cutoff AUC p Sens.% Esp.% PPV% NPV% Acc.%
SUV1 TRG1-2 ≤10,07 0,618 0,160 45 70 50 65,6 60
ypCR ≤10,14 0,615 0,243 45,5 74,4 33,3 82,9 68
SUV2 TRG1-2 ≤4,24 0,773 0,001 70 76,7 66,7 79,3 74
ypCR ≤4,07 0,748 0,013 63 74,4 41,2 87,9 72
DSUV TRG1-2 ≥8,90 0,545 0,593 45 70 50 65,6 60
ypCR ≥9,735 0,508 0,935 36,4 71,8 26,7 80 64
RI TRG1-2 ≥62,75 0,623 0,14,3 55 70 55 70 64
ypCR ≥69,67 0,585 0,393 45,5 74,4 33.3 82.8 68
Palma et al. Radiation Oncology 2010, 5:119
/>Page 6 of 8
the prognostic value of metabolic response assessed by
PET, independent of the final pathology report [17-19].
Time interval between the end of CRT and surgery
and time interval between the end of CRT and post-
treatment PET-CT scan are two variables not previously
investigated that could affect the ability of PET scans to
predict response t o CRT. Cascini [20] and Janssen [21],
have described the increased predictive v alue of FDG-
PET when performed at an earlier and perhaps more
relevant clinical stage, i.e.12 and 14 days (respectively)
after CRT.
Our results are similar to those obtained using only
PET for preoperative staging. Thus, the anatomical
information obtained from the CT in a PET-CT scan
does not seem to improve the detection rate of residual
disease in our investigation. A drawback of post-CRT
18F-FDG PET is the r adiation-induced inflammation
that can accumulate approximately 25% of FDG update.
On th e other hand , direct effect of radiation may induce
tumour cell dormancy ("stunning” )thatmimics
response. Whether the different chemotherapeutical
drugs used and combined with radiotherapy differen-
tially affect the metabolism of the FDG at the tumour
site is still unknown [22].
Our data are in accordance with literature that
showed that PET-CT performed 5 to 7 weeks after com-
pletion of CRT can visualise functional tumour response
in patients treated with neoadjuvant CRT. In contrast,
metabolic imaging with FDG-PET is not able to predict
pathologic complete response in LARC accurately.
Conclusions
Our investigation identified PET-CT scan response as a
complementary diagnostic and prognos tic method in
patients with locally advanced rectal cancer treated with
neoadjuvant chemoradiotherapy. O n the contrary, our
results indicate that due to the rather low sensitivity and
specificity, it does not seem possible to select patients
upon metabolic imaging by means of 18F-FDG PET-CT
to whom radical surgery after neoadjuvant CRT could
be avoided.
Acknowledgements
Preliminary data of this work were presented by RCM and awarded at the
2009 Annual Meeting of the Spanish Society of Coloproctology (AECP) held
in Barcelona. Founded by the Fundación Investigación Mutua Madrileña. We
are indebted to M. Expósito Ruiz for statistical support. and to J-L Marín
Aznar for pathologic analysis.
Author details
1
Division of Colon &Rectal Surgery - Department of Surgery, HUVN
Granada - Spain.
2
Department of Nuclear Medicine, HUVN Granada - Spain.
Authors’ contributions
PP was responsible for overall planning, execution and interpretati on of the
study. ARF, RSS and MGR performed all nuclear studies, recorded and
maintained PET data records. RCM, ISJ and JMC were responsible for surgical
workout, including pathologic and oncologic data records. JAFO and JMLE
contributed as senior members in planning and interpreting the study. All
authors read and approved the manuscript.
Competing interests
The authors declare that they have no competing interests.
Received: 5 September 2010 Accepted: 15 December 2010
Published: 15 December 2010
References
1. Glynne-Jones R, Dunst J, Sebag-Montefiore D: The integration of oral
capecitabine into chemoradiation regimens for locally advanced rectal
cancer: how successful have we been? Ann Oncol 2006, 17:361-371.
2. Habr-Gama A, Perez RO: Non-operative management of rectal cancer
after neoadjuvant chemoradiation. Br J Surg 2009, 96:127-127.
3. Neuman HB, Elkin EB, Guillem JG, Paty PB, Weiser MR, Wong WD,
Temple LK: Treatment for patients with rectal cancer and a clinical
complete response to neoadjuvant therapy: A decision analysis. Dis
Colon Rectum 2009, 52:863-871.
4. Kim SH, Lee JM, Hong SH, Kim GH, Lee JY, Han JK, Choi BI: Locally
advanced rectal cancer: Added value of diffusion-weighted MR imaging
in the evaluation of tumor response to neoadjuvant chemo- and
radiation therapy. Radiology 2009, 253:116-125.
5. Ruhlmann J, Schomburg A, Bender H: Fluorodeoxyglucose whole-body
positron emission tomography in colorectal cancer patients studied in
routine daily practice. Dis Colon Rectum 1998, 40:1195-1204.
6. Llamas-Elvira JM, Rodríguez-Fernández A, Gutiérrez-Sáinz J, Gomez-Rio M,
Bellón-Guardia M, Ramos-Font C, Rebollo-Aguirre AC, Cabello-García D,
Ferrón Orihuela A: Fluorine-18 fluorodeoxyglucose PET in the
preoperative staging of colorectal cancer. Eur J Nucl Med Mol Imaging
2007, 34:859-867.
7. Mandard AN, Dalibar DF, Mandard JC: Pathological assessment of tumor
regression after preoperative chemotherapy of oesophageal carcinoma:
clinico-pathological correlations. Cancer 1994, 73:2680-2686.
Table 5 T test for ypCR vs. no ypCR
Complete Pathologic
Response
N Mean Std.
Deviation
P
value
SUV1 ypCR 11 11,2836 4,02432 0,149
No ypCR 39 14,3403 6,54395
SUV2 ypCR 11 4,2427 1,98688 0,013
No ypCR 39 6,1492 2,93618
RI ypCR 11 59,1092 16,88429 0,354
No ypCR 39 51,6421 24,82499
DSUV ypCR 11 7,0409 3,71728 0,594
No ypCR 39 8,1910 6,78728
Table 6 T test for responders (TRG 1-2) vs. non-
responders (TRG 3-5)
Response N Mean Std. Deviation P value
SUV1 TRG 3-5 30 14,9740 7,08401 0,041
TRG 1-2 20 11,7085 3,88062
SUV2 TRG 3-5 30 6,6283 3,09551 0,001
TRG 1-2 20 4,3820 1,77455
RI TRG 3-5 30 49,0374 26,55346 0,116
TRG 1-2 20 59,6560 16,13640
DSUV TRG 3-5 30 8,3457 7,54783 0,524
TRG 1-2 20 7,3265 3,52060
Palma et al. Radiation Oncology 2010, 5:119
/>Page 7 of 8
8. de Geus-Oei LF, Vriens D, van Laarhoven HWM, van der Graaf WTA,
Oyen WJG: Monitoring and predicting response to therapy with 18F-FDG
PET in colorectal cancer: a systematic review. J Nucl Med 2009, 50:43-54.
9. Guillem JG, Puig-La Calle J Jr, Akhurst T, Tickoo S, Ruo L, Minsky BD,
Gollub MJ, Klimstra DS, Mazumdar M, Paty PB, Macapinlac H, Yeung H,
Saltz L, Finn RD, Erdi Y, Humm J, Cohen AM, Larson S: Prospective
assessment of primary rectal cancer response to preoperative radiation
and chemotherapy using 18-fluorodeoxyglucose positron emission
tomography. Dis Colon Rectum 2000, 43:18-24.
10. Calvo FA, Domper M, Matute R, Martínez-Lázaro R, Arranz JA, Desco M,
Alvarez E, Carreras JL: 18F-FDG positron emission tomography staging
and restaging in rectal cancer treated with preoperative
chemoradiation. Int J Radiat Oncol Biol Phys 2004, 58:528-535.
11. Denecke T, Rau B, Hoffmann KT, Hildebrandt B, Ruf J, Gutberlet M,
Hünerbein M, Felix R, Wust P, Amthauer M: Comparison of CT, MRI and
FDG-PET in response prediction of patients with locally advanced rectal
cancer after multimodal preoperative therapy: is there a benefit in using
functional imaging? Eur Radiol 2005, 15:1658-1666.
12. Capirci C, Rampin L, Erba PA, Galeotti F, Crepaldi G, Banti E, Gava M, Fanti S,
Mariani G, Muzzio PC, Rubello D: Sequential FDG-PET/CT reliably predicts
response of locally advanced rectal cancer to neo-adjuvant chemo-
radiation therapy. Eur J Nucl Med Mol Imaging 2007, 34:1583-1593.
13. Melton GB, Lavely WC, Jacene HA, Schulick RD, Choti MA, Wahl RL,
Gearhart S: Efficacy of preoperative combined 18-fluorodeoxyglucose
positron emission tomography and computed tomography for assessing
primary rectal cancer response to neoadjuvant therapy. J Gastrointest
Surg 2007, 11:961-969.
14. Kristiansen C, Loft A, Berthelsen AK, Graff J, Lindebjerg J, Bisgaard C,
Jakobsen A: PET/CT and histopathologic response to preoperative
chemoradiation therapy in locally advanced rectal cancer. Dis Colon
Rectum 2008, 51:21-25.
15. Konski A, Li T, Sigurdson E, Cohen SJ, Small W Jr, Spies S, Yu JQ, Wahl A,
Stryker S, Meropol NJ: Use of molecular imaging to predict clinical
outcome in patients with rectal cancer after preoperative chemotherapy
and radiation. Int J Radiat Oncol Biol Phys 2009, 74:55-59.
16. de Campos-Lobato LF, Stocchi L, da Luz Moreira A, Kalady MF, Geisler D,
Dietz D, Lavery IC, Remzi FH, Fazio VW: Downstaging without complete
pathologic response after neoadjuvant treatment improves cancer
outcomes for cIII but not cII rectal cancers. Ann Surg Oncol 2010,
17:1758-1766.
17. Capirci C, Rubello D, Chierichetti F, Crepaldi G, Fanti S, Mandoliti G,
Salviato S, Boni G, Rampin L, Polico C, Mariani G: Long-term prognostic
value of 18FFDG PET in patients with locally advanced rectal cancer
previously treated with neoadjuvant radiochemotherapy. AJR 2006,
187:202-208.
18. Guillem JG, Moore HG, Akhurst T, Klimstra DS, Ruo L, Mazumdar M,
Minsky BD, Saltz L, Wong WD, Larson S: Sequential preoperative
fluorodeoxyglucose-positron emission tomography assessment of
response to preoperative chemoradiation: a means for determining
long-term outcomes of rectal cancer. J Am Coll Surg 2004, 199:1-7.
19. Nakagawa K, Yamashita H, Nakamura N, Igaki H, Tago M, Hosoi Y,
Momose T, Ohtomo K, Muto T, Nagawa H: Preoperative radiation
response evaluated by 18-fluorodeoxyglucose positron emission
tomography predicts survival in locally advanced rectal cancer. Dis Colon
Rectum 2008, 51:1055-1060.
20. Cascini GL, Avallone A, Delrio P, Guida C, Tatangelo F, Marone P, Aloj L, De
Martinis F, Comella P, Parisi V, Lastoria S: 18F-FDG PET is an early predictor
of pathologic tumor response to preoperative radiochemotherapy in
locally advanced rectal cancer. J Nucl Med 2006, 47:1241-1248.
21. Janssen MH, Ollers MC, Riedl RG, van der Bogaard J, Buijsen J, van
Stiphout RGPM, Aerts HJWL, Lambin P, Lammering G: Accurate prediction
of pathological rectal tumor response after two weeks of preoperative
radiochemotherapy using 18F-Fuorodeoxyglucose-positron emission
tomography-computed tomography imaging. Int J Radiation Oncology
2010, 77:392-399.
22. Akhurst T, Kates TJ, Mazumdar M, Yeung H, Riedel ER, Burt BM, Blumgart L,
Jarnagin W, Larson SM, Fong Y: Recent chemotherapy reduces the
sensitivity of 18F-fluorodeoxyglucose positron emission tomography in
the detection of colorectal metastates. J Clin Oncol 2005, 23:8713-8716.
doi:10.1186/1748-717X-5-119
Cite this article as: Palma et al.: The value of metabolic imaging to
predict tumour response after chemoradiation in locally advanced
rectal cancer. Radiation Oncology 2010 5:119.
Submit your next manuscript to BioMed Central
and take full advantage of:
• Convenient online submission
• Thorough peer review
• No space constraints or color figure charges
• Immediate publication on acceptance
• Inclusion in PubMed, CAS, Scopus and Google Scholar
• Research which is freely available for redistribution
Submit your manuscript at
www.biomedcentral.com/submit
Palma et al. Radiation Oncology 2010, 5:119
/>Page 8 of 8

![Tài liệu Báo cáo khoa học: The stereochemistry of benzo[a]pyrene-2¢-deoxyguanosine adducts affects DNA methylation by SssI and HhaI DNA methyltransferases pptx](https://media.store123doc.com/images/document/14/br/gc/medium_Y97X8XlBli.jpg)