Báo cáo khoa học: "Biological in-vivo measurement of dose distribution in patients’ lymphocytes by gamma-H2AX immunofluorescence staining: 3D conformal- vs. step-and-shoot IMRT of the prostate gland" ppsx
Bạn đang xem bản rút gọn của tài liệu. Xem và tải ngay bản đầy đủ của tài liệu tại đây (847.07 KB, 8 trang )
RESEARCH Open Access
Biological in-vivo measurement of dose distribution
in patients’ lymphocytes b y gamma-H2AX
immunofluorescence staining: 3D conformal- vs.
step-and-shoot IMRT of the prostate gland
Felix Zwicker
1,2*
, Benedict Swartman
1
, Florian Sterzing
1
, Gerald Major
1
, Klaus-Josef Weber
1
, Peter E Huber
1,2
,
Christian Thieke
1,2
, Jürgen Debus
1
and Klaus Herfarth
1
Abstract
Background: Different radiation-techniques in treating local staged prostate cancer differ in their dose-
distribution. Physical phantom measurements indicate that for 3D, less healthy tissue is exposed to a relatively
higher dose compared to SSIMRT. The purpose is to substantiate a dose distribution in lymphocytes in-vivo and to
discuss the possibility of comparing it to the physical model of total body dose distribution.
Methods: For each technique (3D and SSIMRT), blood was taken from 20 patients before and 10 min after their
first fraction of radiotherapy. The isolated leukocytes were fixed 2 hours after radiation . DNA double-strand breaks
(DSB) in lymphocytes’ nuclei were stained immunocytochemically using the gamma-H2AX protein. Gamma-H2AX
foci inside each nucleus were counted in 300 irradiated as well as 50 non-irradiated lymphocytes per patient. In
addition, lymphocytes of 5 volunteer subjects were irradiated externally at different doses and processed under
same conditions as the patients’ lymphocytes in order to generate a calibration-line. This calibration-line assigns
dose-value to mean number of gamma-H2AX foci/ nucleus. So the dose distributions in patients’ lymphocytes
were determined regarding to the gamma-H2AX foci distribution. With this information a cumulative dose-
lymphocyte-histogram (DLH) was generated. Visualized distribution of gamma-H2AX foci, corre spondingly dose per
nucleus, was compared to the technical dose-volume-histogram (DVH), related to the whole body-volume.
Results: Measured in-vivo (DLH) and according to the physical treatment-planning (DVH), more lymphocytes
resulted with low-dose exposure (< 20% of the applied dose) and significantly fewer lymphocytes with middle-
dose exposure (30%-60%) during Step-and-Shoot-IMRT, compared to conventional 3D conformal radiotherapy. The
high-dose exposure (> 80%) was equal in both radiation techniques. The mean number of gamma-H2AX foci per
lymphocyte was 0.49 (3D) and 0.47 (SSIMRT) without significant difference.
Conclusions: In-vivo measure ment of the dose distribution within patients’ lymphocytes can be performed by
detecting gamma-H2AX foci. In case of 3D and SSIMRT, the results of this method correlate with the physical
calculated total body dose-distribution, but cannot be interpreted unrestrictedly due to the blood circulation. One
possible application of the present method could be in radiation-protection for in-vivo dose estimation after
accidental exposure to radiation.
* Correspondence:
1
Department of Radiation Oncology, University of Heidelberg, Heidelberg,
Germany
Full list of author information is available at the end of the article
Zwicker et al . Radiation Oncology 2011, 6:62
/>© 2011 Zwicker et al; licensee BioMed Central Ltd. This is an Open A ccess article distributed under the terms of the Creative Commons
Attribution License (http://creativec ommons.org/licenses/by/2.0), which permits unrestricted use, distribution, and reproduction in
any medium, pro vided the original work is properly cited.
Introduction
In radiotherapy, high doses have to be delivered to the
tumour. However, sparing of healthy tissue and organs at
risk is essential. Variations can be made by increasing the
number of radiation beams, which leads to differences in
dose distribution between two radiation-techniques: the
three dimensional conformal (3D) a nd the Step-and-
shoot-IMRT (SSIMRT). According t o the number o f
beams, the irradiated volume as well as the dose-distribu-
tion can change. Smaller volume has to be compensated
by higher dose to reach the prescribed target dose inside
the tumor. In our prostate radiotherapy protocol, the 3D-
conformal therapy contains 4 beams, whereas in
SSIMRT, dose is distributed within 7-9 beams. The dis-
tributionoflowdosesisbroaderinalargervolumein
SSIMRT.
Using the gamma-H2AX stain to detec t DNA-double
strand breaks (DSB) in human l ymphocytes is known as
an established method [1]. Localized near or at irradiation
induced DSB, the H2AX histones are phosphorylated sen-
sitively to provide signalling within the DNA DSB-repair.
As one DSB represents one gamma-H2AX focus, it is pos-
sible to visualize DSB immunocytochemically using a
fluorescence microscope [2,3]. The number of foci can be
used as a reliable parameter to estimate the delivered dose,
since it increases linearly with the induction of DSB [4].
These cellular responses are equally efficient at different
doses. But there is an evidence, that the activation of
DNA-repair needs a certain level of DNA damage; approx-
imate 1 mGy [5].
It has to be considered, that gamma-H2AX foci are an
indirect marker and that equalization with the exact
number of DSB, especially after repair, is currently a
debate [6,7].
Lymphocytes can easily be taken from the patient’s per-
ipheral vein and, due to the described method, used as
biological dosimeters. The focus of the study lies on the
dose distribution within the lymphocytes measured indir-
ectly by gamma-H2AX foci in patients undergoing radio-
therapy in the prostate region. Whether the results can
serve as a surrogate for dose distribution in the irradiated
body volume and therefore for a new method of biologi-
cal dosimetry must be discu ssed critically. Limitations
have to be taken into consideration, e. g. circulation of
the lymphocytes in the body during irradiation [4].
The purpose of this study is to visualize the cellular
effect of ionizing radiation during prostate cancer treat-
ment, by evaluating the dose-distri bution using the
gamma-H2AX immunodetection in human lymphocytes.
If possible, we want to verify the differences in dose dis-
tribution between 3D conf ormal and SSIMRT with bio-
logical methods.
Material and methods
Patients and Irradiation
Individuals analyzed in this study were all males, with a
median age of 71.4 years (range 51.1 - 83.6), and had an
indication for irradiation of the prostate region. This
selection was made, because the DNA damage level
depends on the anatomic region [8]. Exclusion c riteria
were a prior radiation in the patients’ medical history
(so no exposition in advance could interfere with the
test) or the additional radiation of lymphatic regions of
the pelvis. For either treatment method (3D, SSIMRT),
20 patients were recruited. All patients gave their
informed consent. The study was approved by the ethics
comm ittee of the University hospital of Heidelberg. The
patients’ trea tment was not influenced by the study and
indications for the d ifferent modalities were made clini-
cally. Further patient data comparing 3D with SSIMRT
is shown in Table 1. The body volume was calculated by
the formula as it is published for male patients [9]:
body volume(l)=bodyweight(kg) × 1.075(
l
kg
)
The radiation was performed by a department’slinear
accelerator (Oncor, Siemens). Table 2 contents the tech-
nical parameters of the two irradiation modalities. To
calibrate absolute doses to the investigated number of
gamma-H2AX foci, blood of 5 volunteers was irradiated
in-vitro for 3 independent measurements on different
days. Utilization of volunteers was necessary because of
intended test repetition, not suitable for patients. Inter-
individual differences were considered b y investigating 5
subjects. The venous blood was irradiated with doses of
0.02, 0.1, 0.5, 1 and 2 Gy by the same linear accelerator
used for the irradiations of the patients. The object-to-
focus distance was 1.58 m, the radiation field 10 × 5 cm.
Radiation absorbing plates were stacked to a 20 cm tower
to allow very low dosage; so the beam on time reaches
Table 1 Data of prostate cancer patients, which were treated by 3D (n = 20) or SSIMRT (n = 20)
3D SSIMRT
median range median range
body volume (l) 86.0 69.88 - 154.8 85.46 53.75 - 103.2
planned target volume (cm
3
) 132.0 83.0 - 319.2 181.0 71.8 - 337.1
age (years) 69.7 51.1 - 83.6 71.6 65.4 - 81.9
Zwicker et al . Radiation Oncology 2011, 6:62
/>Page 2 of 8
the operating range of the linear accelerator after the sta-
bilization phase. By varying the time of radiation, differ-
ent doses were applied. Dose was measured by relative
online dosimetry (DIN 6800-2) by using an ionization
chamber (thimble 0,3 cm
3
, PTW, Freiburg, Germany).
Lymphocyte separation and immunofluorescence analysis
7.5 ml of patient’s blood were taken from a peripheral
vein 10 min after the first fraction of the treatment. The
blood circulation was given 10 minutes after fraction to
mix the r adiated lymphocytes with the rest that hadn’t
been exposed to radiation. Non-exposed controls were
also taken before radiation.
The protocol of staining gamma-H2AX by indirect
immuno fluorescence is published in many papers and its
purpose for detecting DNA DSB validated [10, 11, 12, 13,
14 and 15]. Lymphocytes were separated from the b lood
by layering 5 ml of heparinized, venous blood onto 3 ml of
Ficoll and centrifuging at 2300 rpm for 20 min at 37°C.
The lymphocytes were washed in 6 ml of PBS-buffer and
centrifuged at 1500 rpm for 10 min (37°C). After aspirat-
ing the buffer, the cell-pellet was re-suspended in a 1:15
ratio. 200 μl of this suspension, containing about 300,000
lymphocytes, were spread onto a clean slide by means of
the Cytospine Centrifuge at 22 rpm for 4 min (room tem-
perature). Fixating the lymphocytes took 10 minutes
(room temperature) in fixation buffer (3% paraformalde-
hyde, 2% sucrose in PBS). For all experiments, this step
was performed 2 hours after finishing radiation to allow
comparability between th e samples. In order to allow the
antibodies getting inside the nucleus, the cells were per-
meabilized for 4 min at 4°C (permeabilisation buffer:
20 mM HEPES (pH 7.4), 5 0 mM NaCl, 3 mM MgCl
2
,
300 mM sucrose, and 0.5% Triton X-100). Samples were
incubated with anti-gamma-H2AX antibody (Anti-Phos-
pho-Histone-gamma-H2AX Monoclonal IgG-mouse-Anti-
body (# 05-636), Upstate, Charlottesville, VA) at a 1:500
dilution for 1 h, washed in PBS 4 times, and incubated
with the secondary antibody (Fluoresceiniso-thiocyanat
(FITC)-conjugate, Alexa Fluor 488 Goat-anti-mouse-IgG-
conjugate, Molecular Probes, Eugene, OR) at a dilution of
1:200 for 0.5 h. Both incubations took place at 37°C. Cells
were then washed in PBS four times at room temperature
and mounted by using VECTASHIELD mounting medium
including the nucleus stain DAPI (Vector Laboratories).
Thus, the gamma-H2AX foci could be correlated with the
nuclei.
The slides were viewed with an × 100 objective (fluor-
escence-microscope Laborlux S, Leica Microsystems
CMS GmbH, Wetzlar, Germany). The spots i nside the
nucleus were counted by eye b ecause of the p ossibility to
focus manually through the whole nucleus by microscope
to detect each focus in the 3D-room. All experiments
were counted by one and the same, train ed person. For
each of the samples, 300 lymphocytes were analyzed
within the patient samples with its heterogeneous dose-
distribution. All nuclei were morphologically considered
by eye (cell form and size) to be properly shaped and in
G0/1-phase with haploid chromosome-set.
Due to their homogenous radiation, in-vitro samples
and controls wer e investigated by count ing 50 cells each
experiment and measuring point. Three independent
experiments were done.
Data and statistical analysis
For every patient, gamma-H2AX foci of the lymphocytes
were counted. For every count of gamma-H2AX foci per
nucleus the averaged relative number of cells was calcu-
lated from 20 patients each group (3D and SSIMRT).
The calibration curve involved five subjects irradiated
at six different doses in three independent measure-
ments. Background foci levels were subtracted. As the
relationship between dose application and irradiation
induced gamma-H2AX foci formation is linear [4], a lin-
ear regression curve was generated, which implies the
following general formula:
Y
=
m
∗
X
(Y = numbe r of g amma-H2AX foci per nucleus, × =
dose in Gy, m = gradient)
This linear regression curve was used to calculate an
equivalent dose for every co unt of irradiation induced
gamma-H2AX foci per nucleus in pat ients’ lymphocytes.
Background foci were subtracted again (controls before
irradiation). In addition, the values of gamma-H2AX foci
were converted into relative doses, whereas 100% c orre-
sponds to the given dose of 2.0 Gy (3D) and accordingly
2.17 Gy (SSIMRT). The calibration concerns only the sin-
gle lymphocyte, irrespectively body site or blood flow.
In a further integral diagram, the relative number of
lymphocytes with gamma-H2AX foci was plotted against
the relative applied dose in %. Each point shows the
Table 2 Technical data: 3D vs.IMRT
3D SSIMRT
beams 4 7-9
boost sequential integrated
SD (Gy) 2 2.17
CD (Gy) 72 76
fractions 36 35
energy (MV) 18 6
dose output (MU/min) 300 300
mean beam-on time (min) 1.29 6.16
mean table time (min) 11.5 16.3
SD = Single fraction dose, CD = Cumulative dose, MV = Megavol ts, MU =
Monitor units.
Zwicker et al . Radiation Oncology 2011, 6:62
/>Page 3 of 8
cumulative number of lymphocytes exposed to a certain
dose, or more. This visualization of distribution of
radiated lymphocytes was defined as dose-lymphocyte-
histogram (DLH).
The original dose-volume-histograms (DVH) were mod-
ified in order to compare them to our generated DLHs: in
general, the volume percentage in the DVH refers to the
contoured volume of the CT-scanned part of the body
(aortic bifurcation to the thigh). The data was standardized
by referring it to the individual’s total body volume, allow-
ing interpretation equivalent to the DLH. With the rule of
proportion the values of the contoured volumes can trans-
ferred to values of total body volumes.
Formula:
% total body volume = % contoured volume×[contoured volume
(
l
)
/ total body volume
(
l
)]
The statistics were done by Sigma Plot 10.0
®
.The
level of significance was set at p < 0.05 using a Student’s
t-test.
Results
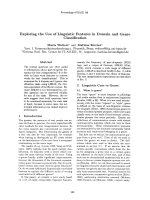
In-vitro measurements for calibration curve
The relation of dose and mean number of gamma-H2AX
foc i per nu cleus (see also Figure 1) of all 5 subjects’ lym-
phocytes follows the same characteristic without signifi-
cant differences (p > 0.05), which confirms the absence
of inter-individual differences [16]. The estimated regres-
sion line i s used as a calibration curve (Figure 2) and its
formula is:
Y=
7
.8
5
98
77
∗
X
(Y = numbe r of g amma-H2AX foci per nucleus, × =
dose in Gy)
For example, 0.5 Gy correlates with a mean number of
gamma-H2AX foci per nucleus of 4.9, 1 Gy with 8.6 and
2 Gy with 16 foci, 2 hours after irradiation.
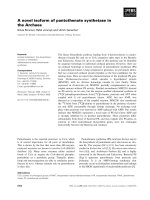
In-vivo measurements of patients’ lymphocytes
Related to investigated lymphocytes of 20 patients per
group the mean number of gamma-H2AX foci per
nucleus is 0.49 (3D) and 0.47 (SSIMRT) in the irradiated
samples (Figure 3), while the non-irradiated control
marks 0.06 (3D) and 0.05 (SSIMRT). The number of
foci in the samples after irradiates were for all the
patients larger than the number of foci in the non-irra-
diated control samples. The bars show significant differ-
ence between irradiated samples and the control (p ≤
0.05). The mean number of gamma-H2AX foci in both
radiation modalities is the same (p > 0.05).
Dose-lymphocyte histogram (DLH)
The DLH is a cumulative histogram; e ach point shows
the cumulated number of lymphocytes that has been
exposed to a certain dose, or more (Figure 4). Back-
ground foci-levels have been su btracted, since they were
also subtracted in the calibration line. The curves cross
at about 20% of the described dose, while the SSIMRT
curve lies above the 3D curve at lower doses and below
it at higher doses. The significant difference is obvious
between 40% and 90% of the delivered dose: here, the
SSIMRT curve lies significantly below the 3D curve (p ≤
0.05). There is no difference in relative number of lym-
phocytes, which get more than 95% of the applied dose.
The percentage of lymphocytes exposed t o more than
50% of the prescribed dose is 1.8% in 3D technique,
compared to 0.9% in SSIMRT.
Dose-volume histogram (DVH)
The curves’ crossing point in the DVH takes place at
just below 20% of the described dose, whereas the
SSIMRT lies above the 3D at 0%-20% and significantly
(p ≤ 0.05) below it between 30%-95% (Figure 5). The
percentage of volume exposed to more than 50% of the
prescribed dose is 1.7% in 3D technique, compared to
0.4% in SSIMRT.
Discussion
Lymphocytes of patients receiving irradiation for the
treatment of prostate cancer have been analyzed by
scoring gamma-H2AX foci. A distribution of delivered
dose to the lymphocytes is shown and visualized in the
graphics above. Similarity between DLH (dose-lympho-
cyte-histogram) and DVH (dose-volume-histogram) has
been found. The biological measurement on behalf o f
the human lymphocytes corresponds to the distribution
calculated by the physicists: more low-dose-delivery is
observed for t he SSIMRT compared to the 3D. At the
same time, a lower distribution of 30%-90% of the
applied dose can be reported for the SSIMRT.
The advantage of this method is an easy and fast
access to the required material without any massive
medical interventions. The method allows an in vivo
estimation respectively proof of the dose distribution
calculated by the therapy planning system.
The challenge is that every patient has to be irradiated
atacomparablevolumeandsamesiteofthebody.
Attention also has to be paid to the repair kinetics and
withdraw of gamma-H 2AX foci, which make it necessary
to stop cell metabolism after a certain duration post irra-
diation. Due to this context, we fixed all cells 2 h after
irradiation (in-vivo and in-vitro) to allow comparability
between the samples.
However, the determination of the p robability of lym-
phocytes’ presence in the body tissue is difficult, due to
the lymphocytes’ kinetics (circulation in the blood ves-
sels), migration and adhesion to the vessel wall. These
circumstances have been described by Sak et al. in detail
Zwicker et al . Radiation Oncology 2011, 6:62
/>Page 4 of 8
[4]. It has to be considered, that lymphocytes in in-field
capillaries move slower and receive more dose, than fast
moving lymphocytes in larger vessels. Sak et al. described
differences in mean numbers of gamma-H2AX foci in
lymphocytes depending on irradiated target sites, e.g.
brain and thorax. In our study, target site was no variable
parameter, since we compared 3D and SSIMRT only in
prostate cancer treatment.
The SSIMRT’s beam-on-time differed from the 3D’sby
a factor 5 (Table 2). Assuming a blood circulation time of
one minute, this fact causes inaccuracy w hile measuring
the actual dose distribution. On the other hand, table
time in both modalities differs by factor 1.4. During 11.5
vs. 16.3 min of table time, lymphocytes in both groups
have the chance of being radiated more than one time.
The cumulative formation of gamma-H2AX foci can lead
to a false high result in evaluating dose distribution. In
order to attempt a correction towards real dose distribu-
tion in SSIMRT, one would expect even less cells
exposed to higher levels of dose. This correction would
amplify the differences between 3 D and SSIMRT, which
again correspond with the physical model.
StatementimplyinganabsolutedoseinGyusedfor
dosimetr y, cannot be rec ommended without doubts, due
to the following issues: in the DLH (Figure 4) higher lym-
phocyte-percentages are plotted, compared to the DVH
(Figure 5). The DLH s hows a radiation dose of 5% in 7-
9% of lymphocytes (DLH), whereas only about 5% of the
body volume receives the same dose (DVH). Doses of
above 100% can be observed in the DLH, too. This phe-
nomenon can be explained b y the possibility of repeated
dose exposure of some lymphocytes as explained above.
The linear correspondence between induction of
gH2AX foci and the delivered dose has already been ver-
ified and practiced especially for low doses [4,17].
Exceptions from this rule are described and due to dif-
ferent irradiation conditions or different kinds of ioniz-
ing irradiation [18].
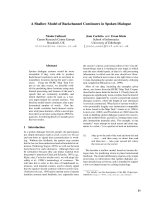
10μm
Figure 1 Merged DAPI and gamma-H2AX stains in human blood lymphocytes. Number of phosphorylated H2AX-foci corresponds with the
dose. Different doses are shown: 0.02, 0.1, 1 Gy and the non irradiated sample. Irradiation was performed homogeneously in-vitro on a linear
accelerator (Oncor, Siemens).
Zwicker et al . Radiation Oncology 2011, 6:62
/>Page 5 of 8
The visualization, which is shown for computed tomo-
graphy examinations of different sites (1), was now
extended to the doses of one fraction of radiotherapy
for different techniques.
Flow cytometry has also been performed in order to
measure delivered dose by gH2AX stain [16], however, in
our case it didn’t seem appropriate: The intensity of the
gamma-H2AX foci varied and could have led to errors
while measuring the background level of fluorescence. In
our opinion, a concrete number of foci per nucleus is
needed to compare dose distribution exactly.
Jucha et al. evaluated 2-dimentional pictures of the
stained lymphocytes using special software [19], but we set
great store by being able to zoom through the slide under
the microscope and looking at the complete 3-dimentional
nucleus in order to dete ct every gamma-H2AX foci. For
this reason in our experiments foci were counted manually
by eye with a fluorescence-microscope.
By creating a dose-lymphocyte histogram (DLH), the
gamma-H2AX staining method allows the estimation of
the dose distribution after irradiation. One possible
application of the present method could also be in
radiation-protection for in-vivo dosimetry after
dose (Gy)
0,0 0,5 1,0 1,5 2,0
mean induced
J
H2AX foci per nucleus
0
5
10
15
Proband 1
Proband 2
Proband 3
Proband 4
Proband 5
Regression
Figure 2 The calibration curve was set-up by irradiating blood
samples of five volunteers and is used to correlate the
delivered dose with the mean number of induced gamma-
H2AX foci per nucleus, scored 2 hours after irradiation.
Background foci levels were subtracted. Lymphocytes were
irradiated ex vivo at six different doses (0 - 2Gy) in three
independent measurements each (standard deviations are shown).
n = 20
+ RT control
mean number of gamma-H2AX foci per nucleus
0,0
0,2
0,4
0,6
0,8
3D
SSIMRT
Figure 3 The average of mean number of gamma-H2AX foci
per nucleus in irradiated lymphocytes and negative controls of
20 patients per group is shown (3D and SSIMRT). Standard
errors are shown. All patients were irradiated upon their prostate
region, whereas venous blood was taken before (control) and 10
minutes after their first irradiation fraction. Lymphocytes were fixed
2 h after the end of the irradiation. In the negative control 50
lymphocytes were analyzed per patient, while in the irradiated
samples, 300 lymphocytes were analyzed per patient.
DLH
dose (%)
0 20 40 60 80 100 120 140
rate of total lymphocytes (%)
0
2
4
6
8
3D
IMRT
Figure 4 Dose-lymphocyte -histogram (DLH) . In this integral
histogram, data of 20 patients per group (3D and SSIMRT) are
summarized in two curves. Standard errors are shown. The dose
initially was correlated with each number of gH2AX foci. Background
foci levels were subtracted. Referring to a previously generated
calibration line (Figure 2), the count of gH2AX foci leads to the
equivalent delivered dose for each lymphocyte. Each point contains
the mean relative sum of lymphocytes with at least the shown relative
dose (≥ x). 100% dose is equivalent to 2 Gy for 3D and 2.17 Gy for
SSIMRT. This causes the slight shift between the points of the curves.
Zwicker et al . Radiation Oncology 2011, 6:62
/>Page 6 of 8
accidental exposure to radiation. In case of accidental
irradiatio n, backg round foci level cannot be determined
and therefore cannot be subtracted in the DLH. In this
situation background f oci level should also not be sub-
tracted in the calibration line. In this manner the error
due to background foci level can be reduced, however
individual differences of background foci levels remain
unconsidered. Another possibility to deal with this lim-
itation is t o take blood for background foci level exami-
nation several weeks after the exposure, when the
circulating lymphocytes have been substituted naturally.
Conclusion
Measurement of gH2AX foci in patients’ lymphocytes
after prostate irradiation has been performed and dose
distribution within the lymphocytes shown. SSIMRT deli-
vers more doses below 20% and less between 30%-90%
than 3D. T his new biological in-vivo method confirmed
the reduction of medium-dose-exp osure for normal tis-
sue by SSIMRT. The relation between actually distribu-
ted dose (DVH) and distribution of gamma-H2AX foci in
lymphoc ytes (DLH) shows similarity but cannot be inter-
preted unrestrictedly due to the blood circulation.
Author details
1
Department of Radiation Oncology, University of Heidelberg, Heidelberg,
Germany.
2
Clinical Cooperation Unit Radiation Oncology, DKFZ, Heidelberg,
Germany.
Authors’ contributions
FZ conceived of the study, carried out patients’ mentoring and experiments
and drafted the manuscript. BS carried out the the gamma H2AX experiments
and helped to draft the manuscript. CT helped to draft the manuscript. FS,
GM, KW, PH and JD participated importantly in the conception of the study
and provided informatics and support with statistics for data analysis. KH
participated importantly in the conception and design and helped to draft
the manuscript. All authors read and approved the final manuscript.
Conflicts of Interests
The authors declare that they have no competing interests.
Received: 8 March 2011 Accepted: 7 June 2011 Published: 7 June 2011
References
1. Löbrich M, Rief N, Kühne M, Heckmann M, Fleckenstein J, Rübe C, Uder M:
In vivo formation and repair of DNA double-strand breaks after
computed tomography examinations. Proc Natl Acad Sci USA 2005,
102:8984-8989.
2. Rogakou EP, Pilch DR, Orr AH, Ivanova VS, Bonner WM: DNA double-
stranded breaks induce histone H2AX phosphorylation on serine 139.
J Biol Chem 1998, 273:5858-5868, 2.
3. Rogakou EP, Boon C, Redon C, Bonner WM: Megabase chromatin domains
involved in DNA double-strand breaks in vivo. J Cell Biol 1999,
146:905-916, 3.
4. Sak A, Grehl S, Erichsen P, Engelhard M, Grannass A, Levegrün S, Pöttgen C,
Groneberg M, Stuschke M: Gamma-H2AX foci formation in peripheral
blood lymphocytes of tumor patients after local radiotherapy to
different sites of the body: dependence on the dose-distribution,
irradiated site and time from start of treatment. Int J Radiat Biol 2007,
83:639-652, 4.
5. Rothkamm K, Löbrich M: Evidence for a lack of DNA double-strand break
repair in human cells exposed to very low x-ray doses. Proc Natl Acad Sci
USA 2003, 100:5057-5062.
6. Méndez-Acuña L, Di Tomaso MV, Palitti F, Martínez-López W: Histone post-
translational modifications in DNA damage response. Cytogenet Genome
Res 2010, 128:28-36.
7. Zwicker F, Ebert M, Huber PE, Debus J, Weber K: A specific inhibitor of
protein kinase CK2 delays gamma-H2Ax foci removal and reduces
clonogenic survival of irradiated mammalian cells. Radiat Oncol 2011,
6:15.
8. Kuefner MA, Grudzenski S, Schwab SA, Azoulay S, Heckmann M,
Heinrich MC, Lobrich M, Uder M: X-ray-induced DNA double-strand
breaks after angiographic examinations of different anatomic regions.
Röfo 2009, 181:374-380.
9. Vickery SR, Cureton KJ, Collins MA: Prediction of body density from
skinfolds in black and white young men. Hum Biol 1988, 60:135-149.
10. Kuefner MA, Grudzenski S, Hamann J, Achenbach S, Lell M, Anders K,
Schwab SA, Häberle L, Löbrich M, Uder M: Effect of CT scan protocols on
x-ray-induced DANN double strand breaks in blood lymphocytes of
patients undergoing coronary CT angiography. Eur Radiol 2010,
20:2917-2924.
11. MacPhail SH, Banáth JP, Yu TY, Chu EHM, Lambur H, Olive PL: Expression of
phosphorylated histone H2AX in cultured cell lines following exposure
to X-rays. Int J Radiat Biol 2003, 79:351-358.
12. Banáth JP, Macphail SH, Olive PL: Radiation sensitivity, H2AX
phosphorylation, and kinetics of repair of DNA strand breaks in
irradiated cervical cancer cell lines. Cancer Res 2004, 64:7144-7149.
13. Modesti M, Kanaar R: DNA repair: spot(light)s on chromatin. Curr Biol 2001,
11:229-232.
14. Olive PL, Banáth JP: Phosphorylation of histone H2AX as a measure of
radiosensitivity. Int J Radiat Oncol Biol Phys 2004, 58
:331-335.
15.
Olive PL, Banáth JP, Sinnott LT: Phosphorylated histone H2AX in
spheroids, tumors, and tissues of mice exposed to etoposide and 3-
amino-1,2,4-benzotriazine-1,3-dioxide. Cancer Res 2004, 64:5363-5369.
16. Andrievski A, Wilkins RC: The response of gamma-H2AX in human
lymphocytes and lymphocytes subsets measured in whole blood
cultures. Int J Radiat Biol 2009, 85:369-376.
17. Rothkamm K, Balroop S, Shekhdar J, Fernie P, Goh V: Leukocyte DNA
damage after multi-detector row CT: a quantitative biomarker of low-
level radiation exposure. Radiology 2007, 242:244-251.
Figure 5 Dose-v olume-histogram (DVH). Origin for this diagram
was the irradiation planning data of a smaller selected group of 3D-
and SSIMRT-prostate-patients from the main pool. Each curve of this
integral histogram contains 5 patients, each point contains the
volume irradiated with at least the shown relative dose (≥ x).
Standard deviations are shown.
Zwicker et al . Radiation Oncology 2011, 6:62
/>Page 7 of 8
18. Bells L, Werbrouck J, Thierens H: Dose response and repair kinetics of
gamma-H2AX foci induced by in vitro irradiation of whole blood and T-
lymphocytes with X- and gamma-radiation. Int J Radiat Biol 2010,
86(9):760-8.
19. Jucha A, Wegierek-Ciuk A, Koza Z, Lisowska H, Wojcik A, Wojewodzka M,
Lankoff A: FociCounter: A freely available PC programme for quantitative
and qualitative analysis of gamma-H2AX foci. Mutat Res 2010, 696:16-20.
doi:10.1186/1748-717X-6-62
Cite this article as: Zwicker et al.: Biological in-vivo measurement of dose
distribution in patients’ lymphocytes by gamma-H2AX
immunofluorescence staining: 3D conformal- vs. step-and-shoot IMRT of
the prostate gland. Radiation Oncology 2011 6:62.
Submit your next manuscript to BioMed Central
and take full advantage of:
• Convenient online submission
• Thorough peer review
• No space constraints or color figure charges
• Immediate publication on acceptance
• Inclusion in PubMed, CAS, Scopus and Google Scholar
• Research which is freely available for redistribution
Submit your manuscript at
www.biomedcentral.com/submit
Zwicker et al . Radiation Oncology 2011, 6:62
/>Page 8 of 8