Báo cáo khoa học: "Current measures of metabolic heterogeneity within cervical cancer do not predict disease outcome" ppsx
Bạn đang xem bản rút gọn của tài liệu. Xem và tải ngay bản đầy đủ của tài liệu tại đây (790.07 KB, 8 trang )
RESEARC H Open Access
Current measures of metabolic heterogeneity
within cervical cancer do not predict disease
outcome
Frank J Brooks
1,4*
and Perry W Grigsby
1,2,3
Abstract
Background: A previous study evaluated the intra-tumoral heterogeneity observed in the uptake of F-18
fluorodeoxyglucose (FDG) in pre-treatment positron emission tomography (PET) scans of cancers of the uterine
cervix as an indicator of disease outcome. This was done via a novel statistic which ostensibly measured the spatial
variations in intra-tumoral metabolic activity. In this work, we argue that statistic is intrinsically non-spatial, and that
the apparent delineation between unsuccessfully- and successfully-treated patient groups via that statistic is
spurious.
Methods: We first offer a straightforward mathematical demonstration of our argument. Next, we recapitulate an
assiduous re-analysis of the originally published data which was derived from FDG-PET imagery. Finally, we present
the results of a principal component analysis of FDG-PET images similar to those previously analyzed.
Results: We find that the previously published measure of intra-tumoral heterogeneity is intrinsically non-spatial,
and actually is only a surrogate for tumor volume. We also find that an optimized linear combination of more
canonical heterogeneity quantifiers does not predict disease outcome.
Conclusions: Current measures of intra-tumoral metabolic activity are not predictive of disease outcome as has
been claimed previously. The implications of this finding are: clinical categorization of patients based upon these
statistics is invalid; more sophisticated, and perhaps innately-geometric, quantifications of metabolic activity are
required for predicting disease outcome.
Background
It is believed that cancerous tumors are intrinsically het-
erogeneo us in many ways [1]. Experimentally quantified
properties that exhibit significant variation within
tumors include: gene expression [2], cell proliferation
rate [3], degree of vascularization [4], and hypoxia [3,5].
When properties of tumors are assayed via an imaging
technique such as positron emission tomography (PET ),
the question of quantifying biologically-functional het-
erogeneity becomes one of quantifying the spatial het-
erogeneity observed in grayscale images. In this case,
one describes the arrangement of the various pixel
intensities, with some arrangements subjectively appear-
ing more heterogeneous than others. For example, the
smooth gradation of a single bright spot to a darker
background is intuitively less heterogeneous than the
stark transitions seen by surrounding several clusters of
the brightest pixels with only the darkest pixels. The
goal of quantifying spatial heteroge neity is to objectively
calculate a single statistic that indicates one pattern is a
certain percentage more or less heterogeneous than
another.
Although the applications of such a statistic to medical
image processing and computational biology are broad,
we focus our attention on the study of metabolic hetero-
geneity observed within cancers of the uterine cervix. In
this case, cellular metabolism is assayed via the uptake of
F-18 fluorodeoxyglucose (FDG), a glucose analog with a
positron-emitting fluorine isotope [6]. Increased uptake
of FDG implies increased metabolism of glucose [7],
which is then indicated by an increased pixel intensity
in the grayscale PET image. Upon inspection of a
* Correspondence:
1
Department of Radiation Oncology, Washington University School of
Medicine, 4921 Parkview Place, Saint Louis MO 63110, USA
Full list of author information is available at the end of the article
Brooks and Grigsby Radiation Oncology 2011, 6:69
/>© 2011 Brooks and Grigsby; licensee BioMed Central Ltd. This is an Open Access article distributed under the terms of the Creative
Commons Attributio n Licen se (http ://creativecommons.org/licenses/by/2.0), which pe rmits unrestricted use, distribution, and
reproduction in any medium, provided the original work is properly cited.
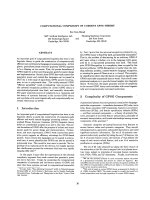
trans-axial, FDG-PET image of a typical cervical tumor
(Figure 1), one can readily observe distinct regions of very
bright pixel intensity near regions of lesser intensity, with
each type of region being wholly contained within the
bounds of the tumor. Since both the rat e of proliferation
[8] and the rate of healthy tissue invasion [7] are related to
the rate of cellular metabolism, the motivation to quantify
the observed variation in regional metabolism is obviou s.
One goal of such a study would be to investigate if this
metabolic heterogeneity alone could serve as an predictor
of disease outcome. Indeed, the major conclusion of pre-
cisely such a study is that intra-tumoral metabolic hetero-
geneity observed in pre-treatment cervical tumors predicts
response to therapy and risk of recurrence [9].
In this work, we re-analyze the identical FDG-PET-
derived data used in that previous study [9] and offer an
alternative interpret atio n. Specifically, we argue that the
novel measure employed in that work to quan tify spatial
heterogeneity of the grayscale PET images is intrinsically
independent of spatial arrangement, and indeed is a sur-
rogate for tumor volume. As such, it can offer no addi-
tional predictive capacity to that of tumor volume.
Thus, the delineation of patients into distinct groups of
post-treatment survival time via that he terogeneity mea-
sure is invalid. Additionally, we examine a similar data
set and demonstrate that fundamental, non-spatial mea-
sures of heterogeneity applied to the FDG-PET assay of
metabolic activity do not predict disease outcome.
Finally, we discuss some implications of these results.
Methods
Analysis of Previously Published Data
In this work, we first re-analyze the same data originally
analyzed in a previous heterogeneity-quantification
study [9]. We briefly recapitulate the details of that
prospective cohor t study here. Patients underwent a
pre-treatment, whole-body FDG-PET/CT scan. The
pathologic diagnosis and histology were determined by
pathologists at Washington University in St. Louis. All
patients were treated with concurrent chemotherapy
and radiation. A post-thera py FDG-PET/CT scan per-
formed three months after completing the radiation
treatment was used to evaluate the response to treat-
ment. For our re-analysis of the 73 total patients, the 14
with persistent disease were combined with the 9 exhi-
biting new metastases into a single group of those
having undergone unsuccessful treatment.
Segmentation of Additional FDG-PET Imagery
The first task of analyzing imaged tumors is to delineate
the tumors from the background (referred to as image
segmentation). In the case of FDG-PET, the radiophar-
maceutical is al so taken up and metabolized by noncan-
cerous cells, although to a lesser extent [10,11]. The
typical result is an evidently stronger PET signal
(tumor) surrounded by a weaker signal (non-tumor),
with the possibility of additional non-tumorous bright-
spots colocated with the bladder or rectum as undeliv-
ered radiopharmaceutical is cleared from the body [10].
As may be seen in Figure 1, the interface between the
healthy and tumorous regions may not be stark, but
rather nebulous as tumor cells invade healthy tissue in a
diffuse fashion [12]. This is seen in the image as a
smooth gradation from brighter pixels to dimmer ones.
In order to objectively distinguish tumor from back-
ground, we employed the rule-of-thumb that, for a
visually-selected, three-dimensional region of interest
(ROI), any pixel brighter than 40% of the maximum
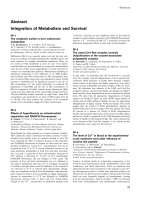
Figure 1 Heterogeneity in an FDG-PET image. A typical FDG-PET image of a cancer of the uterine cervix. The artificial boundary delineates
the region of activity above the 40% of maximum intensity threshold. The heterogeneity within the tumor is evidenced by the very bright
regions (higher metabolic activity) juxtaposed with relatively dark regions (lower metabolic activity). The undelineated bright spot to the right is
a lymph node and is thus not included in the main tumor volume. The vertical edge of this image represents a length of 10 cm.
Brooks and Grigsby Radiation Oncology 2011, 6:69
/>Page 2 of 8
ROI pixel brightness is to be considered part of the
tumor. This 40% rule is based upon the observation that
tumors defined as regions of greater than 40% of the
maximum standard uptake v alue (SUV) of FDG both:
colocate with those independently identified via visual
analysis of computed tomography scans; and yield
volumes consistent with published surgical series [13].
The SUV is a PET intensity measure that first has been
converted to proper radiation units, then corrected for
both radioactive decay and patient body mass [11]. For
each patient, the net result is that every grayscale image
pixel is multiplied by a single, positive constant. Because
we seek to quantify intra-tumoral variation and since
there is some debate as to the usefulness and validity of
standard uptake values [14,15], we a pply the 40% rule
directly to the grayscale intensities.
A computer program to semi-automate the image seg-
mentation process was written in Python v2.6.1 http://
www.python.org/. As is ubiquitous in the field, the raw
FDG-PET images are first processed through a white-
balance-correcting, back-projection algorithm via the
proprietary software native to the PET machine. The
resulting DICOM image files are imported into our pro-
gram via the pydicom library v0.9.3 gle.
com/p/pydicom/ and then converted to the 8-bit grays-
cale images via the Python Imaging Library v1.17 http://
www.pythonware.com/products/pil/. No additional
image preprocessing was implemented. Our program
enables the user to rapidly target a region of the whole-
body, trans-axial PET image set. Next, the program
appli es the 40% seg mentation rule t o all grayscale pixels
in the targeted region (e.g., the pelvic region). A flood-
fill algorithm is then applied to every pixel remaining in
that region in order to determine the inter-pixel connec-
tivity (or lack thereof). The result of this algorithm is a
set of distinctly-bounded, contiguous objects. The user
can then visually scan the objects and click to remove
those few that are obviously (for sound anatomical rea-
sons) not tumors. The typical end result is a 10 - 20
count stack of grayscale images representing trans-axial
slices of a clearly-bounded tumor.
Results
Theory
The original measure of heterogeneity presented in [9]
was derived f rom a volume versus threshold curve for
each tumor. In brief, a set of trans-axial image slices
comprise a virtual tumor object in three-dimensional
space. This obj ect was segmented at increasin gly high,
grayscale intensity thresholds and the volume recorded
at each threshold. The result of this process is a curve
likethetypicaloneshowninFigure2.Thesecurves
were then linearized by first restricting the domain of
the thresholding to be between 40 and 80 percent
(inclusively) of the image maximum. The lower bound
was chosen to guarantee that the tumor could be distin-
guished from the background (see Methods) and the
upper bound was chosen to exclude the relatively small
volumes represented by only the brightest pixels. The
remaining coordinates were fit to a line and the result-
ing slope was used as a measure of heterogeneity.
Greater magnitude of slope was interpreted to indicate
greater heterogeneity, although we now argue that this
is not the case.
Consider a perfectly homogeneous volume consisting of
only a single grayscale value. An example curve for such a
scenario is shown as the solid curve in Figure 3. As the
segmentation threshold is increased, no change is
observed in the volume until the threshold becomes
greater than the single value. Here, a virtually discontinu-
ous drop to zero volume occurs. Next, consider a hetero-
geneous object, having the same volume as in the previous
example, but with each of N > 1 grayscale values repre-
sented in equal number. In this case, the same chang e in
volume is spread over a greater threshold change. We
therefor e o bserve that as more grayscale values are use d,
heterogeneity increases and slope decreases. Because each
grayscale value is represented equally, the change in
volume for a given change in percent threshold is constant
(Figure 3 (dashed)). Therefore, a perfectly linear volume
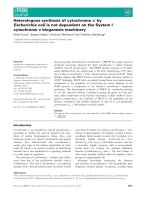
Figure 2 Volume versus Th reshold Curves.Atypicalvolume
versus threshold curve (dots) from the data described in [9]. The
tumor volume is defined to be those voxels with activity above 40%
of the maximum activity. The slope of the line (-0.37 cc/%) of best
fit between 40% and 80% was then used as a measure of intra-
tumoral heterogeneity. This is the slope which we now argue does
not predict disease outcome as was claimed in [9]. For reference,
the best-fit exponential curve is also shown (dashed).
Brooks and Grigsby Radiation Oncology 2011, 6:69
/>Page 3 of 8
versus threshold curve implies maximal heterogeneity over
multiple grayscale values.
Itisimportanttopointoutthatinthescheme
described above, the numeric value of the slope is inde-
pendent of spatial arrangement. For example, the set of
grayscale values r epresenting the tumor could be rear-
ranged such that each value resides at a new 3D Carte-
sian coordinate. In other words, it is possible to “draw”
various artificial objects by purposefull y placing selected
grayscale values at desired coordinates. However, the
number of each distinct grayscale value remains con-
stant, regardless of where in the object those values may
reside. Since the volume of t he tumor object ultimately
was calculated by counting pixels above a given thresh-
old, that volume does not change even when the tumor
object is destroyed via rearrangement. Thus, any mea-
sure of heterogeneity given by the slope is only of the
diversity of intensity values, not in spatial arrangement
of those values.
Critique of Previously Published Results
In a stack of trans-axial, FDG-PET images, a region of
interest fully containing the tumor is first selected by a
trained clinician. This is the region of interest that is
successively thresholded and the volume of the region
remaining after thresholding is computed. Let V
A
(T)=
V
A0
e
-lT
approximate a typical, observed volume (V)
versus percent threshold (T)curveforpatientA (see
Figure 2). At zero percent t hreshold, V
A
(0) = V
A0
,the
total volume of the initial target region. It is straightfor-
ward to show that the slope of the line between a mini-
mum, tumor-defining threshold T
m
and twice that
threshold(e.g,40%and80%)iss
A
=(V
A
(T
m
)/T
m
)·(V
A
(T
m
)/V
A0
- 1). We now wish to compare this slope
(ostensibl y a measure of heterogeneity) to that of a sec-
ond patient, B,whereV
B
(T)=V
B 0
e
- μT
.Fromthe73
available V (T) curves, we observed that, sa ve for extre-
mely large tumor volumes (greater than 150 cm
3
), the
total volume of tumor exhibiting pixel intensities greater
than 80% of the maximum observed intensity is typically
very small (≈3cm
3
). Thus, the end points of the lineari-
zation are approximately equal for every patient. There-
fore,
V
A
0
e
−λ2
T
m
≈ V
B
0
e
−μ2
T
m
, from which it is seen that
V
2
A
(T
m
)/V
A0
≈ V
2
B
(T
m
)/V
B
0
. P roceeding as before, and
employing this approximation, one may show that the
change in slope is Δs ≡ |s
A
- s
B
|=|V
B
(T
m
)-V
A
( T
m
)|/
T
m
≡ ΔV (T
m
)/T
m
. In w ords, the previously published
measure of intra-tumoral heterogeneity is directly pro-
portional to the pre-treatment tumor volume. It is
important to note that this result depends only upon
the measured 40% tumor volumes, and in no way
depends upon th e decay rate or closeness of fit of eith er
exponential curve.
The linear proportionality derived above is seen in the
original FDG-PET data. As described in [9], we plotted
the total volume (in cm
3
) of the target region with pixel
intensities greater than a given percent threshold versus
percent threshold. We then computed the least-squares
linear regression for points between 40% and 80%
thresholds. The magnitude of the slope is plotted versus
the tumor volume (i.e., that defined at 40% threshold) in
Figure 4. As predicted, it is clearly seen that the slope
magnitude is linearly proportional to tumor volume.
Therefore, the previously published delineation between
unsuccessfully- and succe ssfully-treated patient groups
is based exclusively upon tumor volume, not upon any
additional measure of heterogeneity. Larger volumes
intuitively imply long-duration, aggressive tumor pro-
gress. Thus, the simplest explanation of a statistically-
significant, predictive result (in [9]) is that the relatively
small number of patients with new or persistent cancer
tended to have larger pre-treatment tumor volumes. In
other words, t he apparent statistical significance is no
more than the expected artifact arising f rom the inap-
propriate use of the standardized permutation test
(p-test) upon groups with greatly differing numbers of
members.
An important c onsequence of the finding that Δs ∝
ΔV is that the slopes computed for similar volumes
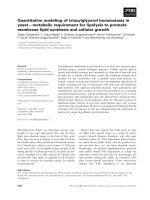
Figure 3 Schematic Heterogeneity Curves. The solid curve shows
the nearly discontinuous drop (large slope) that must occur for a
perfectly homogeneous volume of single activity level. The dashed
line shows the curve expected for a volume containing equal
numbers of each activity level possible. This heterogeneous scenario
has a decreased slope. Thus, increasing slope implies increasing
homogeneity. This is counter to the interpretation given in [9].
Brooks and Grigsby Radiation Oncology 2011, 6:69
/>Page 4 of 8
should themselves be similar, differing only by random
noise. To see this, we first detrended the slopes by
dividing each by the 40% tumor volume. This is identi-
cal to having first plotted the percent volume versus per-
cent threshold and computing the slope of the best-fit
line. The dimensionless, volume-detrended slopes were
pooled and then a histogram bin width of 0.1 was com-
puted via a commonly-used, optimal bin-width formula
[16]. The slopes were separated into d istinct groups
based upon aprioriknowledge of patient outcome. A
histogram of volume-detrended slopes was created for
each group and is shown in Figure 5. There, it is clearly
seen that the group which underwent successful treat-
ment (light shading) almost completely overlaps that
which underwent unsuccessful treatment (dark shading).
Each group differs from a single mean of 2.3 by the
same standard deviation, 0.13. This important observ a-
tion, that t he volume-detrended slopes are essentially
identical for every patient, implies that the previously
published measure of intra-tumoral heterogeneity is not
in any way predictive of disease outcome.
In an effort to verify this result, we studied the FDG-
PET imagery of 47 recently-examined patients that did
not appear in the previou sly published study. The
images were again obtained as described in [9] but
segmented as described in the Methods section. We
computed the volume-detrended slopes as before.
Again, we found no distinguishing capacity whatsoever
between the successfully treated patients, where the
mean slope is 2.20, and the unsuccessfully treated
patients where the mean slope is 2.23.
Extended Heterogeneity Analysis
Previous arguments imply that the volume versus
threshold slope is sensitive to the distribution of grays-
cale intensities of the trans-axial image stack. We there-
fore chose to investigate the relation between these
distributions and disease outcome via the fundamental
quantifiers of distributions: the standard deviation, skew-
ness and kurtosis. Each of these quantifiers describes a
unique quality of non-spatial heterogeneity. The stan-
dard deviation indicates the number of unique grayscale
values comprising the image stack; that is, the number
of different levels of metabolic activity observed. The
kurtosis indicates the relative streng th of those meta-
bolic levels since a distribution with only a single, sharp
peak (higher kurtosis) indicates a favored metabolic
activity level. The skewness indicates the pervasiveness
of activity levels. For example, an overall brighter distri-
bution (negatively skewed) im plies that t he majority of
tumor volume exhibits relatively higher metabolic
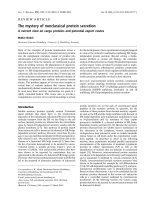
Figure 4 A Volume Surrogate. A previously published measure of
intra-tumoral heterogeneity is plotted versus tumor volume for
patients who underwent successful (circles) or unsuccessful
(triangles) therapy. Observe that the heterogeneity measure is
directly proportional to volume and there is a lack of clustering of
patients into distinct groups with differing disease outcome. As
seen in the inset, the trend persists over three orders of magnitude.
The inset axes have the same units as in the primary plot.
Figure 5 No Predictive Value. Histograms of the volume-
detrended slopes for patients who underwent successful (light
shading) or unsuccessful (dark shading) therapy. The overlapping
histograms indicate that the ostensible measure of distinguishing
intra-tumoral heterogeneities actually has the same mean value for
every patient, differing only by random noise, and thus does not
predict disease outcome.
Brooks and Grigsby Radiation Oncology 2011, 6:69
/>Page 5 of 8
activity whereas a skewness of zero indicates equal
volumes of activities above and below the mean activity.
Since each of the fundamental quantifiers describing
the distribution of FDG-PET intensities represents an
independent, biological aspect of the tumor, it seems
reasonable to us that they are members of a basis set of
heterogen eity-desc ribing statistics. In other words, we
suggest that any feasible non-spatial indicator of heter o-
geneity would have to in some way depend upon the
standard deviation, skewness and k urtosis. We com-
puted these quantifiers for the 8-bit grayscale intensity
distributions for each of the 47 recently-examined
patients. We then constructed a three-dimensional
phase space where each patient is represented by a
point having a standard deviation, skewness and kurtosis
coordinate. Each point in that space is then given a
unique symbol corresponding to patient outcome after
chemoradiotherapy with curative intent. In Figure 6, it
is seen that the patients free of cancer after therapy (cir-
cles) are well-mixed with those for whom therapy was
unsuccessful (triangles), and no obvious clustering of
the patient groups is apparent. To explore whether any
predictive information ca n be obtaine d from the non-
spatial metabolic activity quantifiers, we performed a
principal component analysis. The standard deviation,
skewness, and kurtosis for each of 47 pat ients comprise
the rows of the 3 × 47 matrix of observations. As is
described in many textbooks [17], we then compute the
unit-magnitude eigenvectors of the mean-detrended
covariance matrix to obtain the single variable repre-
senting the maximal use of information within the initial
variabl es. We found that a new variable, ψ = 0.9 99 stan-
dard deviation - 0.010 skewness - 0.033 · kurtosis, best
described the variation in phase space. Since the disease
outcomes are k nown, we computed the value of ψ for
each patient and performed a standardized permutation
test of significance (p-test). The mean values of ψ for
patients undergoing successful or unsuccessful treat-
ment are 30.4 (p = 0.36) and 28.8 (p = 0.24), respec-
tively. The two-sided p-values given here indicate that
our default assumption that the mean of one group
equals the mean of the other cannot be rejected. In
other words, these relatively large p-values are consis-
tent with our earlier observation (seen in Figure 6) that
there is no substantial difference between the values of
ψ for each treatment group. Thus, our conclusion is
that the optimal linear combination of the non-spatial
metabolic quantifiers does not predict disease outcome
any better than random chance.
From the corresponding eigenvalues, we compute that
≈98% of the total variation in phase space is represented
by the standard deviation alone. This hi gh percentage
indicates that more sophisticated, non-s patial measures
of heterogeneity–which we assert ultimately are based
upon the fundamental quantifiers–are unlikely to
improve upon the standard measure of uncertainty. In
other words, the standard deviation alone is a reason-
able non-spatial measure of the variation in metabolic
activity. Thus, we suggest that the textbook usage of the
standard deviation as the uncertainty in the mean value
is adequate when computing statistics, such as the total
glycolytic volume, which are spatially averaged over the
entire tumor volume.
A potential concern lies in our definition of patient
groups, where the unsuccessfully treated group is the
union of those patients having post-treatment persistent
cancer with those having post-treatment new metas-
tases. In an effort to avoid any bias due to pre-existing
metastases, we performed both the re-analysis of exist-
ing data as well as our entire principal component ana-
lysis again. We first eliminated those with new
metastases from the unsuccessfully treated group. We
then computed the volume-detrended slopes described
earlier and again found that mean value for the success-
fully treated group (2.28) is nearly identical to that
(2.32) of the unsuccessfully treated group. Thus, bias
due to inclusion of patients with new metastases does
not explain the lack of predictive capacity of the pre-
viously published measure of heterogeneity. We now
explore the potential effect of this bias in our principal
component analysis. Proceeding as before, we compute
anewψ variable for the truncated matrix of o bserva-
tions, excluding patients with new metastases. The
Figure 6 Quantifier phasespace. A phase space of intuitive, non-
spatial quantifiers of heterogeneity is shown. Each point has a
standard deviation, skewness and kurtosis coordinate. As is evident
in the plot, and confirmed via principal component analysis, there is
no delineation between patients who underwent successful (circles)
or unsuccessful (triangles) radiotherapy.
Brooks and Grigsby Radiation Oncology 2011, 6:69
/>Page 6 of 8
mean values of ψ for patients undergoing successful or
unsuccessful treatment are then 30.4 (p = 0.51) and 31.7
(p = 0.38), respectively. We again see no substantive dif-
ference between the mean values for each group and
thus conclude that patients with new metastases did not
bias our previous result that non-spatial metabolic quan-
tifiers do not predict disease outcome.
Discussion
It is important that we immediately point out that we
are not claiming that intra-tumoral metabolic heteroge-
neity does not exist. Indeed, we presume that metabolic
activity can vary significantly throughout a tumor. In a
younger, pre-vascularized tumor, such variations are
likely due to a non-constant, diffusion-limited nutrient
density [18]. In a mature tumor, these variations could
be due to necrosis [18] or even steric constraints
imposed by the spatially-randomized, densely-packed
nature of newly-formed vascularization networks [19].
Inordertomeasureagenuineheterogeneityinastack
of images, o ne must be able to distinguish a single
volume element (voxel) from another. The minimum
detectable inter-voxel difference is determined by t he
noise intrinsic to the FDG-PET assay. The noise in a
typical 3D FDG-PET image reconstructed via filtered
back-projection has been estimated to be 1.5 kBq/mL
[20]. This is only 3% of the ≈50 kBq/mL mean activity
of all tumor voxels defined above 40% intensity thresh-
old in our extended heterogeneity study. This implies
that the FDG-PET assay can distinguish relatively small
changes in the metabolism of tumor cells averag ed over
a typical PET image voxel. We therefore conclude that
the non-predictive nature of bulk heterogeneity statistics
is not due to eithe r a genuine lack of variation in meta-
bolic activity or the poor resolution of this variation.
Instead, our results imply that that quantification of
tumor composition via FDG-PET remains a challenging,
open problem to b e solved. We maintain that a shift of
focus from tumor compo sition to shape and location
offers immediate potential for improved clinical therapy.
Consider that the uncertainty in the anatomical place-
ment of brachytherapy radiation sources via a standard
gynecological implant is at least several millimeters.
This is the same order of spatial uncertainty in FDG-
PET-assayed tumors where the side length of a cubical
voxel is typically ≈4 mm. Also, as the computation of
radiation fields is rapidly becoming more accurate and
more computationally-accessible [21], it is feasible that
more precise, geome tric quantification of metabolic var-
iations will directly yield more effective treatment plans.
For example, it could be the case that tumors of a parti-
cular shape or asymmetry are indicative of disease out-
come [22,23]. These geometric qualities can be
quantified readily via the well-known techniques
common to image texture analysis [24] or the physics of
particle systems [25].
Conclusions
We have shown that neither the currently accepted
measure, nor other reasonable non-spatial m easures, of
intra-tumoral metabolic heterogeneity within cervical
cancer are predictive of disease outcome. This is directly
counter to a previously published claim. We have given
a brief mathematical explanation of why that claim is
erroneous and have supported our argument with the
results of both a re-analysis of the originally published
data and a fundamental statistical analysis of a similar
data set. Our findings have immediate impact upon clin-
ical research and treatment. The use of currently-
accepted, non-spatial quantifiers of intra-tumoral meta-
bolic heterogeneity as a means to categorize patients
into groups predicted to be successfully or unsuccess-
fully treated is invalid. Thus, more sophisticated, and
perhaps innately-geometric, quantifications of metabolic
activity are required for predicting disease outcome.
Acknowledgements
We would like to thank Scott Brame and Bruce Davis for illuminating
discussions and the latter for carefully reviewing the manuscript. This work
was supported by the National Institutes of Health under Grant 1R01-
CA136931-01A2.
Author details
1
Department of Radiation Oncology, Washington University School of
Medicine, 4921 Parkview Place, Saint Louis MO 63110, USA.
2
Division of
Nuclear Medicine, Mallinckrodt Institute of Radiology, Medical Center, Saint
Louis MO, USA.
3
Department of Obstetrics and Gynecology, Washington
University Medical Center, Saint Louis MO, USA.
4
Alvin J. Siteman Cancer
Center, Washington University Medical Center, Saint Louis MO, USA.
Authors’ contributions
FJB conceived and drafted the manuscript as well as performed all
mathematical analyses. PWG designed the protocol for the interpretation the
FDG-PET images, acquired the volumetric data presented, and provided
crucial medical and anatomical insight into the analyzed data and imagery.
Both FJB and PWG read and approved the final manuscript.
Competing interests
Frank J. Brooks has no conflicts of interests. Perry W. Grigsby has no conflicts
of interests.
Received: 7 December 2010 Accepted: 9 June 2011
Published: 9 June 2011
References
1. Heppner GH: Tumor heterogeneity. Cancer Res 1984, 44(6):2259-65.
2. Zhao S, Kuge Y, Mochizuki T, Takahashi T, Nakada K, Sato M, Takei T,
Tamaki N: Biologic correlates of intratumoral heterogeneity in 18F-FDG
distribution with regional expression of glucose transporters and
hexokinase-II in experimental tumor. J Nucl Med 2005, 46(4):675-82.
3. Pugachev A, Ruan S, Carlin S, Larson SM, Campa J, Ling CC, Humm JL:
Dependence of FDG uptake on tumor microenvironment. Int J Radiat
Oncol Biol Phys 2005, 62(2):545-53.
4. Révész L, Siracka E, Siracky J, Delides G, Pavlaki K: Variation of vascular
density within and between tumors of the uterine cervix and its
predictive value for radiotherapy. Int J Radiat Oncol Biol Phys 1989,
16(5):1161-3.
Brooks and Grigsby Radiation Oncology 2011, 6:69
/>Page 7 of 8
5. Picchio M, Beck R, Haubner R, Seidl S, Machulla HJ, Johnson TD, Wester HJ,
Reischl G, Schwaiger M, Piert M: Intratumoral spatial distribution of
hypoxia and angiogenesis assessed by 18F-FAZA and 125I-Gluco-RGD
autoradiography. J Nucl Med 2008, 49(4):597-605.
6. Bailey DL: Positron emission tomography: basic sciences New York: Springer;
2005.
7. Gatenby RA, Gillies RJ: Why do cancers have high aerobic glycolysis? Nat
Rev Cancer 2004, 4(11):891-9.
8. Vander Heiden MG, Cantley LC, Thompson CB: Understanding the
Warburg effect: the metabolic requirements of cell proliferation. Science
2009, 324(5930):1029-33.
9. Kidd EA, Grigsby PW: Intratumoral metabolic heterogeneity of cervical
cancer. Clin Cancer Res 2008, 14(16):5236-41.
10. Cook GJR: Artefacts and Normal Variants in Whole-Body PET and PET/CT
Imaging. In Positron emission tomography: basic sciences 1 edition. Edited
by: Bailey ea Dale L. Springer; 2005:281-293.
11. Wahl RL: Standardized Uptake Values. In Principles and Practice of PET and
PET/CT 2 edition. Edited by: Wahl RL. Wolters Kluwer Health; 2009:.
12. Weinberg RA: The biology of cancer New York: Garland Science; 2007.
13. Miller TR, Grigsby PW: Measurement of tumor volume by PET to evaluate
prognosis in patients with advanced cervical cancer treated by radiation
therapy. Int J Radiat Oncol Biol Phys 2002, 53(2):353-9.
14. Keyes JW Jr: SUV: standard uptake or silly useless value? J Nucl Med 1995,
36(10):1836-9.
15. Paulino A, Johnstone P: Does SUV stand for silly useless value? Int J
Radiat Oncol Biol Phys 2004, 60(3):1006.
16. Izenman AJ: Recent developments in nonparametric density-estimation.
Journal of the American Statistical Association 1991, 86(413):205-224.
17. Lay DC: Linear algebra and it’s applications. 3 edition. Boston: Pearson/
Addison-Wesley; 2006.
18. Gerlee P, Anderson ARA: Evolution of cell motility in an individual-based
model of tumour growth. J Theor Biol 2009, 259:67-83.
19. Jain RK: Molecular regulation of vessel maturation. Nat Med 2003,
9(6):685-93.
20. Schmidtlein CR, Beattie BJ, Bailey DL, Akhurst TJ, Wang W, Gönen M,
Kirov AS, Humm JL: Using an external gating signal to estimate noise in
PET with an emphasis on tracer avid tumors. Phys Med Biol 2010,
55(20)
:6299-326.
21. Thomadsen BR, Williamson JF, Rivard MJ, Meigooni AS: Anniversary paper:
past and current issues, and trends in brachytherapy physics. Med Phys
2008, 35(10):4708-23.
22. O’Sullivan F, Roy S, O’Sullivan J, Vernon C, Eary J: Incorporation of tumor
shape into an assessment of spatial heterogeneity for human sarcomas
imaged with FDG-PET. Biostatistics 2005, 6(2):293-301.
23. Mayr NA, Yuh WTC, Taoka T, Wang JZ, Wu DH, Montebello JF, Meeks SL,
Paulino AC, Magnotta VA, Adli M, Sorosky JI, Knopp MV, Buatti JM: Serial
therapy-induced changes in tumor shape in cervical cancer and their
impact on assessing tumor volume and treatment response. AJR Am J
Roentgenol 2006, 187:65-72.
24. Jähne B: Digital image processing. 6th rev. and ext edition. Berlin: Springer;
2005.
25. Arfken GB, Weber HJ: Mathematical methods for physicists. 6 edition. Boston:
Elsevier; 2005.
doi:10.1186/1748-717X-6-69
Cite this article as: Brooks and Grigsby: Current measures of metabolic
heterogeneity within cervical cancer do not predict disease outcome.
Radiation Oncology 2011 6:69.
Submit your next manuscript to BioMed Central
and take full advantage of:
• Convenient online submission
• Thorough peer review
• No space constraints or color figure charges
• Immediate publication on acceptance
• Inclusion in PubMed, CAS, Scopus and Google Scholar
• Research which is freely available for redistribution
Submit your manuscript at
www.biomedcentral.com/submit
Brooks and Grigsby Radiation Oncology 2011, 6:69
/>Page 8 of 8