Báo cáo khoa học: "The evolution of rectal and urinary toxicity and immune response in prostate cancer patients treated with two three-dimensional conformal radiotherapy techniques" ppt
Bạn đang xem bản rút gọn của tài liệu. Xem và tải ngay bản đầy đủ của tài liệu tại đây (450.57 KB, 13 trang )
RESEARCH Open Access
The evolution of rectal and urinary toxicity and
immune response in prostate cancer patients
treated with two three-dimensional conformal
radiotherapy techniques
Jana Vranova
1,4
, Stepan Vinakurau
2
, Jan Richter
3
, Miroslav Starec
1
, Anna Fiserova
3*
and Jozef Rosina
4,1
Abstract
Background: Our research compared whole pelvic (WP) and prostate-only (PO) 3-dimensional conformal
radiotherapy (3DCRT) techniques in terms of the incidence and evolution of acute and late toxicity of the rectum
and urinary bladder, and identified the PTV-parameters influencing these damag es and changes in antitumor
immune response.
Methods: We analyzed 197 prostate cancer patients undergoi ng 3DCRT for gastrointestinal (GI) and genitourinary
(GU) toxicities, and conducted a pilot immunological study including flow cytometry and an NK cell cytotoxicity
assay. Acute and late toxicities were recorded according to the RTOG and the LENT-SOMA scales, respectively.
Univariate and multivariate analyses were conducted for factors associated with toxicity.
Results: In the WP group, an increase of acute rectal toxicity was observed. A higher incidence of late GI/GU
toxicity appeared in the PO group. Only 18 patients (WP-7.76% and PO-11.11%) suffered severe late GI toxicity, and
26 patients (WP-11.21% and PO-16.05%) severe late GU toxicity. In the majority of acute toxicity suffering patients,
the diminution of late GI/GU toxicity to grade 1 or to no toxicity after radiotherapy was observed. The 3DCRT
technique itself, patient age, T stage of TNM classification, surgical intervention, and some dose-volume parameters
emerged as important factors in the probability of developing acute and late GI/GU toxicity. The proportion and
differentiation of NK cel ls positively correlated during 3DCRT and negatively so after its completion with dose-
volumes of the rectum and urinary bladder. T and NKT cells were down-regulated throughout the whole period.
We found a negative correlation between leukocyte numbers and bone marrow irradiated by 44-54 Gy and a
positive one for NK cell proportion and doses of 5-25 Gy. The acute GU, late GU, and GI toxicities up-regulated the
T cell (CTL) numbers and NK cytotoxicity.
Conclusion: Our study demonstrates the association of acute and late damage of the urinary bladder and rectum,
with clinical and treatment related factors. The 3DCRT itself does not induce the late GI or GU toxicity and rather
reduces the risk of transition from acute to late toxicity. We have described for the first time the correlation
between organs at risk, dose-volume parameters, and the immunological profile.
Keywords: 3-dimensional conformal radiotherapy (3DCRT), gastrointestinal and genitourinary toxic ity, prostate can-
cer, NK cells, PTV parameters, pelvic bone marrow
* Correspondence:
3
Department of Immunology and Gnotobiology, Institute of Microbiology,
Academy of Sciences of the Czech Republic, v.v.i., Prague, Czech Republic
Full list of author information is available at the end of the article
Vranova et al. Radiation Oncology 2011, 6:87
/>© 2011 Vranova et al; licensee BioMed Central Ltd. This is an Open Access article distributed under the terms of the Creative Commons
Attribution License ( y/2.0), which permits unrestricted use, distribution, and reproduction in
any medium, provided the original work is properly cited.
Background
Quality of life is becoming one of the most significant
issues in treatment decision-making, in general, and
more so in prostate cancer [1]. Thus late rectal and
urinary damage became a major concern in prostate
cancer; and many studies have been dedicated to the
search for correlations between dose-volume, treatment-
related factors, and late GI and GU toxicities [2-7].
Three-dimensional conformal radiotherapy (3DCRT)
represents one of the standard treatments of prostate
cancer allowing the delivery of highly “ conformed”
(focused) radiation to the cancer cells, while significantly
reducing the amount of radiation received by surround-
ing healthy ti ssue. 3DCRT should increase the rate of
tumor control, while also decreasing side effects. In
spite of this focus, a higher dose to the prostate implies
that the surrounding organs at risk (OARs) may also
receive higher doses.
In addition, local radiation therapy (RT) alters the bal-
ance of circulating immune cells by the depletion of radio-
sensitive cell subsets [8]. Recently, radiation-induced
functional changes in immune cells raised interest, sug-
gesting the possible use of radiation as an antitumor
immune response enhancer. Irradiation can induce leuko-
penia due to apoptosis of various leukocyte subpopula-
tions. The acute exposure to low- and high-dose
irradiation in mouse models changes the quantitative and
functional parameters of immune cells, due to different
sensitivity of splenocyte subsets to radiation doses [9].
Similar effect wa s describe d in vitro for cervical cancer
patients [10]. Tabi et al. reported a prevalent loss of naive
and early memory cells vs. more differentiated T cells in
peripheral blood of patients during RT to the pelvis [11].
The release of the heat shock protein 72 (HSP72) during
RT increased the cytotoxic CTL and NK cells [12]. Some
pathological changes can be caused by the apoptosis of
bone marrow (BM) stem cells and BM stromal damage
[13]. Radiation-induced BM injury depends on both the
radiation dose and the volume of BM irradiated [14].
We performed a prospective 4-year study, enrolling
prostate cancer patients t o elucidate whether the risk
level of acute and particularly late rectal and urinary
toxicities caused by 3DCRT techniques (whole pelvic
(WP) and prostate-only (PO)), are at an acceptable level.
This study reports our 42-month follow-up results, and
evaluates t he relationships between pretreatment, acute
and l ate rectal and urinary syndromes and tumor-,
patient- and treatment-related factors. In the last 3 years
of the study, we investigated the influence of 3DCRT
techniques, as well as the GI and GU toxicity on
select ed patient immune parameters, with special regard
to the cells involved in antitumor immunity (natural
killer-NK, NKT, and T).
Methods
Patients and clinical protocol
Data for the study were collected from 245 consecutive
patients with Stage T1 to T3 clinically localized prostate
adenocarcinoma, treated with 3DCRT (2004-2009) at
the Department of Radiotherapy and Oncology, M otol
University Hospital, Prague, Czech Republic. 48 patients
with follow-up shorter than 24 months were excluded
from th e study. The study population thus consisted of
197 patients. Patients according to their health and
lymph nodal status (classified by Prostate cancer staging
nomograms-Partin tables) [15] were di vided into two
groups: those who underwent whole pelvic (WP) radio-
therapy-irradiation of prostate, seminal vesicles, and
lymph nodes followed by a prostate boost (116 patients,
59%); and prostate-only (PO) radiotherap y-irradiation of
prostate and seminal vesicles (81 patients, 41%). Follow-
up evaluations after treatment were performed at 3 to 6
month intervals. The median follow-up was 42 months,
ranging from 24 to 55 months. Main patient characteris-
tics and main disorders are summarized in Table 1.
Acute and late GI and GU toxicities were studied in
order to i dentify the treatment-related, clinical and
patient characteristics that correlated with the severity
of complications and disorders. Acute reactions included
those arising during treatment or within 90 days after
RT completion. Late complicati ons were defined as
those developing more than 90 days after the last treat-
ment. Acute and late toxicities were scored according to
RTOG and LENT-SOMA morbidity scale (grades 1-5).
Into the category of low toxicities were encompassed
the patients without the need of pharmacological inter-
vention (grade 1), while the serious toxicity (grade ≥ 2)
was under medication. In 37 cases (WP: n = 16; PO: n
= 21) the immune response before treatment, during
3DCRT (day 14), and 15-20 days after treatment com-
pletion was evaluated. The protoc ol was approved by
the local board ethics committee; and written informed
consent was obtained from all patients.
Irradiation technique, target volume and critical normal
structure definition
Treatment planning and irradiation were performed
with the patients in supine position (using knee and
ankle supports) with an emptied rectum and “comforta-
bly full” bladder filling. 3D conformal treatment plan-
ning based on CT images with 5 mm thickness,
involved delineation of CTVs, PTVs and organs at risk,
accordingtoICRU50and62recommendations.The
plans, using MLC to shape beams, were calculated on
Eclipse treatment planning system. Box technique or
four wedged field technique (two lateral and two oblique
fields at angles of 90°, 270 °, 30° and 330°) was used. The
Vranova et al. Radiation Oncology 2011, 6:87
/>Page 2 of 13
dose was normalized to the ICRU reference point,
located in the central part of the PTV or near the cen-
tral axis of the beam intersection, according to ICRU
50. Dose homogeneity was between 95% and 107% of
the ICRU reference dose. Dose-volume histograms were
used for evaluation of doses to target volumes and
organs at risk. DRRs were generated for all treatment
beams and for two extra setup be ams from the antero-
posterior (AP) and the lateral directions (LAT).
Before the radiot herapy, the treatment plans were
simulated on a convention al simulator (Ximatron and
Acuity
®
, Varian Medical Sy stems). The isocenter was
marked on the patient’s skin. Patients were irradiated on
a Clinac 2100 C/D (Varian) e quipped with Millenium
MLC-120 with beams of 18 MV or 6 MV. The dose was
delivered in daily fractions of 1.8 Gy to the pelvis and of
2 Gy to the prostate and seminal vesicles, in given per-
iod five sessions per week. In the treatment room, the
patients were aligned on a carbon-fiber couch panel
within their immobilization device using the skin marks.
Before the therapy, patient set-up was checked using
electronic portal imaging (PortalVision PV-aS500
®
).
Simulator images of setup fields were used as reference
images for matching with portal images. Planning target
volume (PTV) of the prostate (PTV3) was the entire
organ (clinical target volume of prostate-CTV3), and
PTV2 was the entire prostate and seminal vesicles
(CTV2). Both PTVs were enlarged by 1.5 cm margin,
except f or the prostate-rectum interface where a 1 cm
margin was again used to decrease the risk of rectal
toxicity. PTV1 in the WP Group was only the CTV of
lymph nodes (LNs). LNs were defined according to
RTOG recommendations (treatment of only subaortic
presacral LNs, contours of common iliac vessels starting
at the L5/S1 interspace, external iliac contours stopping
at the top of femoral heads, and contours of obturator
LNs stopping at the top of the symphysis pubis) plus a
1 cm margin.
Patients from the PO group received a dose of 60 Gy
in 30 fractions to the PTV2. Then the PTV3 received
the presc ribed dose of 10-18 Gy in 5-9 frac tions.
Patients from the WP group received a dose of 45 Gy in
25fractionstothePTV1,thenadoseof20Gyin10
fractions to the PTV2. Finally the PTV3 received the
prescribed dose 6-10 Gy in 3-5fractions.Dosevolume
histograms (DVH) were generated for all PTVs and
OARs. The OARs included the bladder, rectum, bone
marrow, and femoral head.
Pelvic bone marrow definition
For each patient, the pelvic bone marrow (PBM) volume
was first defined according to the method described by
Mell et al. [16]. The external contour of the PBM was
delineated on the planning CT using bone windows.
Three sub sites were defined: 1) ilia c BM (IBM), extend-
ing from t he iliac crests to the superior border of the
femoral head; 2) lower pelvis (LP), consisting of the
pubes, ischia, acetabula, and proximal femora, extending
from the superior border of the femoral heads to the
infer ior border o f the ischial tuberosities; and 3) lumbo-
sacral spine (LS), extending from the superior b order of
Table 1 Patient characteristics
Characteristics WP (n = 116) PO (n = 81)
Age
Median 73 74
Range 57-100 57-92
Mean ± SD 72.93 ± 8.55 74.88 ± 7.79
TNM Stage
T0 1 (0.86%) -
T1 6 (5.17%) 22 (27.16%)
T2 34 (29.31%) 30 (37.04%)
T3 62 (53.44%) 15 (18.52%)
T4 4 (3.45%) 1 (1.24%)
Metastases 2 (1.72%) -
Gleason score
Median 7 5
Range 2-9 3-10
Initial PSA [ng/mL]
Median 19 10
Range 2-133 1-97
Mean ± SD 31.00 ± 8.67 12.46 ± 2.34
ADT 93 (80.07%) 33 (40.74%)
Previous surgery
RP 23 (19.83%) 22 (27.16%)
TURP 7 (6.03%) 5 (6.17%)
Therapy duration (m)
Median 57 54
Range 33-81 22-80
Mean ± SD 57.50 ± 5.56 54.04 ± 7.03
Recurrence Risk*
Low 1 (0.86%) 19 (23.46%)
Intermediate 20 (17.24%) 38 (46.91%)
High 94 (81.03%) 23 (28.40%)
Prescription dose (Gy)
≤ 71 60 (51.72%) 6 (7.41%)
72, 73 53 (45.69%) 72 (88.89%)
≥ 74 3 (2.59%) 3 (3.70%)
Disorders
Without complications 49 (42.24%) 37 (45.86%)
Cystoureteritis 16 (13.79%) 15 (18.52%)
Cystoureteritis + diarrhea 15 (12.93%) 1 (1.23%)
Proctocolitis + diarrhea 28 (24.14%) 14 (17.28%)
Unknown 8 (6.69%) 14 (17.28%)
*Recurrence risk was determined according to Canadian Consensus (Lukka
2002): low risk (T1-2a, Gleason ≤ 6, PSA < 10 ng/mL), intermediate risk (T2b-
2c, Gleason = 7, PSA 10-20 ng/mL), high risk (T3-4, Gleason ≥ 8, PSA > 20 ng/
mL)
Vranova et al. Radiation Oncology 2011, 6:87
/>Page 3 of 13
the L5 vertebral body to the coccyx, but not extending
below t he superior border o f the femoral head. To find
the association of local radiation doses and changes in
the number of leukocytes among patients with different
body sizes, the percentage of BM irradiated volume at
different doses was used as a first approximation.
Cell separation for immunological evaluations
Citrate d blood samples from patien ts were separated by
Ficoll-Hypaque 1,077 (Sigma-Aldrich, St. Louis, MO,
USA) density centrifugation for 40 min to obtain the
peripheral blood mononuclear cell (PBMC) fraction.
Flow cytometry
The fluorochrome-conjugated antibodies CD3-Pacific
Blue (UCHT1), CD4-APC-Alexa Fluor 750 (S3.5), CD8-
Pacific Orange (3B5) CD19-Pacific Blue (HD37), CD20-
PE-Cy7 (2H7), CD38-PerCP-Cy5.5 (HIT2), and CD56-
APC (MEM-188), were obtained from Dako (Glostrup,
Denmark), Exbio (Prague, Czech Republic), BD Bios-
ciences (Franklin Lakes, NJ, USA), and e-Bioscience
(San Diego, CA, USA). PBMCs (5 × 10
5
cell s/well) were
stained with the antibody mixture for 30 min on ice,
washed, and measured with a Becton Dickinson LSRII
instrument (BD Biosciences). We i ncluded single-stain
controls for further offline compensation . Measurement
and subsequent analysis was performed using FACSDiva
(BD Biosciences) and TreeStar FlowJo 8 (Ashland, OR,
USA) software, respectively.
NK cell-mediated cytotoxicity
The standard
51
Cr-release assay was performed with
PBMCs from patients as effectors and the NK cell-sensi-
tive K562 erythroleukemia cell line as targets. PBMC
(1.6 × 10
5
cells/well) were incubated with 10
4
Na
2
51
CrO
4
-labeled target cells in round-bottomed 96-
well microtitre plates (NUNC) at 37°C, in a humidified
atmosphere containing 5% CO
2
. NK cell activity was
evaluated after 4 hr of incubation, and calculated as
described previously [17].
Statistical analysis
We investigated all GI and GU toxicities (late and acute)
separately. There were only 3 cases of grade 3 acute GI
toxicity, only 5 cases of grade 3 acute GU toxicity, and
none of grade 4 or 5. Similar observation was made for
late GI toxicity (only 5 cases of grade 3, 1 of grade 4, and
no instances of grade 5) and for late GU toxicity (only 13
patients of grade 3 and none of grade 4 or 5). As a conse-
quence, we grouped the toxicity levels of all diagnosed
toxicities (acute GI, acute GU, late GI, and late GU) in
two categories and analyzed the binary response. The
grouping of responses considered was: high toxicity
(grade 2-3) vs. low or no toxicity (grades 1 or 0).
The grouped data were analyzed using m ultivariate
logistic regression models. The list of predictive factors
was the same for acute and late toxicities; except for the
addition of acute toxicity, as the next predictive factor
of late OAR damage. The patient-, tumor-, a nd treat-
ment-related factors were as follows: 3DCRT technique
used (WP vs. PO); volumes of r ectum and urinary blad-
der; minimum, maximum, and mean dose received by
the rectum and urinary bladder (D
min
,D
max
,D
mean
);
percentage of rectum and urinary bladder volume
receiving 40 Gy, 50 Gy, 60 Gy, and 70 Gy, respectively;
patient age; stage T of TNM classification; initial PSA;
Gleason score; androgen dep rivation therapy (ADT)
added to RT (yes/no); surgical intervention (None/
Transurethral resection/Radical prostatectomy) of the
prostate (NONE/TURP/RP); occurrence of hemorrhoids
(yes/no); and duration of RT (weeks). A Pearson’ s c
2
test or, in the case of small sample size, Fisher’sexact
test was used to examine whether there was a statisti-
cally significant difference in the occurrence and evolu-
tion of acute and particularly late GU and GI toxicity
between the two observed 3DCRT techniques.
To evaluate the association of immune response and
toxicity level, the patients were divided in the group T
(patients with any toxicity level-grades 1-3) and group 0,
those with no toxicity (grade 0). To compare the
immune parameters between these groups of patients
the t-test was p erformed. To find the relationship
between immune response in prostate cancer patients
and treatment related factors, Pearson ’s correlation coef-
ficients were calculated.
For statistical analysis Statsoft’s STATISTICA version
9 and SPSS Statistics version 18 were used. All tests
were considered to be statistically significant at the level
of p < 0.05. The required sample size for all performed
statistical tests was calculated using IBM SPSS Sample-
Power software version 3.
Results
Logistic regression models for GI and GU toxicities
Four logistic regression models for acute GI, acute GU,
late GI, and late GU toxicity were created. All models
were statistically significant and adequately interpolated
the data; however in both models for late toxicities, GI
and GU, a large disparity between the number of
patients in groups with high toxicity vs. low or no toxi-
city was observed. The classification ability of all four
models was very good-80.0% for acute GI toxicity, 78.9%
for acute GU toxicity, 76.3% for late GI toxicity, and
76.0% for late GU toxicity. The area under the ROC
curve (AUC) which determines the discrimination
power of the logistic model reached the following
values: 0.836 for acute GI toxicity-discrimination quality
according to Tape [18], “ Good"; 0.810 for acute GU
Vranova et al. Radiation Oncology 2011, 6:87
/>Page 4 of 13
toxicity-"Good"; 0.784 for late GI-"Fair"; and 0.761 for
late GU toxicity-"Fair”.
The significance level and odds ratio for statistically
significant regression coefficients are summarized in
Table 2 for acute and late GI and GU toxicity. Acute GI
and GU toxicities were significantly dependent on
patients’ increasing age, and the chance of developing
high toxicity levels greaten. For late GI and GU toxici-
ties, the larger irradiated volume of OARs (rectum and
urinary bladder) enhanced the chance of high-level toxi-
city occurrence. Other important predictors of acute GI
toxicity were the percentage of rect um volume receiving
70 Gy (the higher the percentage of rectum, the higher
the chance of high level toxicity) and the 3DCRT tech-
nique used, where the high-level toxicity developed
when the WP technique was used (26.16 times greater
than in the case of the PO technique). The higher T
stage of TNM classification and the acute GI toxicity
significantly increased the probability of late GI toxicity
occurrence. The results pointed to the significant asso-
ciation of acute GU toxicity and the percentage of the
urinary bladder receiving 50 Gy, and the association of
late GU toxicity with the percentage of the urinary blad-
der receiving 40 Gy. Both types of urinary toxicities
(acute and late) were augmen ted by radical prostatect-
omy prior to radiotherapy (NONE vs. RP) that increased
the occurrence of high-level toxicity for acute and late
GU toxicity 7.35 times (OR = 0.136) and 11.15 times
(OR = 0.090), respectively. Another important statisti-
cally significant predictor found for late GU toxicity was
the PO t ype of 3DCRT that evoked the development of
high-level toxicity 1.72 times more (OR = 0.580) in
comparison with WP technique.
GI and GU toxicity evolution after WP and PO 3DCRT
techniques
The used 3DCRT technique was proven as an important
factor influencing the development of GI and GU toxi-
city. Consequently, we analyzed the occurrence and evo-
lution of late GI and GU toxicity from pretreatment
symptoms through acute GI and GU toxicity in each
group of patients separately. The proportion of patients
suffering pretreatment GU, as well as GI pathologies,
was comparable in the groups undergoing either the
WP or PO 3DCRT therapy. The proportion of GU toxi-
city did not change significantly between the WP and
PO techniques in all appearing grades (0-3). The results
of toxicity dynamics are summarized in Table 3. The
values of the last late GI and GU toxicity observed in
patients during their last inspection are shown.
In the cohort of patients included in the WP group,
pretreatment GI toxicity of grade 2 was found in the
history of 2 patients (1.72%), and only 1 patient (0.86%)
showed grade 3. During treatment or within the first 90
days after treatment, acute grade 2 GI toxicity occurred
in 65 (56.03%) and gra de 3 GI toxicity in 3 patients
(2.59%).TheseverelateGItoxicityofgrade2occurred
in 5 (4.31%), grade 3 in 3 patients (2.59%), and grade 4
in 1 patient (0.86%). There were no late grade 5 GI toxi-
city-suffering patients in this group. Pretreatment GU
damage of grade 2 was found in the history of 4 patients
(3.44%) and grade 3 in the history of 2 patients (1.72%).
WP 3DCRT evoked acute grade 2 GU toxicity in 30
(37.04%) and acute grade 3 GU toxicity in 4 patients
(3.45%). Severe late GU toxicity of grade 2 occurred in 8
patients (5.76%) and grade 3 in 6 patients (7.41%).
There were no late grade 4 or 5 GU toxicities observed.
Table 2 Logistic regression models for acute and late GI and GU toxicities.
Acute GI toxicity Late GI toxicity
Variable OR 95% CI p Variable OR 95% CI p
Age 1.097 1.03-1.17 0.006 Volume of rectum 1.028 1.00-1.06 0.036
Percentage of rectum receiving
70 Gy
1.134 1.03-1.25 0.009 T stage of TNM classification 4.630 1.09-20.00 0.037
3DCRT technique
WP vs PO
26.163 5.10 -134.2 0.000 Acute GI
Low vs High
0.115 0.01-0.92 0.042
Acute GU toxicity Late GU toxicity
Variable OR 95% CI p Variable OR 95% CI p
Age 1.108* 1.02-1.20 0.015 Volume of urinary bladder 1.016 1.00-1.03 0.018
Percentage of urinary bladder receiving
50 Gy
1.127 1.01-1.25 0.026 Percentage of urinary bladder receiving
40 Gy
1.144 1.00-1.30 0.045
Surgical intervention
None vs RP
0.161 0.04-0.68 0.013 Surgical intervention
None vs RP
0.089 0.01-0.85 0.035
3DCRT technique
WP vs PO
0.580 0.10-1.74 0.029
Odds ratios (OR), 95% Confidence Intervals (CI) and significance levels (p) of Wald chi-square statistic of patient-, tumor-, and treatment-related factors that meet
statistical significance are presented
Vranova et al. Radiation Oncology 2011, 6:87
/>Page 5 of 13
Table 3 Scoring of GI and GU disorders for WP and PO 3DCRT techniques.
Incidence and development of acute GI/GU toxicity from pretreatment symptoms
Acute GI toxicity Acute GU toxicity
WP PO WP PO
Pretreatment
Symptoms
Acute toxicity n % n % n % n %
0 ® 0 33 28.45% 40 49.38% 43 37.07% 36 44.44%
0 ® 1 14 12.07% 17 20.99% 18 15.52% 12 14.81%
0 ® 2 58 50.00% 20 24.69% 25 21.55% 17 20.99%
0 ® 3 1 0.86% 1 0.86%
1 ® 0 1 1.23% 13 11.21% 7 8.64%
1 ® 1 2 2.47% 6 5.17% 3 3.70%
1 ® 2 5 4.31% 1 1.23% 4 3.45% 3 3.70%
1 ® 3 2 1.72%
2 ® 0 1 0.86% 1 0.86% 1 1.23%
2 ® 1 1 1.23%
2 ® 2 1 0.86% 1 0.86%
2 ® 3 2 1.72% 1 1.23%
3 ® 0 1 0.86%
3 ® 1
3 ® 2 1 0.72%
3 ® 3 1 0.86%
Development of late GI/GU toxicity from acute GI/GU toxicity
GI toxicity GU toxicity
WP PO WP PO
Acute toxicity Late toxicity n % n % n % n %
0 ® 0 29 25.00% 34 41.98% 41 35.34% 31 38.27%
0 ® 1 5 4.31% 5 6.17% 13 11.21% 8 9.88%
0 ® 2 2 2.47% 1 0.86% 3 3.70%
0 ® 3 1 0.86% 3 2.59% 2 2.47%
1 ® 0 10 8.62% 11 13.58% 17 14.66% 9 11.11%
1 ® 1 4 3.45% 7 8.64% 4 3.45% 2 2.47%
1 ® 2 1 0.86% 2 2.47%
1 ® 3 1 1.23% 2 1.72% 3 3.70%
2 ® 0 47 40.52% 9 11.11% 18 15.52% 10 12.35%
2 ® 1 9 7.76% 6 7.41% 8 6.90% 8 9.88%
2 ® 2 5 4.31% 5 6.17% 3 2.59% 2 2.47%
2 ® 3 2 1.72% 1 1.23% 1 0.86%
2 ® 4 1 0.86%
3 ® 0 2 1.72%
3 ® 1
1 0.86% 2 1.72%
3 ® 2 1 0.86%
3 ® 3 1 0.86% 1 1.23%
Summary of last late GI/GU toxicities dynamics
WP PO
Last late GI toxicity n%n%
Patients without toxicity 29 25.00% 34 41.98%
Decrease of toxicity (G1,2,3®G0) 59 50.86% 20 24.69%
Patients with moderate toxicity-G1
Development G0 ® G1 5 4.31% 5 6.17%
Unchanged grade of toxicity G1 4 3.45% 7 8.64%
Decrease of toxicity from G2, 3® G1 10 8.62% 6 7.41%
Patients with high level toxicity G2, 3, 4 9 7.76% 9 11.11%
Vranova et al. Radiation Oncology 2011, 6:87
/>Page 6 of 13
None of the patients in the PO group suffered grade 2,
3 or 4 pretreatment GI disorders. During RT or within
the first 90 days after PO 3DCRT, acute grade 2 GI
toxicity occurred in 21 cases (25.93%), and there were
no patients with grade 3 or 4 GI toxicity. 7 patients
(8.64%) suffered severe l ate grade 2 GI toxicity, and 1
patient (1.23%) grade 3. Prior to radiotherapy, 3 patients
(3.77%) had grade 2 toxicity, and none had grade 3 GU
toxicity. Acute grade 2 GU toxicity developed in 20
(24.69%) and grade 3 in 1 (1.23%) patients. Late grade 2
GU toxicity occurred in 7 (8.64%) and grade 3 in 6
(7.41%) patients. None of the patien ts in the cohort had
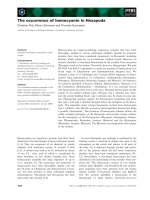
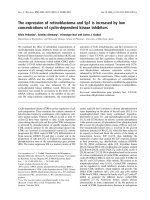
grade 4 of GU toxicity. Figure 1 summarizes the propor-
tion o f evolution of GI (Figure 1A) and GU (Figure 1B)
toxicity events from pretreatment through acute to late
damage, for both the WP and PO patient groups. The
only disparity between the two 3DCRT techniques was
found in the case of development of acut e GI toxicity,
where a large increase of high level toxicity grades ≥ 2
was observed in the WP group compared to the PO
group. On the other hand, results from Table 3 illustrate
the diminution of toxicity from grades 1-3 to no toxicity
(grade 0), more prominent in the WP group relative to
the PO group. The Pearson’s c
2
test was perform ed to
determine the statistical significant difference between
the WP and PO 3DCRT techniques, which was observed
only in the occurrence of acute GI toxicity (p = 0.0001).
Correlation between the 3DCRT parameters, GI/GU
toxicity and immune response
We screened the immunol ogical parameters, number of
leukocytes, distribution of lymphocyte populations (T, B,
NK, and NKT cells) and their subsets in the peripheral
blood of patients before, throughout and after the finish-
ing of 3DCRT, and correlated them to dose volume
parameters, as well as to the volume of irradiated bone
marrow.
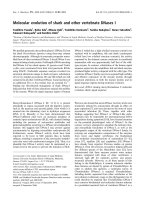
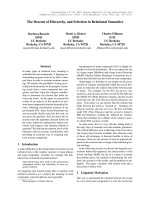
The relationship of the applied dose and the percen-
tage of volume of bone marrow irradiated are presented
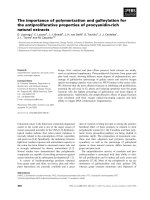
in Figure 2. The highest correlation occurred at a dose
of 46 Gy, as depicted in F igure 3. We found that the
bone marrow irradiation had a significant negative
association with the number of leukocytes, but did not
influence the proportion of NK cells during the irradia-
tion in doses ranging from 44 Gy to 54 Gy (Table 4).
Doses lower than 44 Gy and higher than 54 Gy, did not
exhibit statistically significant correlations with leuko-
cyte number. In the scope of PBM irradiation, we found
a positive correlation between low doses (1-43Gy) a nd
100%
80%
60%
40%
20%
0%
WP PO
G0 G1 G2 G3 G4
WP POWP PO
Pretreatment
Acute Late
Evolution of GI damage from preatrement through acute to late stages
Evolution of GU damage from pretreatment through acute to late stages
100%
80%
60%
40%
20%
0%
WP PO
G0 G1 G2 G3
WP POWP PO
Pretreatment
Acute Late
B
A
Figure 1 Summary of GI and GU symptoms scoring before and
after 3DCRT. Comparison of GI (A) and GU (B) toxicity between the
PO (n = 106) and the WP (n = 139) patient groups. Patients were
scored according to the modification of RTOG morbidity scale.
Percentage of occurrence of grades G0, G1, G2, and G3 of
pretreatment pathology, acute, and late GU and GI toxicities are
demonstrated.
Table 3 Scoring of GI and GU disorders for WP and PO 3DCRT techniques. (Continued)
WP PO
Last late GU toxicity n%n%
Patients without toxicity 41 35.34% 31 38.27%
Decrease of toxicity (G1,2,3 ® G0) 35 30.17% 19 23.46%
Patients with moderate toxicity-G1
Development G0 ® G1 13 11.21% 8 9.88%
Unchanged grade of toxicity G1 4 3.45% 2 2.47%
Decrease of toxicity from G2, 3®G1 10 8.62% 8 9.88%
Patients with high level toxicity G2, 3, 4 13 11.21% 13 16.05%
Vranova et al. Radiation Oncology 2011, 6:87
/>Page 7 of 13
NK cell numbers during RT (Table 4). Blood samples of
patients receiving 34-35 Gy to the bone marrow demon-
strated significantly increased proportion of NK (p =
0,002), NKT (p = 0,005) and cytotoxic T cells (p =
0,018) after the end of therapy. Moreover, T lymphocyte
proportions in the patient’s blood correlated positively
with the higher doses (47-62 Gy) of irradiated PBM.
Increased number of resting and terminally differen-
tiated NK cells correlated with several dosimetric para-
meters, and GI and GU toxicity. Table 5 summarizes
the Pearson’ s correlations between the immune and
dosimetric variables on day 14 of RT, and 15-20 days
post-radiotherapy. Negative correlation throughout the
RT was detected between the NKT cell and T lympho-
cyte proportion and the volume of the rectum receiving
lower and higher doses, respectively. After completion
ofRTtheNKandNKTcellswerefoundtobemore
sensitive to higher doses. However, positive correl ation
was found between differentiating B lymphocytes, and
the irradiated volume of rectum and bladder receiving
70 Gy.
The evaluation o f GI and GU toxicity effects in the
WP (but not PO) group of patients revealed signif icant
up-regu lation of T l ymphocyte numbers (p = 0.047) and
NK cell effector function (p = 0.038) during radiother-
apy, as well as in patients developing acute GU toxicity.
Late GU toxicity-suffering patients had a significantly
increased number of CD8+ cytotoxic T cells, (p = 0.002)
and NK cell killi ng capability (Table 6). All statistically
significant correlation coefficients met the conditions of
required sample si ze. The GI and GU toxicity side
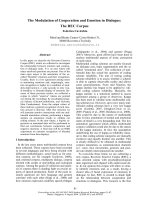
effects (after the completion of 3DCRT), but not
3DCRT i tself, significantly decreased the distribution of
NKT cells in the WP group (Figure 4A). However, the
patients treated with the PO 3DCRT, suffering GI and
GU toxicities, had a lower number of NKT cells during
the entire follow-up (Figure 4B).
Discussion
In this study two different 3DCRT techniques (WP and
PO)wereanalyzedandthedegreeofassociationwas
determined between the o ccurrence and evolution of
acute and late GI and GU toxicities and the t reatment
related characteristics in patients entering our hospital.
Important findings include: (i) a higher proportion of
acute GI toxicity in the WP 3DCRT technique group
and conversely a slightly higher proportion of late GI
and GU toxicity in the PO patient group; (ii) acute GI
toxicity as a significant predictor of late GI toxicity; (iii)
a strong depende nce of the occurrence and evolution of
acute GI toxicity and of late GU toxicity on which
3DCRT technique is used; (iv) the association of both
acute and late GU toxicity and radical prostatectomy
performed prior to radiotherapy; (v) the influence of age
on both acute GI and GU toxicities; ( vi) a correlation
between the percentage of volume of irradiated bone
marrow and a decreased number of leukocytes; and (vii)
the influence of radiotherapy preferentially on NK, NKT
and T cell subpopulations.
We found an increase of acute vs. pretreatment GI
symptoms predominantly in the WP group, even i f the
patients were irradiated with lower doses compared with
the PO 3DCRT group. We assume that the limiting fac-
tor in high-volume irradiation is no t the dosimetric
parameters, but the overall pati ent tolerance. In addi-
tion, the WP technique was undergo ne by patients with
advanced stages of disease, lower overall health status,
and suppressed immune functions. These observations
are supported by data of Jereczek-Fossa [19] and
Schultheiss et al. [20]; however, some invest igators
didn’t demonstrate this correlation [21]. On the other
hand, the diminution of late GI and GU toxicities to
3.5
4.0
4.5
5.0
5.5
6.0
6.5
7.0
7.5
8.0
8.5
24681012141618202224262830
Volume of irradiated bone marrow at a dose of 46 Gy [%]
Number of leukocytes
Percentage of irradiated BM volume at a dose of 46 Gy vs. the number of lekocytes
Correltion coecient, r = - 0.4827
95% Condence interval
Figure 3 Scatter plot showing the correlation between the
percentage of irradiated volume of bone marrow and the
decrease of number of leukocytes.
Percentage of irradiated BM volume, relative do dose
100
80
60
40
20
0
Volume of irradiated bone marrow [%]
0 1020304050607080
Dose [Gy]
Figure 2 Relationship between the percentage of irradiated
volume of bone marrow and the dose applied.
Vranova et al. Radiation Oncology 2011, 6:87
/>Page 8 of 13
grade 1 or to no toxicity in the majority of acute toxicity
(grade 1-3) suffering patients, was observed also in the
WP 3DCRT group.
Our data regarding the frequency of severe toxicities
are similar to those of other series, despite the fact that
a direct comparison of toxicities is difficult due to the
existence of many modified versions of the classification,
and modifications of grading scales. Similarities were
found between our results, the RTOG 9413 [22] analy-
sis, and the GETUG-01 [23] prospective study. The
diversity in the diagnostics c ould be created by indivi-
dual physicians due to the subjectivity of the scoring
system, when the same toxicity could be graded differ-
ently. Due to the findings of decreased late GI and GU
toxicities after 3DCRT in the cohort of our patients, we
compared these results with the studies using hypofrac-
tionated stereotactic body radiotherapy SBRT, which is a
new modality of localized prostate cancer RT. The
SBRT, together with innovations in image-guidance
technology, is able to automatically correct the move-
ment of the prostate during treatment, and deliver
highly-conformal beam profiles, which h ave greatly
enhanced the capability of delivering high dose fractions
to a well-defined target, with sharp dose fa ll-off towards
the bladder and rectum. Most of the studies concerning
SBRT as a monotherapy or even as a boost following
external beam radiotherapy presented only negligible
incidenceofseverelateGIandGUtoxicity.Katzetal.
Table 4 Pearson’s correlation coefficients between bone marrow irradiation and immune parameters.
Dose
[Gy]
Volume [%] Number of leukocytes Proportion of NK cells
Median Range Correlation coefficient p Correlation coefficient p
5 44.54 30.31-98 -0.3177 0.140 0,5185 0,019
6 43.92 29.57-98 -0.3161 0.142 0,5197 0,019
7 43.38 28.95-98 -0.3161 0.142 0,5225 0,018
8 42.77 28.42-98 -0.3162 0.142 0,5239 0,018
9 42.31 27.95-97 -0.3170 0.141 0,5236 0,018
10 41.86 27.53-97 -0.3188 0.138 0,5224 0,018
11 41.34 27.12-97 -0.3213 0.135 0,5261 0,018
12 40.74 26.74-96 -0.3256 0.129 0,5196 0,019
13 40.13 26.36-96 -0.3314 0.122 0,516 0,020
14 39.63 26.00-96 -0.3361 0.117 0,5147 0,020
15 39.13 25.66-95 -0.3390 0.114 0,5133 0,021
16 38.66 25.34-95 -0.3402 0.112 0,5124 0,021
17 38.20 25.03-95 -0.3411 0.111 0,5117 0,021
18 37.77 24.72-94 -0.3423 0.110 0,5107 0,021
19 37.19 24.40-94 -0.3446 0.107 0,5096 0,022
20 36.35 24.05-94 -0.3463 0.105 0,5083 0,022
21 35.70 23.70-93 -0.3481 0.104 0,5065 0,023
22 35.20 23.33-93 -0.3496 0.102 0,5036 0,024
23 34.66 22.91-92 -0.3517 0.100 0,4984 0,025
24 34.13 22.37-91 -0.3675 0.084 0,4771 0,033
25 33.53 21.61-83 -0.3713 0.081 0,4579 0,042
44 10.97† 4.38-38.66 -0.4619 0.027 0,4270 0,060
45 9.97 4.22-35.05 -0.4645 0.026 0,3986 0,082
46 9.08 4.07-28.04 -0.4827 0.020 0,4153 0,069
47 8.39 3.93-23.31 -0.4769 0.021 0,3906 0,089
48 7.70 3.81-21.61 -0.4731 0.023 0,3935 0,086
49 7.07 3.50-20.48 -0.4701 0.024 0,4023 0,079
50 6.54 3.15-19.58 -0.4710 0.023 0,4130 0,070
51 6.00 2.83-18.84 -0.4751 0.022 0,4178 0,067
52 5.55 2.55-18.16 -0.4747 0.022 0,4187 0,066
53 5.21 2.30-17.50 -0.4709 0.023 0,4201 0,065
54 4.98 1.95-16.82 -0.4655 0.025 0,4208 0,065
The number of leukocytes and NK cell percentages were correlated to dose received and volume of irradiated bone marrow (n = 37)
*Required sample size for the obtained correlation coefficients (for a = 0.05 and power of the test b = 0.80) was calculated 32-34 patients
†Statistically significant results are marked in bold
Vranova et al. Radiation Oncology 2011, 6:87
/>Page 9 of 13
Table 5 Pearson’s correlation coefficients of immune cells proportions with dosimetric parameters
14
th
date of 3D CRT 15-20 days after completion of 3D CRT
Variable vs. Variable Pearson’s
correlation
p Variable vs. Variable Pearson’s
correlation
p
T cells
(CD3+CD56-)
D
min
-0.5869 (20)* 0.012 NK cells
(CD3-CD56low)
Percentage of rectum
receiving 70 Gy
-0.5436 (23) 0.024
D
mean
-0.5068 (27) 0.032
D
max
of rectum -0.4918 (29) 0.038
D
max
of urinary bladder -0.6089 (18) 0.007
Percentage of urinary bladder
receiving 70 Gy
-0.4906 (29) 0.007
NKT cells
(CD3+CD56+)
D
min
of rectum -0.5776 (20) 0.012 NKT cells
(CD3+CD56+)
D
max
of rectum -0.6755 (14) 0.000
D
mean
of rectum -0.7243 (12) 0.001 Percentage of rectum
receiving 70 Gy
-0.4148 (42) 0.031
Percentage of rectum
receiving 40 Gy
-0.7363 (11) 0.000 D
max
of urinary bladder -0.6210 (17) 0.001
Percentage of rectum
receiving 50 Gy
-0.5613 (22) 0.015
NK cells
(CD3-D56low)
D
min
of rectum 0.3963 (47) 0.033 Activated B cells
(CD19+CD20+
CD38+)
D
min
of rectum 0.4582 (34) 0.016
D
mean
of rectum 0.3724 (53) 0.047 D
mean
of rectum 0.4342 (38) 0.024
Percentage of urinary bladder
receiving 70 Gy
0.5152 (26) 0.004 Percentage of rectum
receiving 50 Gy
0.4011 (46) 0.038
Percentage of rectum
receiving 60 Gy
0.5800 (20) 0.002
Terminally
differentiated NK
cells
(CD3-CD56+)
D
min
0.4887 (30) 0.040 Terminally
differentiated
NK cells
(CD3-CD56+)
D
max
of rectum -0.5549 (22) 0.000
Percentage of rectum
receiving 70 Gy
0.4835 (30) 0.042 D
max
of urinary bladder -0.4608 (34) 0.016
Percentage of urinary bladder
receiving 70 Gy
0.5226 (26) 0.026
GI, GU toxicity 0.5166 (26) 0.028
*Required sample size for correlation coefficient for a = 0.05 and power of the test b = 0.80 is given in the brackets
Table 6 Influence of GI/GU toxicity on antitumor immune response.
Toxicity Variable Mean ± SD
(T)
Mean ± SD
(0)
p-value N
(T)
N
(0)
Acute GU
14
th
day
of 3D-CRT
% of T cells
(CD3+D56-)
68.41 ± 0.70 58.33 ± 8.99 0.047 26 11 (6)*
Acute GU
14
th
day
of 3D-CRT
Cytotoxicity 13.71 ± 5,21 6.54 ± 3.12 0.038 26 11 (6)
Late GU
15-20 days
after 3D-CRT
% of CTL
(CD3+CD8+)
15.99 ± 6.52 8.55 ± 2.26 0.002 13 24 (7)
Late GI
15-20 days
after 3D-CRT
Cytotoxicity 25.44 ± 4.96 13.82 ± 3.68 0.032 14 23 (2)
For comparison of immune parameters between the group of patients suffering from any acute and late GU or GI toxicity (T), and the group of patients without
toxicity side effects (0) after 3DCRT the t-test was applied.
*Required sample size in each group for given standard deviation and difference of means between groups for a = 0.05 and power of the test b = 0.80 is given
in the brackets
Vranova et al. Radiation Oncology 2011, 6:87
/>Page 10 of 13
[24,25], Freeman et al. [26] and other authors [27]
reported milder toxicity profiles in compariso n with our
results, particularly in the case of late GI and GU
impairments. On the contrary, Jabbari et al. [28] pre-
sented in their study similar results as our ones in the
occurrence of severe late GU toxicity (grades 2-3), and
even worse outcomes in evolution of acute GU toxicity.
The analysis of GU toxicity is difficult, due to interfer-
ence with pre-existing dysfunction, age-related diseases,
and previous urological surgery [21,29]. We have to
remember that some of these pre-existing symptoms
could have been erroneously interpreted as acute or
even late GU toxicity. On the other hand, late bladder
damage can occur with a long latency time, potentially
resulting in the underestimation of the real severity of
late toxicity [30]. The difference in the time of clinical
manifestation could be the reason why some researchers
demonstrated the correlation of acute and late GI, but
notGUtoxicity[31].Theseoutcomeswereprovedin
our study, as well.
The development of acute 3DCRT- induced GI and/or
GU damage was generally mild in both groups; and
none of the patients had an interruption of radiotherapy
due to t oxicity side effects. The risk of both acute GI
and GU reactions depended preferentially on the age of
patients, in agreement with the results demonstrated by
Jereczek-Fossa et al. [31]. The biological variables and
different clinical decisions based on patie nt age could
participate on the final outcome. The association of
acute GU toxicity with the percentage of the urinary
bladder receiving 50 Gy found in our study was in
accordance with the results of Fiorino et al.[32] and
other authors [21,29], who reported a significant correla-
tion between DVH parameters and incontinence. S imi-
larly, the acute GI toxicity associates with the
percentage of rectum receiving 70 Gy as demonstrated
also by the Italian Association fo r Radiation Oncology
(AIRO) Group on Prostate Cancer (AIROPROS) 0101
trial (previous retrospective investigation [5], who
described that the dose of 70 Gy at rectum was predic-
tive for late G2-G3 bleeding), AIROPROS 0102 [33],
and by others [34,30,7,35]. Both late GI and GU toxici-
ties positively associated with the volume of the irra-
diated organ at risk, rectum and urinary bladder,
respectively. Furthermore, the late GI toxicity is asso-
ciated with stage T of TNM classification of the disease,
and is strongly influenced by acute GI toxicity. These
finding are in agreement with the published data of
Heemsbergen et al. [36]. The risk of late GU reactions
depended on the percentage of urinary bladder volume
receiving 40 Gy, the 3DCRT technique used, and the
previous urological surgery [21,29].
Originally, the primary mechanism of RT in cancer
reduction h as been considered the neoplastic cell DNA
damage.However,Takeshimaet al. have found that
tumor-specific CTL, which were induced in the draining
lymph nodes and tumor tissue of mice by RT, are fun-
damental to the inhibition of cancer growth [37]. The
immunological evaluation performed during 3DCRT
showed a positive correlation of the number of activated
NK cells and the proportion of terminally differentiated
tumor targeted cytotoxic effectors with GI and GU toxi-
cities. Both of these subpopulations returned to normal
values or decreased after completing RT. In contrast, T
lymphocytes were decreased during RT and normalized
after its completion; while NKT cells were down-regu-
lated in all time periods. The acute GU and late GI and
GU toxicities significantly increased the T cell propor-
tion, NK cell-mediated cytotoxicity, and cytotoxic T cell
numbers. We assume that these changes are caused by
stress conditions induced by RT-damaged and GI or GU
toxicity-affected tissues, eliciting stimulation of cytotoxic
cells (NK and CTLs). These RT effects could be due to
inflammation following increased apoptotic/necrotic
events in the involved tissues. The surface expression or
extracellular release of stress proteins (e.g. MICs,
60%
50%
40%
30%
20%
10%
0%
before RT during RT post RT
Toxicity grade (1 - 3)
No toxicity
60%
50%
40%
30%
20%
10%
0%
before RT during RT post RT
Prostate-only (PO) 3D-CRT technique
Whole pelvic (WP) 3D-CRT technique
Toxicity grade (1 - 3)
No toxicity
A
B
NKT cells (CD3+CD56+CD4+)
Figure 4 Cumulative effect of radiation vs. toxicity on NKT cell
proportions in the course of 3DCRT. CD4+ out of CD3+CD56+
NKT cells were evaluated in the PBMC of patients suffering GI, GU
toxicities of grades 1-3 (T) or without any toxicity (0) undergoing
WP (n = 16; A) or PO (n = 21; B) types of radiotherapy. Pooled data
of patients in each treatment group, at all time points tested, are
presented as mean values, where standard deviation does not
exceed 10%.
Vranova et al. Radiation Oncology 2011, 6:87
/>Page 11 of 13
Hsp70), following tumor cell damage by RT, can play a
key role in immune system mo dulation [38]. These
molecules are ligands of the NK cell activation receptor
NKG2D [39], and can stimulate NK cell functional
maturation. Particularly, Hsp72 can act as an immunolo-
gical adjuvant [39,40], participating in the non-self
recognition of prostate cancer cells. Thus we can
hypothesize, according to results of Hurwitz et al.[12]
that the enhanced immune function, involving resting
and terminally differentiated NK cells during 3DCRT, as
well as the up-regulation of CTL number a nd the NK
cell-mediated cytotoxicity in GI or GU suffering
patients, could follow the release of HSPs either evoked
by radiation or by GI or GU toxicity-induced cellular
stress.
Conclusion
Our RT series included 197 patients who were treated
in one center and may serve as a basis for comparison
with other oncology centers, particularly in the Cze ch
Republic.Wefoundastrongdependenceofthedevel-
opment of GI and GU disorders on the 3DCRT techni-
que applied. Most important from a clinical point of
view and the overall quality of life of p rostate cancer
patients after 3D CRT treatment was the diminution of
late GI and GU toxicity to grades 0-1 in a majority o f
acute toxicities of patients suffering grades 1-3. The
relevance of our study lies in the complex evalua tion of
clinical and radio-therapeutical variables describing the
correlations between OARs parameters, GI and GU
toxicity, phenotype, and the functional profile of
immune cells. Our results brought a new insight into
the 3DCRT impact on OARs and the antitumor
immune response.
List of abbreviations
3DCRT: three-dimensional conformal radiotherapy; ADT: androgen
deprivation therapy; AUC: area under the curve; BM: bone marrow; CD:
cluster of differentiation; CT: computer tomography; CTL: cytotoxic T
lymphocyte; CTV: clinical target volume; DVH: dose volume histogram; GI:
gastrointestinal; GU: genitourinary; IBM: iliac bone marrow; ICRU:
International Commission on Radiation Units; LENT-SOMA: Late effects in
Normal Tissues Subjective, Objective, Management and Analytical scales; LN:
lymph nodes; LP: lower pelvis; LS: lumbosacral spine; MLC: multileaf
collimator; NK: natural killer; OAR: organs at risk; OR: odds ratio; PBM: pelvic
bone marrow; PBMC: peripheral blood mononuclear cells; PO: prostate-only;
PSA: prostate-specific antigen; PTV: planning target volume; ROC: receiver
operating characteristic; RP/TURP: radical prostatectomy /transurethral
resection; RT: radiotherapy; RTOG: Radiation Therapy Oncology Group; WP:
whole pelvic.
Acknowledgements
We thank Drs. Bela Malinova, Anna Kindlova, Jana Prausova, and Michaela
Matouskova for excellent cooperation and valuable comments. The work
was supported by the Grant agency of the Charles University, GAUK 109908/
2008 and the Grant agency of the Academy of Sciences of the Czech
Republic, IAA500200620.
Author details
1
Department of Medical Biophysics and Medical Informatics, 3
rd
Faculty of
Medicine, Charles University, Prague, Czech Republic.
2
Department of
Radiotherapy and Oncology, Motol University Hospital, Charles University,
Prague, Czech Republic.
3
Department of Immunology and Gnotobiology,
Institute of Microbiology, Academy of Sciences of the Czech Republic, v.v.i.,
Prague, Czech Republic.
4
Faculty of Biomedical Engineering, Czech Technical
University in Prague, Kladno, Czech Republic.
Authors’ contributions
All authors have read and approved the final manuscript. JV, JRo and AF
prepared the design of the manuscript; SV made the treatment planning
and selected the patients; MS managed the experimental schedule and
collected the samples; JRi and AF completed the immunological results; JV
created the statistical evaluations; and JV together with AF, SV, and JRi wrote
the paper.
Competing interests
We have no personal or financial conflicts of interest, and have not entered
into any agreement that could interfere with our access to the data on the
research, or upon our ability to analyze the data independently, to prepare
manuscripts, and to publish them.
Received: 1 April 2011 Accepted: 27 July 2011 Published: 27 July 2011
References
1. Dale W, Campbell T, Ignacio L, Song P, Kopnick M, Mamo C, Ray P,
Vijayakumar S: Self-assessed health-related quality of life in men being
treated for prostate cancer with radiotherapy: instrument validation and
its relation to patient-assessed bother of symptoms. Urology 1999,
53:359-366.
2. Fiorino C, Sanguineti G, Cozzarini C, Fellin G, Foppiano F, Menegotti L,
Piazzolla A, Vavassori V, Valdagni R: Rectal dose-volume constraints in
high-dose radiotherapy of localized prostate cancer. Int J Radiat Oncol
Biol Phys 2003, 57:953-962.
3. Onal C, Topkan E, Efe E, Yavuz M, Sonmez S, Yavuz A: Comparison of rectal
volume definition techniques and their influence on rectal toxicity in
patients with prostate cancer treated with 3D conformal radiotherapy: a
dose-volume analysis. Radiat Oncol 2009, 4:14.
4. Pinkawa M, Holy R, Piroth MD, Fischedick K, Schaar S, Szekely-Orban D,
Eble MJ: Consequential late effects after radiotherapy for prostate
cancer-a prospective longitudinal quality of life study. Radiat Oncol 2010,
5:27.
5. Rancati T, Fiorino C, Gagliardi G, Cattaneo GM, Sanguineti G, Borca VC,
Cozzarini C, Fellin G, Foppiano F, Girelli G, Menegotti L, Piazzolla A,
Vavassori V, Valdagni R: Fitting late rectal bleeding data using different
NTCP models: results from an Italian multi-centric study
(AIROPROS0101). Radiother Oncol 2004, 73:21-32.
6. Skwarchuk MW, Jackson A, Zelefsky MJ, Venkatraman ES, Cowen DM,
Levegrun S, Burman CM, Fuks Z, Leibel SA, Ling CC: Late rectal toxicity
after conformal radiotherapy of prostate cancer (I): multivariate analysis
and dose-response. Int J Radiat Oncol Biol Phys 2000, 47:103-113.
7. Sohn M, Yan D, Liang J, Meldolesi E, Vargas C, Alber M: Incidence of late
rectal bleeding in high-dose conformal radiotherapy of prostate cancer
using equivalent uniform dose-based and dose-volume-based normal
tissue complication probability models. Int J Radiat Oncol Biol Phys 2007,
67:1066-1073.
8. Liao YP, Wang CC, Schaue D, Iwamoto KS, McBride WH: Local irradiation of
murine melanoma affects the development of tumour-specific
immunity. Immunology 2009, 128:e797-e804.
9. Bogdandi EN, Balogh A, Felgyinszki N, Szatmari T, Persa E, Hildebrandt G,
Safrany G, Lumniczky K: Effects of low-dose radiation on the immune
system of mice after total-body irradiation. Radiat Res 2010, 174:480-489.
10. Bordon E, Henriquez-Hernandez LA, Lara PC, Pinar B, Rodriguez-Gallego C,
Lloret M: Role of CD4 and CD8 T-lymphocytes, B-lymphocytes and
Natural Killer cells in the prediction of radiation-induced late toxicity in
cervical cancer patients. Int J Radiat Biol 2010.
11. Tabi Z, Spary LK, Coleman S, Clayton A, Mason MD, Staffurth J: Resistance
of CD45RA- T cells to apoptosis and functional impairment, and
Vranova et al. Radiation Oncology 2011, 6:87
/>Page 12 of 13
activation of tumor-antigen specific T cells during radiation therapy of
prostate cancer. J Immunol 2010, 185:1330-1339.
12. Hurwitz MD, Kaur P, Nagaraja GM, Bausero MA, Manola J, Asea A: Radiation
therapy induces circulating serum Hsp72 in patients with prostate
cancer. Radiother Oncol 2010, 95:350-358.
13. Liang Y, Messer K, Rose BS, Lewis JH, Jiang SB, Yashar CM, Mundt AJ,
Mell LK: Impact of bone marrow radiation dose on acute hematologic
toxicity in cervical cancer: principal component analysis on high
dimensional data. Int J Radiat Oncol Biol Phys 2010, 78:912-919.
14. Cannistra SA, Griffin JD: Regulation of the production and function of
granulocytes and monocytes. Semin Hematol 1988, 25:173-188.
15. Partin AW, Kattan MW, Subong EN, Walsh PC, Wojno KJ, Oesterling JE,
Scardino PT, Pearson JD: Combination of prostate-specific antigen, clinical
stage, and Gleason score to predict pathological stage of localized
prostate cancer. A multi-institutional update. JAMA 1997, 277:1445-1451.
16. Mell LK, Schomas DA, Salama JK, Devisetty K, Aydogan B, Miller RC, Jani AB,
Kindler HL, Mundt AJ, Roeske JC, Chmura SJ: Association between bone
marrow dosimetric parameters and acute hematologic toxicity in anal
cancer patients treated with concurrent chemotherapy and intensity-
modulated radiotherapy. Int J Radiat Oncol Biol Phys 2008, 70:1431-1437.
17. Kuldova M, Svoboda J, Kovaru F, Vannucci L, Kovaru H, Fiserova A: NK cell-
mediated cytotoxicity modulation by A(2) adenosine receptor agonist in
different mammalian species. Folia Microbiol (Praha) 2009, 54:364-368.
18. Tape TG: The Area Under an ROC Curve [online], University of Nebraska
Medical Center. In: Interpreting Diagnostic Tests, Nebraska Medical
Center. 2011 [ />19. Jereczek-Fossa BA, Zerini D, Fodor C, Santoro L, Serafini F, Cambria R,
Vavassori A, Cattani F, Garibaldi C, Gherardi F, Ferrari A, Rocco B, Scardino E,
De CO, Orecchia R: Correlation between acute and late toxicity in 973
prostate cancer patients treated with three-dimensional conformal
external beam radiotherapy. Int J Radiat Oncol Biol Phys 2010, 78:26-34.
20. Schultheiss TE, Lee WR, Hunt MA, Hanlon AL, Peter RS, Hanks GE: Late GI
and GU complications in the treatment of prostate cancer. Int J Radiat
Oncol Biol Phys 1997, 37:3-11.
21. Liu M, Pickles T, Berthelet E, Agranovich A, Kwan W, Tyldesley S,
McKenzie M, Keyes M, Morris J, Pai H: Urinary incontinence in prostate
cancer patients treated with external beam radiotherapy. Radiother Oncol
2005, 74:197-201.
22. A Phase III Trial Comparing Whole Pelvic Irradiation Followed by a
Conedown Boost to Boost Irradiation Only and Comparing Neoadjuvant
to Adjuvant Total Androgen Suppression (TAS). 2011.
23. Pommier P, Chabaud S, Lagrange JL, Richaud P, Lesaunier F, Le PE,
Wagner JP, Hay MH, Beckendorf V, Suchaud JP, Pabot du Chatelard PM,
Bernier V, Voirin N, Perol D, Carrie C: Is there a role for pelvic irradiation in
localized prostate adenocarcinoma? Preliminary results of GETUG-01. J
Clin Oncol 2007, 25:5366-5373.
24. Katz AJ, Santoro M, Ashley R, Diblasio F, Witten M: Stereotactic body
radiotherapy as boost for organ-confined prostate cancer. Technol Cancer
Res Treat
2010, 9:575-582.
25. Katz AJ, Santoro M, Ashley R, Diblasio F, Witten M: Stereotactic body
radiotherapy for organ-confined prostate cancer. BMC Urol 2010, 10:1.
26. Freeman DE, King CR: Stereotactic body radiotherapy for low-risk
prostate cancer: five-year outcomes. Radiat Oncol 2011, 6:3.
27. Fuller DB, Naitoh J, Lee C, Hardy S, Jin H: Virtual HDR CyberKnife
treatment for localized prostatic carcinoma: dosimetry comparison with
HDR brachytherapy and preliminary clinical observations. Int J Radiat
Oncol Biol Phys 2008, 70:1588-1597.
28. Jabbari S, Weinberg VK, Kaprealian T, Hsu IC, Ma L, Chuang C, Descovich M,
Shiao S, Shinohara K, Roach M, Gottschalk AR: Stereotactic Body
Radiotherapy as Monotherapy or Post-External Beam Radiotherapy
Boost for Prostate Cancer: Technique, Early Toxicity, and PSA Response.
Int J Radiat Oncol Biol Phys 2010.
29. Sandhu AS, Zelefsky MJ, Lee HJ, Lombardi D, Fuks Z, Leibel SA: Long-term
urinary toxicity after 3-dimensional conformal radiotherapy for prostate
cancer in patients with prior history of transurethral resection. Int J
Radiat Oncol Biol Phys 2000, 48:643-647.
30. Peeters ST, Hoogeman MS, Heemsbergen WD, Hart AA, Koper PC,
Lebesque JV: Rectal bleeding, fecal incontinence, and high stool
frequency after conformal radiotherapy for prostate cancer: normal
tissue complication probability modeling. Int J Radiat Oncol Biol Phys
2006, 66:11-19.
31. Jereczek-Fossa BA, Jassem J, Badzio A: Relationship between acute and
late normal tissue injury after postoperative radiotherapy in endometrial
cancer. Int J Radiat Oncol Biol Phys 2002, 52:476-482.
32. Fiorino C, Fellin G, Rancati T, Vavassori V, Bianchi C, Borca VC, Girelli G,
Mapelli M, Menegotti L, Nava S, Valdagni R: Clinical and dosimetric
predictors of late rectal syndrome after 3D-CRT for localized prostate
cancer: preliminary results of a multicenter prospective study. Int J
Radiat Oncol Biol Phys 2008, 70:1130-1137.
33. Fellin G, Fiorino C, Rancati T, Vavassori V, Baccolini M, Bianchi C, Cagna E,
Gabriele P, Mauro F, Menegotti L, Monti AF, Stasi M, Valdagni R: Clinical
and dosimetric predictors of late rectal toxicity after conformal radiation
for localized prostate cancer: results of a large multicenter observational
study. Radiother Oncol 2009, 93:197-202.
34. Fiorino C, Cozzarini C, Vavassori V, Sanguineti G, Bianchi C, Cattaneo GM,
Foppiano F, Magli A, Piazzolla A: Relationships between DVHs and late
rectal bleeding after radiotherapy for prostate cancer: analysis of a large
group of patients pooled from three institutions. Radiother Oncol 2002,
64:1-12.
35. Vargas C, Martinez A, Kestin LL, Yan D, Grills I, Brabbins DS, Lockman DM,
Liang J, Gustafson GS, Chen PY, Vicini FA, Wong JW: Dose-volume analysis
of predictors for chronic rectal toxicity after treatment of prostate
cancer with adaptive image-guided radiotherapy. Int J Radiat Oncol Biol
Phys 2005, 62:1297-1308.
36. Heemsbergen WD, Peeters ST, Koper PC, Hoogeman MS, Lebesque JV:
Acute and late gastrointestinal toxicity after radiotherapy in prostate
cancer patients: consequential late damage. Int J Radiat Oncol Biol Phys
2006, 66:3-10.
37. Takeshima T, Chamoto K, Wakita D, Ohkuri T, Togashi Y, Shirato H,
Kitamura H, Nishimura T:
Local radiation therapy inhibits tumor growth
through the generation of tumor-specific CTL: its potentiation by
combination with Th1 cell therapy. Cancer Res 2010, 70:2697-2706.
38. De Maio A: Extracellular heat shock proteins, cellular export vesicles, and
the Stress Observation System: A form of communication during injury,
infection, and cell damage: It is never known how far a controversial
finding will go! Dedicated to Ferruccio Ritossa. Cell Stress Chaperones
2010.
39. Nausch N, Cerwenka A: NKG2D ligands in tumor immunity. Oncogene
2008, 27:5944-5958.
40. Udono H, Srivastava PK: Comparison of tumor-specific immunogenicities
of stress-induced proteins gp96, hsp90, and hsp70. J Immunol 1994,
152:5398-5403.
doi:10.1186/1748-717X-6-87
Cite this article as: Vranova et al.: The evolution of rectal and urinary
toxicity and immune response in prostate cancer patients treated with
two three-dimensional conformal radiotherapy techniques. Radiation
Oncology 2011 6:87.
Submit your next manuscript to BioMed Central
and take full advantage of:
• Convenient online submission
• Thorough peer review
• No space constraints or color figure charges
• Immediate publication on acceptance
• Inclusion in PubMed, CAS, Scopus and Google Scholar
• Research which is freely available for redistribution
Submit your manuscript at
www.biomedcentral.com/submit
Vranova et al. Radiation Oncology 2011, 6:87
/>Page 13 of 13