Báo cáo khoa học: "On the dosimetric impact of inhomogeneity management in the Acuros XB algorithm for breast treatment" pot
Bạn đang xem bản rút gọn của tài liệu. Xem và tải ngay bản đầy đủ của tài liệu tại đây (1.21 MB, 11 trang )
RESEARC H Open Access
On the dosimetric impact of inhomogeneity
management in the Acuros XB algorithm for
breast treatment
Antonella Fogliata
*
, Giorgia Nicolini, Alessandro Clivio, Eugenio Vanetti and Luca Cozzi
Abstract
Background: A new algorithm for photon dose calculation, Acuros XB, has been rece ntly introduced in the
Eclipse, Varian treatment planning system, allowing, similarly to the classic Monte Carlo methods, for accurate
modelling of dose deposition in media. Aim of the present study was the assessment of its behaviour in clinical
cases.
Methods: Datasets from ten breast patients scanned under different breathing conditions (free breathing and
deep inspiration) were used to calculate dose plans using the simple two tangential field setting, with Acuros XB
(in its versions 10 and 11) and the Anisotropic Analytical Algorithm (AAA) for a 6MV beam. Acuros XB calculations
were performed as dose-to-medium distributions. This feature was investigated to appraise the capability of the
algorithm to distinguish between different elemental compositions in the human body: lobular vs. adipose tissue
in the breast, lower (deep inspiration condition) vs. higher (free breathing condition) densities in the lung.
Results: The analysis of the two breast structures presenting densities compatible with muscle and with adipose
tissue showed an average difference in dose calculation between Acuros XB and AAA of 1.6%, with AAA predicting
higher dose than Acuros XB, for the muscle tissue (the lobular breast); while the difference for adipose tissue was
negligible. From histograms of the dose difference plans between AAA and Acuros XB (version 10), the dose of the
lung portion inside the tangential fields presented an average difference of 0.5% in the free breathing conditions,
increasing to 1.5% for the deep inspiration cases, with AAA predicting higher doses than Acuros XB. In lung tissue
significant differences are found also between Acuros XB version 10 and 11 for lower density lung.
Conclusions: Acuros XB, differently from AAA, is capable to distinguish between the different elemental
compositions of the body, and suggests the possibility to further improve the accuracy of the dose plans
computed for actual treatment of patients.
Keywords: Acuros, AAA, breast, inhomogeneity correction, tissue density
Background
Radiotherapy in the management of early stage breast
cancer after surgery contributes to a fundamental reduc-
tion of the risk of local relapse. From the dosimetric
point of view, the task of generating treatment plans of
high quality is challenged by the complex anatomy of
the thoracic district due to the neighbourhood of tissues
of highly different density, composition and homogene-
ity, especially the lungs with a density much lower than
the surrounding soft tissues. Taking benefit from geo-
metrical features, it has been proven [1,2] that for breast
treatment, the usage of specific respiratory gating
phases, namely deep inspiration, might be dosimetrically
beneficial. This because of the increased separation
between the heart and the chest wall which is maxi-
mized in that respiratory phase [1]. A second benefit
derived from the remarkable reduction of the density of
the lung pa renchym a, a fact that correlates to additional
dose reduction [3,4]. To assess the benefit from the sec-
ond featu re, it is necessary to perform dose calculations
with accurate algorithms, capable to properly model
* Correspondence:
Oncology Institute of Southern Switzerland, Medical Physics Unit, Bellinzona,
Switzerland
Fogliata et al. Radiation Oncology 2011, 6:103
/>© 2011 Fogliata et al; licensee BioMed Central Ltd. This is an Open Access article distributed under the terms of the Creative Commons
Attribution License ( which permits unrestricted use, distribution, and reproduction in
any medium, provided the original work is properly cited.
radiation transport in all media. It is nevertheless a fact
that most of the photon dose calculation engines have a
more or less limited accuracy in predicting dose in low
density media than in higher density tissues [5-7], espe-
cially those algorithms that use heavy approximations in
modelling the lateral electron transport (e.g. convolu-
tion/superposition methods).
To improve dose calcu lation in heterogeneous tissues,
some algorithms implemen t the possibility to account
for the specific elemental composition of the human
body. This is typically realised by associating the Houns-
field Units from the CT scans to a mass density and
material derived from customised and simplified conver-
sion tables where, for predefined density ranges, specific
elemental composition are assigned. In general the com-
position is taken from data repositories based on general
consensus as, for example, the ICRP Report 23 [8].
Algorithms capable to incorporate tissue composition in
the dose calculation mechanisms hav e an increased
accuracy in dete rmining the dose to each specific organ
[9,10]. In the case of breast treatments, beside the need
of properly modelling the lung tissue (with complex
composition and very low density at the same time
when deep inspiration breathing is considered), also
inhomogeneities in the region of the target volume
should be carefully modelled since the mammary gland
has a quite complex structure as well.
Aim of the present study is the assessment of the
dosimetric impact of a new dose calculation algorithm
on datasets from a cohort of real patients where a vari-
ety of different breast tissue densities and lung air filling
are in place.
The new algorithm under investigation is the Acuros
®
XB Advanced Dose Calculation (Acuros XB) as it is
implemented in the Eclipse treatment planning system
(Varian Medical Systems, Palo Alto, USA). This algo-
rithm belongs to the class of the Linear Boltzmann
Transport Equation (LBTE) solvers, allowing, similarly
to the classic Monte Carlo methods, for accurate model-
ling of dose deposition in heterogeneous media [11-13].
In the study, calculations performed with Acuros XB are
evaluated against the well known a nd validated An iso-
tropic Analytical Algorithm (AAA) similarly implemen-
ted in the Eclipse planning system [14-16].
Methods
A. Patient selection and planning techniques
CT data from 10 patients presenting left side breast car-
cinoma were selected for the study. For all patients two
scanning acquisition sets were available: the first leaving
the patient to normally breath (free breathing, FB), the
second obtained by scanning patients under maximum
inhale and breath hold condition during the whole CT
acquisition (deep inspiration breath hold, DIBH). Gating
and breath tracking during scanning were determined
by means of the Respiratory Gating RPM system (Varian
Medical System, Palo Alto, CA); adjacent slices with 5
mm thickness were acquired on a 16 slices scanner with
an acquisition time of the entire thorax region of about
8 seconds.
Both CT datasets were contoured, for each patient,
with planning target volume (PTV), left and right lungs,
heart, and contra lateral breast. PTV on the two CTs
were carefully drawn considering anatomical landmarks;
each pair of PTV volumes differed less than 5%.
Dose plans were computed for conventional conformal
techniques based on two tangential fields (a verage field
size of 18.9 ± 0.8 cm in the longitudinal direction and
11.1 ± 1.6 cm in the transversal direction) using 6MV
beams from a Varian Clinac equipped with a standard
80-leaf MLC; dynamic wedges (EDW) were used when-
ever needed. As a common strategy, a first plan, forward
optimized with trial and error procedure, was obtained
for the DIBH cases, and a second plan with the same
beam characteristics of gantry angles and wedges was
computed for each corresponding FB CT (adjusting
MLC shapes and beam weights if needed).
Dose prescription was set to 50 Gy at 2 Gy/fraction,
to the mean target dose.
B. Dose calculation algorithms
All plans (in number of two plans per each patient, for
FB and DIBH CT acquisitions respectively) were com-
puted with the following dose calculation algorithm s, all
implemented in the platform version 10 of the Eclipse
treatment planning system (Varian Medical System):
-AcurosXB:Acuros
®
XB Advanced Dose Calcula-
tion, version 10.0.28, the first version released for
clinical use.
-AcurosXB:Acuros
®
XB Advanced Dose Calcula-
tion, version 11.0.02, a pre-clinical engineering
release.
- AAA: Anisotropic Analytical Algorithm, clinical
version 10.0.28.
Calculation grid was set to 2.5 mm in all cases. All
AAA and Acuros XB plans were calculated for the same
number of MU.
Acuros XB algorithm solves numerically the Linear
Boltzmann Transport Equation (LBTE) which describes
the macroscopic behaviour of radiation particles as they
travel through and interact with matter. It allows, simi-
larly to the classic Monte Carlo methods, for accurate
modelling of dose deposition in heterogeneous media.
The original Acuros algorithm for external beams is
published by Vassiliev et al [13]. Its implementation in
Eclipse is briefly described in Fogliata et al [17].
Fogliata et al. Radiation Oncology 2011, 6:103
/>Page 2 of 11
Acuros XB implementation in Eclipse consisted on
two parts: the photon beam source model and the radia-
tion transport model. The first one was realised with the
same multiple source model already implemented in
Eclipse for AAA and was describ ed in detail in Tillikai-
nen et al [18]. Concerning the radiation transport
model, Acuros XB can calculate the dose to water or
dose to medium, accounting for the elemental composi-
tion of specific anatomical regions as derived by the CT
dataset. Tissue segmentation is automatically performed
based on density ranges derived from the HU values
read in the CT dataset of the patients. Table 1 reports
the correspondence matrix for the s egmentation from
density to human tissues for the two versions of Acuros
XB used in the s tudy. For each material, the specific
chemical elemental composition is based on the ICRP
Report 23 [8]. In addition, Acuros XB d oes not perform
automatic material assignment to any voxel that has an
HU value larger than the maximum HU value in the CT
calibration curve, or that has a mass density higher than
3.0 g/cm
3
. If CT dataset contains voxels that exceed
these limits, the user must create a structure and manu-
ally assign the material and mass density.
One of the main differences between the two ana-
lysed Acuros XB versions (10 and 11) is given by the
different strategy in the density-to-media assignment,
as shown in Table 1. With respect to version 10, ver-
sion 11 includes some refinements. Firstly, automatic
assignment of the Air material to very low density
regionsinsidebodywasimplemented. Secondly, the
density range per each material was slightly extended
with an overlap of densities between adjacent materi-
als. In the overlapping range, the elemental composi-
tion is considered as a proportional mixture of the
previous and next material. Note the large overlap
between cartilage and bone; for these two tissues, the
difference in calcium content plays a fundamental role
in the dose calculation phase (to medium and/or
water).
First validations of Acuros XB implementation in
Eclipse can be found in F ogliata et al [17] and in Bush
et al [19].
AAA is an analytical photon dose calculation algo-
rithm based on a pencil-beam convolution/superposition
technique; in the lateral scaling of the medium it applies
six independent exponential absorption functions to
account for the lateral transport of energy with varying
densities. The algorithm was originally founded on the
works of Ulmer et al [14,15,20], and Tillikainen et al
[16,18]. AAA was extensively validated against phantom
measured data [21-23], or mainly to focus on heteroge-
neity issues [6,24]. Readers should refer to Tillikainen et
al for detailed description [16].
C. Breast and lung densities
Since Acuros XB implemented tissue composition mod-
elling, some detailed f eatures of the two main tissues
involved in the clinical case under investigation are here
specified, reporting dose to medium.
Lung tissue
lung densities were compared for the two breathing
acquisitions, and comprehensive data can be found in
Fogliata et al [3]. For the cohort of patients in the pre-
sent study, the ratio between mean lung volumes in
DIBH and FB was 1.76 ± 0.20, and the average values of
HU were -826 ± 17 and -723 ± 35 for DIBH and FB
modes (p < < 0.0001 with a paired t-Student test),
respectively, corresponding to mean lung densities of
0.15 ± 0.02 and 0.26 ± 0.04 g/cm
3
.
Breast tissue
anatomically, the mammary gland consists of various
compartments, separated by adipose tissue; each com-
partment consists of smaller lobules composed of con-
nective tissue. From ICRP-89 [25] the glandular fraction
is assumed to be about the 40% of the entire breast. In
female, the breast composition (including glandular frac-
tion and adipose) presents lower carbon and higher oxy-
gen fractions than fat [25]. This different elemental
composition of glandular fraction and fat is reflected in
the muscle and adipose human materials [8,26].
D. Data evaluation
Analysis of dose calculations in lung tissue was per-
formed through dose plan differences between AAA and
Table 1 Material mass densities
Acuros XB vers. 10 Acuros XB vers. 11
Material Lowest Density Highest Density Lowest Density Highest Density
Air - - 0.000 0.0204
Lung 0.000 0.590 0.011 0.6242
Adipose Tissue 0.590 0.985 0.5539 1.001
Muscle, Skeletal 0.985 1.075 0.9693 1.0931
Cartilage 1.075 1.475 1.0556 1.600
Bone 1.475 3.000 1.100 3.000
Material mass densities in g/cm
3
for automatic material conversion, as implemented in the two Acuros XB versions.
Fogliata et al. Radiation Oncology 2011, 6:103
/>Page 3 of 11
thetwoAcurosXBversions,aswellasdifference
between the two Acuros XB versions, for both DIBH
and FB. In thi s context two lung sub-structures were
considered: Lung_IN and Lung_OUT (being Lung the
entire lung structure, that is also the union of Lung_IN
and Lung_OUT). Lung_IN is the lung portion falling
geometrically inside the projection of the edges of the
two tangential radiation fields. Lung_OUT is its comple-
ment, i.e. the portion of lung outside the field edges. It
is thus possible to analyse the behaviour of the algo-
rithms when primary radiation transport dominates or
where mostly scatteri ng shall be the dominant compo-
nent to dose deposition. Numerically, mean and stan-
dard deviations were recorded for Lung_IN, Lung_OUT
and Lung from dose difference plans for each patient in
DIBH and FB and then averaged over the whole patient
cohort. To better visualize the global pattern of differ-
ences, the average differential histograms relative to
dose difference plans for each structure were plotted in
the various conditions.
Fortargetbreastsofttissue,theanalysiswascon-
ducted aiming to appraise the difference in dose calcula-
tions in the two breast components, the one composed
by lobular breast tissue (segmented as Muscle tissue for
calculations), and th e one composed by fat (Adipose tis-
sue for calculations). To achieve this aim, two PTV sub-
structures were defined: PTV_musc and PTV_adip, the
first having density higher than 0.985 g/cm
3
,thesecond
lower than this value.
Numerical analysis of Dose Volume Histograms DVH
was performed for all difference plans couples: AAA -
Acuros XB version 10, AAA - Acuros XB version 11,
and Acuros XB version 10 - Acuros XB version 11. The
last couple aimed to demonstrate the impact of a more
sophisticated management of density to tissue
conversion.
To assess how different dose calculations for specific
lung density related to different air filling, or different
soft tissue composition is detectable in terms of clinical
appraisal using a different algorithm, comparisons were
performed through mean dose and V
x
values from
DVH, with × = 5, 10, 20, 40, 45 Gy. Some data compari-
son between DIBH and FB for the three lung structures,
and between PTV_musc and PTV_adip for PTV volume
were reported.
In the present paper the comparison between the two
algorithms would evidentiate both the differences arising
by the algorithm per se, and the usage in clinical cases
of the dose to medium (with the consideration of the
elemental composition as with Acuros XB), or dose to
water (indeed rescaled to water as with AAA). A fair
comparison between the two algorithms in the same
frame of dose calculation rescaled to water has been
published in Fogliata et al [27].
Results
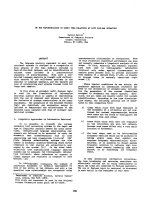
Figure 1 shows an example of an a xial view of a patient
with beam arrangement and contoured sub-structures is
presented, together with dose difference patterns.
A. Lung tissue
Results of the dose calculations for different lung density
in the two different lung regions are summarised in Table
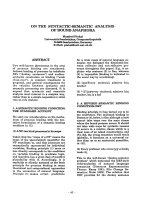
2 and in Figure 2. Table 2 re ports, for lung tissues, the
values of the mean and the standard deviation (average ±
SD and range over all the ten patients) of the histograms
of the dose difference plans between two calculations algo-
rithms, in particular AAA-Acuros11 and Acuros10-
Acuros11. Lung_IN and Lung_OUT structures were con-
sidered separately for the two air filling conditions of the
lung, i.e. FB and DIBH, not having the possibility to regis-
ter with a deformable algorithm structures and doses. Fig-
ure 2 reports the histograms averaged over all the patients,
for the two lung portions as well as for the entire lung, for
all the difference plans. Data shows a significant dose dif-
ference inside the field (Lung_IN) between AAA and
Acuros XB in the two air filling, being the average varia-
tion of 0.5% in the FB case (p < 10
-4
with a t-Student test),
value that increases to 1.5% in the DIBH case (p < 10
-4
with a t-Student test). AAA calculations predicts higher
dose than Acuros XB. Looking at the two Acuros XB ver-
sions, negligible difference of 0.2% is shown in the FB case,
while an average of 1.3% (p < 10
-4
with a t-Student test) is
obtained for the lower density case of lung, resulting in
higher dose computed by version 11. The difference arises
from the inclusion, in the list of materials, of the air for
very low density pixels (being pure ai r up to 0.011 g/cm
3
,
and a mixture of air and lung tissues from 0.011 to 0.0204
g/cm
3
), together with a more accurate calculation for very
low density lung, implemented in version 11 of Acuros
XB. On the contrary, the difference in dose calculations
outside the field (due to scattering) is negligible among all
algorithms and lung densities.
In Figure 2 the distribution of the dose differences is
shownalsofortheentirelungtissue.Duetotherather
small portion of lung volume included in the fields
(Lung_IN is 11 ± 3% for DIBH and 15 ± 4% for FB of
the whole l ung volume averaged over the ten analysed
patients), the systematic difference of the dose calcula-
tions would have been hidden if the entire volume was
used. From Figure 2 and Table 2 it is visible also the
rather large spread (standard deviation of the histo-
grams) of the difference between AAA and Acuros XB
in Lung_IN. This spread decreases between the two
Acuros XB versions, but only in the FB cases.
B. Soft tissue
The results of the analysis of the target volume and its
stratification in the two sub-structures PTV_musc and
Fogliata et al. Radiation Oncology 2011, 6:103
/>Page 4 of 11
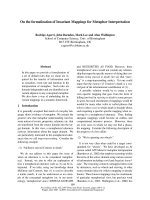
PTV_adip are reported in Table 2 and Figure 3, from
dose difference plan calculations. The PTV analysis is
reported only for DIBH cases. The FB cases were ana-
lysed as well, and the results were similar. From Table 2
the difference in dose calculation between AAA and
Acuros XB in muscle tissue is in average 1.6%, with
AAA predicting higher dose than Acuros XB. The same
metric for adipose tissue gives negligible differences
(0.2%). Between the two Acuros XB versions, almost no
difference is found (being in average within 0.2% for the
two tissue materials). This last absence of difference was
expected, because the mean dens ities of PTV_musc and
PTV_adip, of 1.013 and 0.954 g/cm
3
respectively, lie
well within the range of the corresponding material, and
almost no mixed tissue is considered in version 11.
From the histograms plotted in Figure 3, it is clear
that the systematic difference in d ose calculation in the
muscle tissue of the breast would have been hidden if
only the PTV was analys ed, as t he adipose tissue com-
posing the breast is in average, over the analysed
patients, 74% (ranging from 42 to 89%) of the whole
target.
C. Clinical appraisal from global DVH
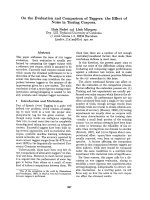
Results for the statistical parameters from DVH are
summarised in Table 3 (as mean values and standard
deviations over all patients) for PTV and its two compo-
nents, PTV_musc and PTV_adip, and for Lung and its
two components, Lung_IN and Lung_OUT. Plots of the
average cumulative histograms for DIBH cases are pre-
sented in Figure 4. If plans are compared only for the
entire lung and PTV, as generally done in clinical prac-
tice, AAA and Acuros XB would show minor differ-
ences. When the two subcomponents of the two main
struc tures are, analysed, the differences become relevant
also in term s of cumulative DVH. For example the shift
of DVH toward high doses is clear for PTV_musc and
Lung _IN. From statistics differences are visible for Lun-
g_IN calculations, where also the dif ference between the
two Acuros XB versions is evident for DIBH case s for
the V
40Gy
parameter. Regarding PTV, a significant differ-
ence between AAA and Acuros XB calculations is visi-
ble only in the two PTV sub-structures, where V95%
shows, for Acuros XB calculations, higher values in the
adipose tissue, and lower values in the muscle tissue.
a)
b)
c)
d)
Figure 1 Axial view of an example case: a) Lung_IN (light blue) and Lung_OUT (yellow) contours for lung; PTV_musc (pink) and PTV_adip
(red) contours for target breast; b) treatment technique of two tangential fields; c) dose distribution for Acuros XB version 10 calculations; d)
dose distribution for the plan difference AAA-Acuros10.
Fogliata et al. Radiation Oncology 2011, 6:103
/>Page 5 of 11
Discussion
The present study aimed to investigate the performance,
for a given clinical model, of the new Acuros XB algo-
rithm for photon dose calculations recently implemen-
ted in the Eclipse planning system, in comparison with
the commonly used AAA algorithm. Focus was put on
two main general criticalities. The first is the behaviour
of the algorithm in lungs when different air filling and
densi ty has to be considered due to different respiratory
conditions, i.e. FB and DIBH. The second is the capabil-
ity of the dose calculation engine to distinguish between
different types of soft tissues characterised by signifi-
cantly different chemical composition but anatomically
strongly interlaced: the lobular gland (muscle) and adi-
pose tissue, having different elemental composition in
terms of carbon and oxygen proportions.
The two photon dose calculation algorithms here ana-
lysed, implement totally different approaches, and, for
the subject o f the study, the main point is focussed to
the capability, for Acuros XB, to manage elemental
compositions of some predefined human tissues, and
therefore to calculate the dose to proper medium.
Those characteristics are not available in AAA, where
the calculation accounts only for the different densities
of the m aterials, but the dose is computed as dose to
density rescaled water. From Acuros XB validation in
water and in heterogeneous media [17,19,27], bench-
marked respectively against measurements and Monte
Carlo calculations, it has been shown that differences
between AAA and Acuros XB calculations can be inter-
preted as an improvement in acc uracy when using the
newer algorithm.
Considering the lung dose calculations, the difference
between algorithms was found in the region within the
two tangential fields. The greatest differences, as
expected, were found in the DIBH cases, pres enting the
lowest lung densities (0.15 g/cm
3
with respect to 0.26 g/
cm
3
in the same FB cases). In this region the AAA dose
overestimation is in average of 1.5% (with a maximum
value of 3.3% in the patient cohort). Presenting, on the
contrary, very negligible diffe rences in the region out of
the field between the two algorithms, the offset here
measured is generally not visible in the common prac-
tice of inspecting DVH. The same effect is the difference
of dose calculated in the muscle tissue of the breast, and
again not visible in common DVH analysis being the
muscle tissue only one fourth of the entir e target breast
volume. In this last case the 1.6% average overestimation
(maximum value 2.1%) of AAA calculation should be
read with a different approach: the mean dose to the
adipose tissue of the entire breast is very near to the
prescription dose, while the mean dose to the muscle
Table 2 Mean structure values of difference plans
AAA-Acuros11 Acuros10-Acuros11
Mean ± SD Range Mean ± SD Range
Lung Mean % 0.3 ± 0.2 [0.0, 0.7] -0.1 ± 0.2 [-0.4, 0.3]
DIBH Std.Dev. % 1.3 ± 0.2 [1.0, 1.5] 0.8 ± 0.2 [0.5, 1.1]
Lung_IN Mean % 1.5 ± 1.5 [-1.3, 3.3] -1.3 ± 1.1 [-3.5, 0.4]
DIBH Std.Dev. % 1.8 ± 0.4 [1.4, 2.8] 1.2 ± 0.3 [0.8, 1.7]
Lung_OUT Mean % 0.1 ± 0.1 [-0.1, 0.4] 0.0 ± 0.2 [-0.2, 0.3]
DIBH Std.Dev. % 1.0 ± 0.2 [0.8, 1.5] 0.6 ± 0.2 [0.4, 0.9]
Lung Mean % 0.3 ± 0.2 [-0.1, 0.7] -0.2 ± 0.2 [-0.6, 0.2]
FB Std.Dev. % 1.0 ± 0.2 [0.8, 1.4] 0.5 ± 0.2 [0.3, 0.9]
Lung_IN Mean % 0.5 ± 0.6 [-0.5, 1.5] -0.1 ± 0.6 [-0.9, 0.9]
FB Std.Dev. % 1.5 ± 0.1 [1.3, 1.6] 0.8 ± 0.2 [0.4, 1.1]
Lung_OUT Mean % 0.3 ± 0.2 [0.0, 0.5] -0.2 ± 0.2 [-0.5, 0.1]
FB Std.Dev. % 0.9 ± 0.3 [0.6, 1.4] 0.5 ± 0.2 [0.2, 0.8]
PTV Mean % 0.3 ± 0.7 [-0.9, 1.4] 0.1 ± 0.2 [-0.1, 0.6]
Std.Dev. % 2.7 ± 1.0 [1.6, 4.6] 1.5 ± 0.8 [0.8, 3.4]
PTV_muscle Mean % 1.6 ± 0.3 [1.1, 2.1] -0.1 ± 0.1 [-0.4, 0.1]
Std.Dev. % 1.4 ± 0.4 [1.1, 2.4] 1.0 ± 0.4 [0.5, 2.0]
PTV_adipose Mean % -0.2 ± 1.2 [-2.8, 1.3] 0.2 ± 0.3 [-0.1, 0.8]
Std.Dev. % 2.9 ± 1.2 [1.6, 5.2] 1.6 ± 0.9 [0.8, 3.7]
Mean and Standard Deviations parameters (in pe rcentage) of the differential DVH for AAA-Acuros11 and Acuros10-Acuros11 difference plans. Both parameters
are recorded as Mean ± SD and range for lung, PTV and their sub-structures. For lung contours, both DIBH and FB modes are reported, while for PTV contours
only DIBH is shown.
Fogliata et al. Radiation Oncology 2011, 6:103
/>Page 6 of 11
tissue, that is indeed the true mammary tissue, is lower
than prescription of almost 1 Gy for a common 50 G y
treatment. This means that, in the conformal treatment
with two tangential fields where no modulation is fore-
seen, and prescribing the treatment to the mean target
dose, a systematic underdosage of about 1 Gy of the
muscle-like tissue of the breast could be delivered due
to the difference in dose distribution (not necessarily in
dose calculation) in the two different breast compo-
nents. The specif ic amount o f the un derdosage and its
a
)
b)
FB
FB
DIBH
DIBH
FB
FB
DIBH
DIBH
Figure 2 Differential lung Dose-Volume Histograms of the difference plan: a) for FB (left) and DIBH (right), plots for the entire lung and the
two lung sub-structures; first row: AAA-Acuros version 10, second row: Acuros version 10-Acuros version 11. b) for FB (left) and DIBH (right), plots
for all dose difference plans; first row: Lung_IN structure, second row: Lung_OUT structure.
Fogliata et al. Radiation Oncology 2011, 6:103
/>Page 7 of 11
distribution within the breast is clearly depending on the
patient anatomy. To consider, on the o ther side, is that
the implemented table relating HU, mass density and
finally elemental composition of the patient body, is a
strong approximation of what could be the real compo-
sition of the patient. In principle this could result in
attributing the relativ e composition of components of
an organ (e.g., oxygen or carbon that presents rather dif-
ferent stopping power) that diverges from the actual
component, leading consequently to a calculated dose
that diverges from the actual dose absorbed by the real
tissue.
Summarising, even if with the commonly applied
methods of plan comparison based on DVH analysis
it is difficult to appraise significant differences
between AAA and Acuros XB, those can be estimated
by means of more detailed analysis of sub-structures
of a same volume characterised by different
Figure 3 Differential PTV Dose-Volume Histograms of the difference plan (DIBH mode only); first column: for each dose difference
plan the entire PTV and the two PTV sub-structures are plotted; second column for each PTV structure the three dose difference
plans are plotted.
Fogliata et al. Radiation Oncology 2011, 6:103
/>Page 8 of 11
compositions or dose intensity delivery. Once defined
the possible source of differences between dose calcu-
lation algorithms, it is possible to appreciate the
merit of using a highly sophisticated algorithms in the
clinical practice. The availability of commerci al algo-
rithms capable to discriminate amo ng different tissues
and chemical composition (although using pre-
defined and simplified segmentation methods) is of
primary importance in order to better understand the
dose that ca n actually be delivered to patien ts in ana-
tomical sites known to be inaccurately managed by
older algorithms.
Conclusions
Improvements in dose calculations with the usage of
sophisticated algorithms, and the possibility to account
for proper elemental compositions of the various tissues
of the human body allows a better knowledge of the
actual dose distribution inside the patient, which i n the
future could better describe the clinical outcome in par-
ticular situations. In particular, the possibility to better
compute the dose delivered to parts of specific organs,
as in the breast example where t he dose to the lobular
of fat tissues is systematically different due to their ele-
mental compositions, might make better understanding
of toxicities or treatment outcome arising from such
differences.
The availability of accurate algorithms give to the
community an improvement in the consistency between
actual and calculated treatment doses, a fact that can
have a clinical impact on the consistency of data in clin-
ical trials.
Table 3 DVH statistics
DIBH FB
AAA Acuros10 Acuros11 AAA Acuros10 Acuros11
Lung
Mean [Gy] 7.7 ± 1.5 7.5 ± 1.5 7.5 ± 1.5 9.2 ± 1.9 9.0 ± 1.9 9.0 ± 1.9
V10Gy [%] 18.2 ± 3.6 19.5 ± 3.7 19.0 ± 3.6 21.4 ± 4.6 21.9 ± 4.6 21.9 ± 4.6
V20Gy [%] 13.4 ± 3.4 13.7 ± 3.4 13.6 ± 3.4 16.9 ± 4.3 17.0 ± 4.3 17.0 ± 4.3
V40Gy [%] 8.9 ± 2.9 7.7 ± 2.9 8.2 ± 2.9 11.6 ± 3.5 11.2 ± 3.5 11.1 ± 3.5
Lung_IN
Mean [Gy] 43.0 ± 1.4 41.5 ± 1.7 42.0 ± 1.5 43.4 ± 0.9 43.1 ± 1.0 43.0 ± 1.0
V40Gy [%] 77.2 ± 5.8 66.3 ± 9.3 70.4 ± 7.6 78.6 ± 3.9 75.7 ± 4.9 75.2 ± 4.9
Lung_OUT
Mean [Gy] 3.1 ± 0.4 3.1 ± 0.4 3.0 ± 0.4 3.3 ± 0.4 3.0 ± 0.4 3.1 ± 0.4
V10Gy [%] 7.6 ± 1.2 9.0 ± 1.4 8.5 ± 1.3 7.9 ± 1.4 8.4 ± 1.5 8.4 ± 1.5
V20Gy [%] 2.2 ± 0.5 2.5 ± 0.5 2.4 ± 0.5 2.6 ± 0.8 2.7 ± 0.8 2.7 ± 0.8
PTV
Mean [Gy] 50.0 ± 0.0 49.9 ± 0.3 49.9 ± 0.3 50.0 ± 0.0 49.9 ± 0.3 49.9 ± 0.3
St. Dev. [Gy] 2.8 ± 0.6 2.4 ± 0.5 2.5 ± 0.6 2.4 ± 0.3 2.1 ± 0.2 2.2 ± 0.2
V90% [%] 95.2 ± 2.3 97.8 ± 1.6 97.3 ± 1.8 96.0 ± 1.9 98.7 ± 0.9 98.3 ± 1.0
V95% [%] 87.4 ± 3.0 88.2 ± 2.9 87.5 ± 2.8 87.8 ± 3.2 87.9 ± 2.9 87.2 ± 2.8
V107% [%] 5.0 ± 2.1 5.2 ± 2.1 4.7 ± 2.0 3.2 ± 1.3 3.8 ± 2.1 3.4 ± 2.0
PTV_adip
Mean [Gy] 49.8 ± 0.4 50.2 ± 0.3 50.1 ± 0.3 49.8 ± 0.5 50.1 ± 0.3 50.0 ± 0.3
St. Dev. [Gy] 2.9 ± 0.7 2.5 ± 0.6 2.6 ± 0.6 2.6 ± 0.5 2.1 ± 0.3 2.2 ± 0.4
V90% [%] 93.7 ± 3.6 97.9 ± 1.4 97.2 ± 1.7 94.3 ± 4.3 98.5 ± 1.1 98.1 ± 1.5
V95% [%] 86.1 ± 6.6 91.0 ± 1.0 90.0 ± 1.2 86.0 ± 7.4 90.0 ± 2.3 89.4 ± 2.6
V107% [%] 4.8 ± 2.3 6.2 ± 2.6 5.6 ± 2.4 3.4 ± 1.9 5.0 ± 3.5 4.4 ± 3.1
PTV_musc
Mean [Gy] 50.0 ± 0.8 49.1 ± 0.9 49.1 ± 0.9 50.0 ± 0.8 49.0 ± 0.8 49.1 ± 0.8
St. Dev. [Gy] 2.1 ± 0.4 2.2 ± 0.4 2.2 ± 0.4 1.9 ± 0.4 2.1 ± 0.4 2.0 ± 0.4
V90% [%] 99.4 ± 0.8 97.8 ± 2.4 97.8 ± 2.3 99.8 ± 0.2 98.6 ± 2.1 98.7 ± 2.0
V95% [%] 85.3 ± 12.6 72.6 ± 19.6 72.9 ± 19.8 86.4 ± 10.2 70.7 ± 19.1 71.1 ± 19.2
V107% [%] 5.5 ± 2.6 2.4 ± 1.5 2.2 ± 1.6 3.6 ± 3.4 1.5 ± 1.9 1.3 ± 1.8
Statistics for lung and PTV structures in DIBH and FB modes, from all three analysed algorithms and versions.
Fogliata et al. Radiation Oncology 2011, 6:103
/>Page 9 of 11
Acknowledgements
The present work was partially supported by a Grant from Varian Medical
Systems, Palo Alto, CA, USA.
The authors thank the whole Varian Medical System group in Helsinki,
Finland, especially Stephen Thompson, Pekka Uusitalo, Tuomas Torsti, Laura
Korhonen, Viljo Petaja for the fruitful discussions during the evaluation phase
of the Acuros XB algorithm.
Authors’ contributions
AF: study coordination, data analysis, manuscript preparation. GN, EV, AC:
data analysis. LC: study coordination, manuscript preparation. All authors
read and approved the final manuscript.
Competing interests
Dr. L. Cozzi acts as Scientific Advisor to Varian Medical Systems and is Head
of Research and Technological Development to Oncology Institute of
Southern Switzerland, IOSI, Bellinzona.
No special competing interest exists for any other author.
Received: 5 July 2011 Accepted: 26 August 2011
Published: 26 August 2011
References
1. Korreman S, Pedersen AN, Nøttrup TJ, Specht L, Nyström H: Breathing
adapted radiothera py for breast cancer: compa rison of free breathing
Figure 4 Cumulative average DVH of the three lung and PTV structures for the three analysed dose calculation algorithms, for DIBH
mode cases.
Fogliata et al. Radiation Oncology 2011, 6:103
/>Page 10 of 11
gating with the breath-hold technique. Radiother Oncol 200 5,
76:311-318.
2. Pedersen AN, Korreman S, Nyström H, Specht L: Breathing adapted
radiotherapy of breast cancer: reduction of cardiac and pulmonary
doses using voluntary inspiration breath-hold. Radiother Oncol 2004,
72:53-60.
3. Fogliata A, Nicolini G, Vanetti E, Clivio A, Winkler P, Cozzi L: The impact of
photon dose calculation algorithms on expected dose distributions in
lungs under different respiratory phases. Phys Med Biol 2008,
53:2375-2390.
4. Yorke ED, Wang L, Rosenzweig KE, Mah D, Paoli JB, Chui CS: Evaluation of
deep inspiration breath-hold lung treatment plans with Monte Carlo
dose calculation. Int J Radiat Oncol Biol Phys 2002, 53:1058-1070.
5. Aspradakis MM, Morrison RH, Richmond ND, Steele A: Experimental
verification of convolution/superposition photon dose calculations for
radiotherapy treatment planning. Phys Med Biol 2003, 48:2873-2893.
6. Fogliata A, Vanetti E, Albers D, Brink C, Clivio A, Knöös T, Nicolini G, Cozzi L:
On the dosimetric behaviour of photon dose calculation algorithms in
the presence of siimple geometric heterogeneities: comparison with
Monte Carlo calculations. Phys Med Biol 2007, 52:1363-1385.
7. Knöös T, Wieslander E, Cozzi L, Brink C, Fogliata A, Albers D, Nyström H,
Lassen S: Comparison of dose calculation algorithms for treatment
planning in external photon beam therapy for clinical situations. Phys
Med Biol 2006, 51:5785-5807.
8. International Commission on Radiological Protection: International
Commission on Radiological Protection: Reference Man: Anatomical,
Physiological and Metabolic Characteristics. Elsevier; 1975, 512.
9. Dogan N, Siebers JV, Keall PJ: Clinical comparison of head and neck and
prostate IMRT plans using absorbed dose to medium and absorbed
dose to water. Phys Med Biol 2006, 51:4967-4980.
10. Siebers JV, Keall PJ, Nahum AE, Mohan R: Converting absorbed dose to
medium to absorbed dose to water for Monte Carlo based photon
beam dose calculations. Phys Med Biol 2000, 45:983-995.
11. Wareing TA, McGhee GM, Morel JE, Pautz SD: Discontinuous Finite
Element SnMethods on Three-Dimensional Unstructured Grids. Nucl Sci
Engr 2001, 138:256-268.
12. Vassiliev O, Wareing T, Davis I, McGhee J, Barnett D, Horton J, Gifford K,
Failla G, Titt U, Mourtada F: Feasibility of a multigroup deterministic
solution method for three-dimensional radiotherapy dose calculations.
Int J Radiat Oncol Biol Phys 2008, 72:220-227.
13. Vassiliev O, Wareing T, McGhee J, Failla G, Salehpour M, Mourtada F:
Validation of a new grid based Blotzmann equation solver for dose
calculation in radiotherapy with photon beams. Phys Med Biol 2010,
55:581-598.
14. Ulmer W, Harder D: A triple gaussian pencil beam model for photon
beam treatment planning. Z Med Phys 1995, 5:25-30.
15. Ulmer W, Harder D: Applications of a triple gaussian pencil beam model
for photon beam treatment planning. Z Med Phys 1996, 6:68-74.
16. Tillikainen L, Helminen H, Torsti T, Siljamäki S, Alakuijala J, Pyyry J, Ulmer W:
A 3D pencil-beam-based superposition algorithm for photon dose
calculation in heterogeneous media. Phys Med Biol 2008, 53:3821-3839.
17. Fogliata A, Nicolini G, Clivio A, Vanetti E, Mancosu P, Cozzi L: Dosimetric
validation of Acuros XB Advanced Dose Calculation algorithm:
fundamental characterization in water. Phys Med Biol 2011, 56:1879-1904.
18. Tillikainen L, Siljamäki S, Helminen H, Alakuijala J, Pyyry J: Determination of
parameters for a multiple-source model of megavoltage photon beams
using optimization methods. Phys Med Biol 2007, 52:1441-1467.
19. Bush K, Gagne IM, Zavgorodni S, Ansbacher W, Beckham W: Dosimetric
validation of Acuros XB with Monte Carlo methods for photon dose
calculations. Med Phys 2011, 38:2208-2221.
20. Ulmer W, Kaissl W: The inverse problem of a gaussian convolution and
its application to the finite size of the measurement chambers/detectors
in photon and proton dosimetry. Phys Med Biol 2003, 48:707-727.
21. Fogliata A, Nicolini G, Vanetti E, Clivio A, Cozzi L: Dosimetric validation of
the anisotropic analytical algorithm for photon dose calculation:
fundamental characterization in water. Phys Med Biol 2006, 51:1421-1438.
22. Bragg CM, Conway J: Dosimetric verification of the anisotropic analytical
algorithm for radiotherapy treatment planning. Radiother Oncol 2006,
81:315-323.
23. van Esch A, Tillikainen L, Pyykkonen J, Tenhunen M, Helminen H,
Siljamäki S, Alakuijala J, Paiusco M, Iori M, Huyskens DP: Testing of the
analytical anisotropic algorithms for photon dose calculation. Med Phys
2006, 33:4130-4148.
24. Aarup LR, Nahum AE, Zacharatou C, Juhler-Nøttrup T, Knöös T, Nyström H,
Specht L, Wieslander E, Korreman SS: The effect of different lung densities
on the accuracy of various radiotherapy dose calculation methods:
implications for tumour coverage. Radiother Oncol 2009, 91:405-414.
25. International Commission on Radiological Protection: ICRP Publication 89,
Basic anatomical and physiological data for use in radiological protection
reference values New York; 2002.
26. Schneider U, Pedroni E, Lomax A: The calibration of CT Hounsfield units
for radiotherapy treatment planning. Phys Med Biol 1996, 41:111-124.
27. Fogliata A, Nicolini G, Clivio A, Vanetti E, Cozzi L: Dosimetric evaluation of
Acuros XB Advanced Dose Calculation algorithm in heterogeneous
media. Radiat Oncol 2011, 6:82.
doi:10.1186/1748-717X-6-103
Cite this article as: Fogliata et al.: On the dosimetric impact of
inhomogeneity management in the Acuros XB algorithm for breast
treatment. Radiation Oncology 2011 6:103.
Submit your next manuscript to BioMed Central
and take full advantage of:
• Convenient online submission
• Thorough peer review
• No space constraints or color figure charges
• Immediate publication on acceptance
• Inclusion in PubMed, CAS, Scopus and Google Scholar
• Research which is freely available for redistribution
Submit your manuscript at
www.biomedcentral.com/submit
Fogliata et al. Radiation Oncology 2011, 6:103
/>Page 11 of 11