Báo cáo khoa học: "Delineation in thoracic oncology: a prospective study of the effect of training on contour variability and dosimetric consequences" potx
Bạn đang xem bản rút gọn của tài liệu. Xem và tải ngay bản đầy đủ của tài liệu tại đây (1.17 MB, 24 trang )
This Provisional PDF corresponds to the article as it appeared upon acceptance. Fully formatted
PDF and full text (HTML) versions will be made available soon.
Delineation in thoracic oncology: a prospective study of the effect of training on
contour variability and dosimetric consequences.
Radiation Oncology 2011, 6:118 doi:10.1186/1748-717X-6-118
Sylvain Dewas ()
Jean-Emmanuel Bibault ()
Pierre Blanchard ()
Claire Vautravers-Dewas ()
Yoann Pointreau ()
Fabrice Denis ()
Michel Brauner ()
Philippe Giraud ()
ISSN 1748-717X
Article type Research
Submission date 11 May 2011
Acceptance date 19 September 2011
Publication date 19 September 2011
Article URL />This peer-reviewed article was published immediately upon acceptance. It can be downloaded,
printed and distributed freely for any purposes (see copyright notice below).
Articles in Radiation Oncology are listed in PubMed and archived at PubMed Central.
For information about publishing your research in Radiation Oncology or any BioMed Central journal,
go to
/>For information about other BioMed Central publications go to
/>Radiation Oncology
© 2011 Dewas et al. ; licensee BioMed Central Ltd.
This is an open access article distributed under the terms of the Creative Commons Attribution License ( />which permits unrestricted use, distribution, and reproduction in any medium, provided the original work is properly cited.
Delineation in thoracic oncology: a prospective study of the effect of
training on contour variability and dosimetric consequences.
Sylvain Dewas
1-2
, Jean-Emmanuel Bibault
1-2
, Pierre Blanchard
2-3
, Claire Vautravers-Dewas
2-4
, Yoann
Pointreau
2-5
, Fabrice Denis
6
, Michel Brauner
7
, Philippe Giraud
8
1
Département universitaire de Radiothérapie, Centre Oscar Lambret, Université Lille II, Lille, France
2
Société Française des jeunes Radiothérapeutes-Oncologues (SFjRO), Paris, France
3
Département Universitaire de Radiothérapie, Institut Gustave Roussy, Villejuif, France
4
Département universitaire de Radiothérapie, Centre Georges François Leclerc, Dijon, France
5
Clinique d’Oncologie radiothérapie, Centre Henry S Kaplan, CHU Bretonneau, Tours, France
6
Association pour la Formation Continue en Oncologie-Radiothérapie (AFCOR), Paris, France
7
Service de radiologie, Université Paris 13, Hôpital Avicenne, Assistance Publique-Hôpitaux de Paris, Bobigny,
France
8
Université Paris Descartes, service d’Oncologie Radiothérapie, Hôpital Européen Georges Pompidou, Paris,
France
S. Dewas :
J E. Bibault :
C. Vautravers-Dewas :
P. Blanchard :
Y. Pointreau :
F. Denis :
M. Brauner :
P. Giraud :
Corresponding author:
Sylvain DEWAS
CLCC Oscar Lambret
Departement of Radiotherapy
3 rue Frederic Combemale
BP 307 59 020 Lille cedex, France
Tel: 33. (0)3.20.29.59.11, fax: 33. (0)3.20.29.59.72
Abstract:
Introduction :
As part of French residents’ radiotherapy training, delineation workstations were available at a national teaching
course. We report a prospective comparative study of a non small cell lung cancer (NSCLC) case delineated by
120 residents before and after a radioanatomy/radiotherapy lecture.
Material and methods :
The case of a patient with right upper lobe non small cell lung cancer (NSCLC) was provided for delineation to
32 groups of residents before and after a radiation therapy lecture about thoracic delineation. GTV, CTV and
PTV was asked to each group. In a second step, the GTV, CTV and PTV were compared with those of 9 groups
of senior physicians. Finally the consequences for treatment planning between each group before and after the
course were explored.
Results :
The expert’s average GTV, CTV and PTV were 89.1cm
3
, 242.3 cm
3
and 293.9 cm
3
respectively. For residents,
those volumes were 103.4cm
3
, 242.3 cm
3
and 457.9 cm
3
before teaching, compared to 99.5cm
3
, 224.2 cm
3
and
412.5 cm
3
after teaching. The overlap (OV) and kappa (KI) indices before and after education were respectively
0.58 and 0.73. Compared to senior physicians, OV and KI indices were lower in the residents group (p=0.039
and p=0.043). An increased dose to the lung is noted for the residents’ dosimetry compared to the experts’ (V20:
23.2% versus 36.5%) due to the larger PTV delineated. No significant difference was observed for other organs
at risk.
Conclusion :
There were no significant differences for the delineation of the GTV and CTV before and after the course,
although the differences tended to decrease after the course. The good initial quality of the contours could
explain the lack of difference. V20 for lung was higher in the residents group compared to the experts group
(23.2% vs 36.5%). No other treatment planning consequences were observed for other critical organs.
Key words:
Lung cancer, volume delineation, education, conformal radiotherapy, inter-observer variability
3
INTRODUCTION:
The variability among radiation-oncologists in the delineation of GTV for lung cancer has already been
described [1-4]. These variations are a major source of error in the planning and execution of radiotherapy.
However, few studies are available regarding the effect of training of radiotherapy residents on this variability
[5]. This question is pertinent at the moment because of recent developments in radiation therapy using
optimized radiation dose distributions, which allow greater precision in delivering and repositioning in order to
increase the total dose delivered to the target volume [6-8]. Consequently, the delineation of the different target
volumes should have the same precision as these new technologies. Inaccurate contouring leads to incorrect
dosimetry, and poor quality treatment results in lower tumor control and increased toxicity [3].
During the national training of French radiotherapy residents, a comparison of residents’ delineation of the same
clinical case of non small cell lung cancer (NSCLC) was proposed, before and after a teaching course on
radioanatomy and radiotherapy techniques of lung cancer irradiation. We evaluated the influence of the teaching
course on the variability of the residents’ outlines and their conformity to a "reference" delineation
(corresponding to the clinically used contours). We then analyzed the dosimetric effect of the variability. The
same clinical case had also been delineated in a previous session by senior physicians whose delineations have
also been compared with the residents’ ones.
METHODS:
Objectives:
The objective of this study was to search for differences in delineation between the residents and the experts
before and after a radiation therapy course about thoracic volumes definition. Volumes (GTV, CTV and PTV),
indices (VR, CDV, ADV, KI and OV) and treatment planning were compared.
Population:
One hundred and twenty eight French residents attended a national course on radioanatomy organized in Paris at
the European Hospital Georges Pompidou in 2009. These courses are held every four years to teach new imaging
techniques and different delineation recommendations for the main tumor locations. For the first time, 8
delineation workstations were made available for practice sessions on real clinical cases. The 128 residents were
divided into 32 mixed groups of 4 (31, 25, 28, 19 and 17 residents respectively in 5th, 4th, 3rd, 2nd and 1st year
4
of training). In order to evaluate the effect of training with respect to the delineation recommendations, a clinical
case of NSCLC was chosen. This case represents a common location with many, and typical, technical
difficulties for residents.
The same clinical case was previously contoured under similar conditions by 9 groups of senior radiation
oncologists during a training course organized by the Association for Continuing Education in Oncology-
Radiotherapy (AFCOR, Association de Formation Continue en Oncologie Radiothérapie). These results were
compared with those of the residents.
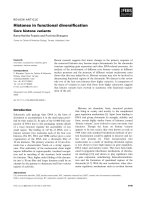
Clinical case presentation:
The clinical case involved a male, age 67, with tobacco consumption estimated at 40 pack-years, no medical or
surgical history, and no asbestos exposure. The evaluation of a chronic progressive cough persisting > 3 months
demonstrated an opacity in the right upper lobe. Bronchoscopy found a stenosing lesion in the right
upper lobe bronchus and biopsy samples revealed a squamous cell carcinoma. The CT scan found a voluminous
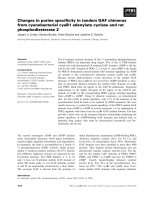
chest lesion measuring 64 mm in diameter at the origin of the right upper lobe. Multiple nodes were found in
Barety’s space, the pre-aortic space, and the left internal mammary nodes (Figure 1). Overall, it was classified
T2N3M0. After three cycles of chemotherapy combining Cisplatin and Vinorelbine, concomitant radio-
chemotherapy with the same chemotherapy and a deep inspiration breath hold technique (SDX, Dyn’R, Muret,
France) was proposed to the patient because of the tumor stability. A pre-chemotherapy PET-CT fusion was
available (Figure 1). Contrast enhancement was used for the treatment planning CT Scan, without breathhold or
4D.
Education and delineation:
This case was presented and delineated by students before and after a theoretical course provided by two lung
cancer experts. The first one-hour lecture, conducted by a senior radiologist, covered radio-thoracic anatomy
(MB). The second one-hour lecture, taught by a senior radiotherapist, also dealt with irradiation techniques, with
emphasis on the recommended volumes, processing techniques, and dose and margins to respect; all
recommendations were based on the literature (PG). No discussion about the clinical case presented was made
during the lectures by any of the two teachers. The delineation was made independently by each group of
students with ARTIVIEW™ software (AQUILAB®, Lille, France). The initial diagnostic CT scan, the initial
5
PET-CT scan and the PET fusion with the planning CT scan were available to the residents. The software
employs standard delineation tools (pen, brush, multislice interpolation ). The residents could modify the image
contrast and sagittal or coronal reconstructions as needed.
For each delineation session, the residents were asked to draw the GTV on the CT scan. Each group then had to
prescribe margins to the GTV (by 3D isotropic geometric expansion) in order to obtain the clinical target volume
(CTV), and then the planning target volume (PTV). The prescribed dose to the PTV was also collected. Among
the 128 residents registered, 120 students participated in the two contouring sessions. Thirty evaluable groups
were compared before and after the course. Each group consisted in four residents from different training years
in order to have homogeneous groups. Delineation practice lasted 15 minutes for each group.
Methods of comparison:
I - Volume comparison: The evaluation of the variability of contours was benchmarked using a "reference"
contour (delineated by the expert who provided the clinical case PG). ARTIVIEW™ software was used to
evaluate and compare the contours, both qualitatively and quantitatively.
For the first step, each target volume submitted by each group of students (GTV, CTV and PTV) was compared
with the reference volume proposed by the expert. In the second step, different indices reflecting the correlation
of the volume with the “expert reference contour” for all volumes were calculated [9-12]. The CTV was obtained
by a geometric expansion of the GTV and the PTV was a geometric expansion of the CTV. Groups had no
instructions regarding the size of the margins to apply. The observers were not allowed to adapt the CTV to the
natural anatomical borders of tissue,
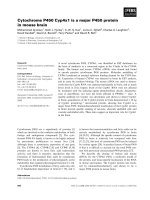
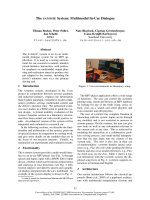
The first family of indices is based on volume ratios: the volume ratio (VR) between the volume of the student
and the volume of the expert, the common delineated volume (CDV) and the additional delineated volume
(ADV). Then, the kappa index (KI) and the overlap volume (OV) were calculated (Figure 2). The last step
consisted of an analysis of variance between pre and post-course delineated volumes.
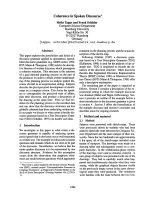
II - Treatment planning comparison: The dose was calculated using the Oncentra®
Collapsed Cone algorithm. The dosimetric effect of this variation in delineation was also analyzed. The group
with the lowest conformal indices (KI and OV) at the end of the course, i.e. the most divergent, was studied and
a treatment plan was calculated for this group. This plan was then compared with the treatment plan developed
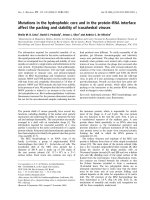
with the reference contours. The calculated dosimetric indices were the RTOG coverage index (CO), the RTOG
6
homogeneity index (HI), the RTOG conformity index (CI), the target coverage index (TCO) and the organs at
risk (OAR) coverage index (OCO) [9-12]. The CO Index is the ratio of the minimum dose delivered in 98% of
the volume of interest and the reference prescribed dose (Figure 3).
III - Comparison with senior physicians: In the last step, the GTV outlines (before and after the
course) made by residents were compared to the GTV delineated by senior physicians during a previous session
on lung cancer organized by AFCOR. This delineation had been done under exactly the same conditions, with
the same tools and the same clinical information as the residents; the contours were done after a training session
on lung radiation similar to that taught to residents (PG). The same indices were calculated in order to compare
the GTV of residents and senior physicians.
Statistical Analysis:
Delineation evaluation was conducted prospectively and comparatively. Statistical analysis was performed with
SPSS 13.0 (SPSS. Inc., Chicago, Ill., USA). Comparison between the volume obtained (residents and senior
physicians) and the expert’s volume was done with the Student t-test. Comparative analysis of indices before and
after the course was done with the Student t-test for paired samples. The variance of the different volumes was
compared by ANOVA. A P-value <.05 was considered statistically significant.
RESULTS:
I - Volume comparison:
The GTV delineated by the expert was measured at 89.1 cm
3
and extended 6.5 cm on the vertical plane. The
average GTV volume delineated by the students before the course was 103.4 cm
3
(range of 59.9 to 215.2 cm
3
),
significantly different from that of the expert (p = 0.02). After the course, it was 99.5 cm
3
, not significantly
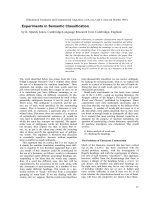
different from that of the expert (39.7 to 202.3, p = 0.09) (Figure 4). The average height of the GTV contoured
by residents was 5.8 cm (3.5 to 6.5 cm) before the course and 5.9 cm (4.5 to 8 cm in height) after the course
(NS). The mass in the left internal mammary nodes was not considered to be pathological by the expert because
there was no PET fixation. This opinion had been explained during the course by the expert; it was considered
7
possible residual thymic tissue. Three groups incorrectly delineated the residual thymic tissue before the training
and only one group after training.
The CTV was obtained by a geometric expansion of the GTV. The median margin required by the students was
6 mm prior to the course (5 to 10 mm) and was 6 mm (5 to 6 mm) after the course. The expansion margin
required by the expert was 6 mm.
13
The volume of the CTV obtained by the expert was 214.3 cm
3
. The average
volume of the CTV for the residents was 242.3 cm
3
(162.9 to 495.7 cm
3
) before the course. After the course, the
average volume of CTV was 224.2 cm
3
(110.3 to 385.2 cm
3
). The two volumes were not significantly different
from the expert’s (respectively p = 0.065 and p = 0.38) although the differences tended to decrease after the
course.
The median margin required by students for the geometric expansion of the CTV to PTV was 7 mm prior to the
course (3 to 15 mm) compared to 5 mm (3 to 15 mm) after the course. The expansion margin required by the
expert was 5 mm, using a respiratory gating technique (deep inspiration breath hold). The PTV volume obtained
by the expert was 293.9 cm
3
. The average PTV volume of the students before the course was 457.9 cm
3
(248.5 to
1011.3 cm
3
), different from the expert’s (p <0.001), compared to 412.5 cm
3
after the course (196.4 to 645.7
cm
3
), different from the expert’s (p <0.001).
In terms of the calculated indices, no significant difference was found before and after the course for GTV (table
1) or for CTV and PTV. The analysis of variance (ANOVA) before and after the course was not significantly
different. This result was previously published in another study [13].
8
II - Effect of contour variability on the treatment plan:
The expert recommended a dose of 66 Gy to the PTV. The mean dose prescribed by the residents before the
course was 66.16 Gy (60 to 70 Gy) compared to 66.5 Gy (64 to 70 Gy) after the course. No significant difference
was found. Two dosimetries were then constructed: the first using the contour of the expert, the second the
contour from the group with the lowest indices of OV (0.39) and KI (0.56). The indices for the tumor obtained
by the expert were 1.05 for the coverage index (optimum 1), 1.05 for homogeneity index (optimum 1), 0.58 for
conformity index (optimum 1) and 54.1% for the target coverage index (optimum 100%). For the group of
residents, they were respectively 1.04, 1.04, 0.51 and 45.6%. The treatment plan of the resident group with the
lowest OV and KI indices was applied on the contours of the expert. Then, the different indices for the tumor
became: 1.04, 1.04, 1 and 53%.
The study of the dosimetric effect on organs at risk was also performed for both treatment plans. The dose-
volume histograms are shown in Figure 5. The calculation for OCO (OAR coverage index) was made using a
dose of 20 Gy to the lungs, 40 Gy to the heart, 55 Gy to the esophagus, and 45 Gy to the spinal cord. The OCO
factor for the expert was 23.2% (max dose 66.6 Gy) to the lungs (i.e. V20 = 23.2%), 1.40% (max dose 44.5 Gy)
to the heart, 23.3% (up to 65.7 Gy) to the esophagus and 0% (max dose 28.9 Gy) to the spinal cord. For the
group of residents, it was respectively 36.5% (max dose 67.5 Gy), 15.4% (max dose 67.3 Gy), 38.9% (max dose
65.2 Gy) and 0% (max dose 34.9 Gy). An increased dose to the lung is noted for the residents’ dosimetry (V20:
23.2% versus 36.5%) due to the larger PTV delineated. No significant difference was observed for other organs
at risk.
III - Comparison with senior physicians:
Nine GTVs delineated by senior radiation oncologists were also available from a previous course. The average
GTV volume was 96.9 cm
3
(68.5 to 124.6 cm
3
), not significantly different from the expert (p = 0.2). The
different indices obtained by the seniors compared to the expert were for the volume ratio 1.08 (0.77 to 1.4, CI
95%: 0.93-1.24), 81.3% (69.7 to 88.7%, CI 95%: 76.2-86.3) for the common delineated ratio, 23.9% (9.4 to
36.7%, CI 95%: 17.4-30.4) for the additional delineated volume, 0.64 (0.58 to 0.71, CI 95%: 0.61-0.67) for the
overlap volume and 0.78 (0.74 to 0.83, CI 95%: 0.76-0.8) for the kappa index. Comparison of volumes and GTV
indices with those of residents before the course was: 96.9 cm
3
compared to 103.4 cm
3
(NS) for the volume of
the GTV, 1.08 compared to 1.16 (NS) for the VR, 81.3 % compared to 78.4 % (NS) for the CDV, 23.9 %
9
compared to 28.8 % (NS) for the ADV, 0.64 compared to 0.58 (p = 0.045) for the OV, and 0.78 compared to
0.73 (p = 0.049) for the KI. After the course, the GTV was 99.5 cm
3
for the residents compared to 96.9 cm
3
for
the senior physicians (NS). The difference between residents and physicians for OV and KI was 0.06 (p = 0.047)
and 0.05 (p = 0.05). No significant difference was noted for the VR, CDV and ADV. The global OV and KI
indices (mean before and after the course) compared to the senior physician’s delineation were always lower in
the residents group (respectively, p = 0.039 and p = 0.043). The study of the distribution showed a lower
variance among physicians than among residents for OV and KI (p = 0.039 and p = 0.043). Residents had, more
frequently than senior physicians, an OV under 0.6 (p = 0.03), and senior physicians had significantly more often
a KI greater than 0.75 (p = 0.03).
DISCUSSION:
This study showed a non-significant trend in improved delineations after a teaching course among residents.
However, the very high quality of the initial delineations could explain the lack of significant progress after
teaching. Another explanation for this could be the short period of time available for each delineation (15
minutes) that could limit the variations of volumes. Moreover, the fact that several residents discussed together
in order to reach an agreement, inside their groups, about the volumes that needed to be treated could explain the
homogeneity and the good quality of the contours. One could think that a single resident/group would increase
errors thus decreasing the overall quality of the contours. Another possible explanation would be that residents
were not allowed to adapt the CTV to the natural anatomical borders of tissue, decreasing even more the
variability between observers.
The GTV delineation tended to decrease at the end of the course, from an initial 103.4 to 99.49 cm
3
. The
difference compared to the expert’s delineation was significant prior to the course (p = 0.02), but was no longer
found after the course, reflecting an improvement in the residents’ delineation. This decrease in volume was also
found for the PTV (457, compared to 412 cm
3
after the course), linked both to the decrease of the delineated
GTV volume and the margin expansion prescribed by the residents. The reduction of these margins could be
related to the course, which clarified the delineation using matched CT-PET, and addressed the principles and
advantages of the treatment technique (respiratory gating) and better knowledge of thoracic anatomy [3,14].
Guidelines in lung cancer delineation have long been known [15-17]. Lung cancer, like head and neck, is often
10
used as an example in teaching. These guidelines are often used by residents during their practice training, which
could explain the very high quality of the initial delineation.
We have previously demonstrated, using the delineation of 9 radiologists and 8 radiation oncologists, that
resident physicians, regardless of their specialty, also tend to delineate smaller and more homogeneous volumes
than senior physicians, especially for 'difficult' cases [3]. In order to confirm these results, a comparison of
delineated volumes between residents and senior physicians was conducted. The physicians’ contours seemed
better than those of residents, both for volumes and inter-comparison indices. The variance was also lower,
indicating better reproducibility of the delineations, probably related to experience. The delineations made by
residents after the theoretical course were closer to those of senior physicians, reflecting the necessity of training.
Delineation variations are a source of error in the planning and execution of radiotherapy.
Regarding the treatment planning consequences of the variability of the delineation, we found a difference for
V20 for the lung between the experts and the residents (23.2% vs 36.5%). This difference could be explained by
the margins applied to obtain the PTV (7 mm before vs 5 mm after the course). The subsequent PTV volume
was higher before the course (457.9 cm
3
vs 412.5
cm
3
). Thus V20 was also higher with the contours created
before the course. This result shows the importance of the margins applied to the CTV to create the PTV to
better respect the dose constraints to the critical organs, the final aim of this being lower toxicity. However there
were no differences found for the other critical organs (esophagus, heart and spinal cord).
Delineation variability has already been analyzed, in prostate cancer [18-19], breast cancer [20], lung cancer
[15], and cervical cancer [21]. Optimizing delineation may be done in several ways. In clinical trials, clinical
reference cases and a "virtual patient" (dummy run) are available for radiation-oncologists to standardize their
delineation procedures. Quality assurance studies have been also carried out [22-24]. Another way to standardize
delineation is the creation of atlas support, available online or on paper. More and more locations are referenced,
including head-and-neck cancer [25], gynecological [26], prostate [19,27],
and lung cancer [15-16]. Based on
this principle, a delineation self-training website has also been introduced in France since October 2008
(www.siriade.org). This website is supported by AFCOR and the French Radiation Society (SFRO, Société
Française de Radiothérapie Oncologique). Therefore, the organization of seminars or training courses for
residents perfectly fits this logic, combining delineation teaching techniques and quality control. These courses
are held every four years and concern the main tumor locations. A study conducted by residents of Memorial
11
Sloan-Kettering Cancer Center in New York on a head-and-neck cancer case was published in 2008 [5]. Eleven
delineations were collected before and after a theoretical course. Delineation was improved after education. Our
study also demonstrates that incorporating a practical delineation workshop during training improves residents’
delineation. These two studies highlight the importance of practical and theoretical training in the curriculum of
radiation oncology residents.
CONCLUSION:
There were no significant differences before and after the course in the delineation of the GTV or CTV, although
the differences tended to decrease after the course. However a difference was observed for the PTV. V20 for
lung was higher in the residents group compared to the experts group (23.2% vs 36.5%). No other treatment
planning consequences were observed for other critical organs.
12
ETHICAL APPROVAL AND CONSENT
Not applicable
COMPETING INTERESTS
The authors declare that they have no competing interests.
AUTHORS' CONTRIBUTIONS
SD, CVD, PB, YP and PG conceived the study. SD collected data. SD and JEB drafted the
manuscript. FD and MB participated in coordination and helped to draft the manuscript. SD
performed the statistical analyses. PG provided mentorship and edited the manuscript. All
authors have read and approved the final manuscript.
13
ACKNOWLEDGMENTS:
The authors acknowledge AQUILAB SAS for their contribution to this study.
14
REFERENCES:
1. Senan S, van Sörnsen de Koste J, Samson M, Tankink H, Jansen P, Nowak PJ, Krol AD, Schmitz P,
Lagerwaard FJ: Evaluation of a target contouring protocol for 3D conformal radiotherapy in non-
small cell lung cancer. Radiother Oncol 1999,53:247-55.
2. Bowden P, Fisher R, Mac Manus M, Wirth A, Duchesne G, Millward M, McKenzie A, Andrews J, Ball
D: Measurement of lung tumor volumes using three-dimensional computer planning software. Int
J Radiat Oncol Biol Phys 2002,53:566-73.
3. Giraud P, Elles S, Helfre S, De Rycke Y, Servois V, Carette MF, Alzieu C, Bondiau PY, Dubray B,
Touboul E, Housset M, Rosenwald JC, Cosset JM: Conformal radiotherapy for lung cancer:
different delineation of the gross tumor volume (GTV) by radiologists and radiation oncologists.
Radiother Oncol 2002,62:27-36.
4. Steenbakkers RJ, Duppen JC, Fitton I, Deurloo KE, Zijp LJ, Comans EF, Uitterhoeve AL, Rodrigus PT,
Kramer GW, Bussink J, De Jaeger K, Belderbos JS, Nowak PJ, van Herk M, Rasch CR: Reduction of
observer variation using matched CT-PET for lung cancer delineation: a three-dimensional
analysis. Int J Radiat Oncol Biol Phys 2006,64:435-48.
5. Bekelman JE, Wolden S, Lee N: Head-and-neck target delineation among radiation oncology
residents after a teaching intervention: a prospective, blinded pilot study. Int J Radiat Oncol Biol
Phys 2009,73:416-23.
6. Tomsej M. The TomoTherapy Hi: Art System for sophisticated IMRT and IGRT with helical
delivery: Recent developments and clinical applications. Cancer Radiother 2006,10:288-95.
7. Bondiau PY, Bénézery K, Beckendorf V, Peiffert D, Gérard JP, Mirabel X, Noël A, Marchesi V,
Lacornerie T, Dubus F, Sarrazin T, Herault J, Marcié S, Angellier G, Lartigau E: CyberKnife® robotic
stereotactic radiotherapy: technical aspects and medical indications. Cancer Radiother
2007,11:338-44.
8. Pouliot J, Morin O, Aubin M, Aubry JF, Chen J, Speight J, Roach M 3
rd
: Megavoltage cone-beam CT:
Recent developments and clinical applications. Cancer Radiother 2006,10:258-68.
9. Shaw E, Scott C, Souhami L, Dinapoli R, Kline R, Loeffler J, Farnan N: Single dose radiosurgical
treatment of recurrent previously irradiated primary brain tumors and brain metastases: Final
report of RTOG protocol 90–05. Int J Radiat Oncol Biol Phys 2000,47:291-298.
15
10. Lomax NJ, Scheib SG: Quantifying the degree of conformity in radiosurgery treatment planning.
Int J Radiat Oncol Biol Phys 2003,55:1409-1419.
11. Van’t Riet A, Mak AC, Moerland MA, Elders LH, van der Zee W: A conformation number to
quantify the degree of conformality in brachytherapy and external beam irradiation: Application
to the prostate. Int J Radiat Oncol Biol Phys 1997,37:731-736.
12. Baltas D, Kolotas C, Geramani K, Mould RF, Ioannidis G, Kekchidi M, Zamboglou N: A conformal
index (COIN) to evaluate implant quality and dose specification in brachytherapy. Int J Radiat
Oncol Biol Phys 1998,40:515-524.
13. Dewas S, Vautravers-Dewas C, Blanchard P, Pointreau Y, Denis F, Lacornerie T, Gibon D, Giraud P:
Delineation variation of lung cancer in conformal radiotherapy among radiation oncology
residents after an educational course: a prospective study. Cancer Radiother 2010,14:103-10.
14. Giraud P, Yorke E, Ford EC, Wagman R, Mageras GS, Amols H, Ling CC, Rosenzweig KE:
Reduction of organ motion in lung tumors with respiratory gating. Lung Cancer 2006,51:41-51.
15. Kepka L, Bujko K, Garmol D, Palucki J, Zolciak-Siwinska A, Guzel-Szczepiorkowska Z, Pietrzak L,
Komosinska K, Sprawka A, Garbaczewska A: Delineation variation of lymph node stations for
treatment planning lung cancer radiotherapy. Radiother Oncol 2007,85:450-5.
16. Chapet O, Kong FM, Quint LE, Chang AC, Ten Haken RK, Eisbruch A, Hayman JA: CT-based
definition of thoracic lymph node stations: an atlas from the University of Michigan. Int J Radiat
Oncol Biol Phys 2005,63:170-8.
17. Vorwerk H, Beckmann G, Bremer M, Degen M, Dielt B, Fietkau R, Gsänger T, Hermann RM, Alfred
Herrmann MK, Höller U, van Kampen M, Körber W, Maier B, Martin T, Metz M, Richter R,
Siekmeyer B, Steder M, Wagner D, Hess CF, Weiss E, Christiansen H: The delineation of target
volumes for radiotherapy of lung cancer patients. Radiother Oncol 2009,91:455-60.
18. White EA, Brock KK, Jaffray DA, Catton CN: Inter-observer Variability of Prostate Delineation on
Cone Beam Computerised Tomography Images. Clin Oncol (R Coll Radiol) 2009,21(1):32-8.
19. Lawton CA, Michalski J, El-Naqa I, Kuban D, Lee WR, Rosenthal SA, Zietman A, Sandler H, Shipley
W, Ritter M, Valicenti R, Catton C, Roach M 3rd, Pisansky TM, Seider M: Variation in the Definition
of Clinical Target Volumes for Pelvic Nodal Conformal Radiation Therapy for Prostate Cancer.
Int J Radiat Oncol Biol Phys 2009,74:377-82.
16
20. Petersen RP, Truong PT, Kader HA, Berthelet E, Lee JC, Hilts ML, Kader AS, Beckham WA, Olivotto
IA: Target volume delineation for partial breast radiotherapy planning: clinical characteristics
associated with low interobserver concordance. Int J Radiat Oncol Biol Phys 2007,69:41-8.
21. Petric P, Dimopoulos J, Kirisits C, Berger D, Hudej R, Pötter R: Inter- and intraobserver variation in
HR-CTV contouring: intercomparison of transverse and paratransverse image orientation in 3D-
MRI assisted cervix cancer brachytherapy. Radiother Oncol 2008,89:164-71.
22. Matzinger O, Poortmans P, Giraud JY, Maingon P, Budiharto T, van den Bergh AC, Davis JB, Musat
E, Ataman F, Huyskens DP, Gulyban A, Bolla M; EORTC Radiation Oncology Group: EORTC
Radiation Oncology Group. Quality assurance in the 22991 EORTC ROG trial in localized
prostate cancer: dummy run and individual case review. Radiother Oncol 2009,90:285-90.
23. Coles CE, Hoole AC, Harden SV, Burnet NG, Twyman N, Taylor RE, Kortmann RD, Williams MV:
Quantitative assessment of inter-clinician variability of target volume delineation for
medulloblastoma: quality assurance for the SIOP PNET 4 trial protocol. Radiother Oncol
2003,69:189-94.
24. Seddon B, Bidmead M, Wilson J, Khoo V, Dearnaley D: Target volume definition in conformal
radiotherapy for prostate cancer: quality assurance in the MRC RT-01 trial. Radiother Oncol
2000,56:73-83.
25. Commowick O, Grégoire V, Malandain G: Atlas-based delineation of lymph node levels in head and
neck computed tomography images. Radiother Oncol 2008,87(2):281-9.
26.
27. Poortmans P, Bossi A, Vandeputte K, Bosset M, Miralbell R, Maingon P, Boehmer D, Budiharto T,
Symon Z, van den Bergh AC, Scrase C, Van Poppel H, Bolla M; EORTC Radiation Oncology Group:
EORTC Radiation Oncology Group. Guidelines for target volume definition in post-operative
radiotherapy for prostate cancer, on behalf of the EORTC Radiation Oncology Group. Radiother
Oncol 2007,84:121-7.
17
Table 1: Comparison indices for the GTV.
Comparison before and after the course
Range
Comparison
with
the expert
Min Max
Mean
Difference
P*
Before
103.39 p = 0.02 59.9 215.2
GTV (cm
3
)
After
99.48 p = 0.09 39.71 202.29
3.90 0.53
Before
1.16 p = 0.02 0.67 2.41
Volume Ratio
After
1.11 p = 0.09 0.44 2.27
0.04 0.53
Before
78.41 p < 0.001 58.85 91.78
Common Delineated
Volume
After
76.35 p < 0.001 40.24 92.06
2.06 0.27
Before
28.77 p < 0.001 7.05 61.99
Additional Delineated
Volume
After
27.82 p < 0.001 9.14 59.56
0.94 0.70
Before
0.58 p < 0.001 0.36 0.71
Overlap
After
0.57 p < 0.001 0.38 0.71
0.006 0.70
Before
0.73 p < 0.001 0.54 0.83
Kappa
After
0.72 p < 0.001 0.56 0.83
0.006 0.66
* (t test and paired t test).
18
FIGURES
Figure 1: Clinical case available to attendees. CT Fusion with PET. Three groups included a
volume without FDG uptake inside the GTV even though it had been explained before
delineation that it was considered as a thymic residue.
Figure 2: Volumes: calculated indices.
Figure 3: Dose: calculated indices.
Figure 4: GTV inter-comparison before (A) and after the course (B) (red: 30 groups, blue: 3
groups, yellow contour: expert’s contour).
Figure 5: Comparison of DVH between the expert (A) and the lowest overlap (0.39) and
kappa (0.56) of the resident group (B).
Figure 1
C
R
: Reference Contour
C: Contour to compare
Volume Ratio
R
CCVR =
Optimum: 1
Common Delineated Volume
RR
C)C(CCDV ∩=
Optimum: 100%
Additional Delineated Volume
C)C(CADV
R
∩=
Optimum: 0%
Kappa Index
( ) ( )
RR
CCCCKI +∩×= 2
Optimum: 1
Overlap Index
( ) ( )
RR
CCCCOV ∪∩=
Optimum: 1
RI
C
R
C
C ∪ C
R
R
CC ∩
R
CC ∩
Figure 2
Figure 3
A
B
Figure 4
A B
Lung Esophagus
Heart Spinal Cord
Lung Esophagus
Heart Spinal cord
Figure 5