Báo cáo khoa học: " Evaluation of early imaging response criteria in glioblastoma multiforme" pot
Bạn đang xem bản rút gọn của tài liệu. Xem và tải ngay bản đầy đủ của tài liệu tại đây (459.83 KB, 7 trang )
RESEARC H Open Access
Evaluation of early imaging response criteria in
glioblastoma multiforme
Adam Gladwish
1,2*†
, Eng-Siew Koh
3,4†
, Jeremy Hoisak
2,6
, Gina Lockwood
7
, Barbara-Ann Millar
2,7
, Warren Mason
1,6
,
Eugene Yu
8
, Normand J Laperriere
2,7
and Cynthia Ménard
2,5
Abstract
Background: Early and accurate prediction of response to cancer treatment through imaging criteria is particularly
important in rapidly progressive malignancies such as Glioblastoma Multiforme (GBM). We sought to assess the
predictive value of structural imagi ng response criteria one month after concurrent chemotherapy and
radiotherapy (RT) in pat ients with GBM.
Methods: Thirty patients were enrolled from 2005 to 2007 (median follow-up 22 months). Tumor volumes were
delineated at the boundary of abnormal contrast enhancement on T1-weighted images prior to and 1 month after
RT. Clinical Progression [CP] occurred when clinical and/or radiological events led to a change in chemotherapy
management. Early Radiologic Progression [ERP] was defined as the qualitative interpretation of radiological
progression one month post-RT. Patients with ERP were determined pseudoprogressors if clinically stable for ≥6
months. Receiver-operator characteristics were calculated for RECIST and MacDonald criteria, along with alternative
thresholds against 1 year CP-free survival and 2 year overall survival (OS).
Results: 13 patients (52%) were found to have ERP, of whom 5 (38.5%) were pseudoprogressors. Patients with ERP
had a lower median OS (11.2 mo) than those without (not reached) (p < 0.001). True progressors fared worse than
pseudoprogressors (median survival 7.2 mo vs. 19.0 mo, p < 0.001). Volume thresholds performed slightly better
compared to area and diameter thresholds in ROC analysis. Responses of > 25% in volume or > 15% in area were
most predictive of OS.
Conclusions: We show that while a subjective interpretation of early radiological progression from baseline is
generally associated with poor outcome, true progressors cannot be distinguished from pseudoprogressors. In
contrast, the magnitude of early imaging volumetric response may be a predictive and quantitative metric of
favorable outcome.
Keywords: Glioblastoma Multiforme, Imaging response, radiotherapy, RECIST
Background
In 1990, MacDonald et al [1] reported criteria for
response assessment in glioma. Importantly, these criteria
incorporated features such as time factors, degree of
response of contrast-enhancing tumor using computed-
tomography (CT)-based uni-dimensional World Health
Organization (WHO) criteria [2], neurologic status and
the use of cort icosteroids. Although these criteria have
become widely accepted, they have also been criticized
for their limitations [3-5], including their inability to
accurately assess complex tumor morphology, account
for non-tumor factors that may cause contrast enhance-
ment, reaction to local therapies [6], and lack of applic-
ability to non-enhancing tumors. Furthermore, the
phenomenon of ‘ pseudoprogression’ observed in patients
receiving c oncurrent chemo-radiotherapy [7-9], as well
as the dilemma of ‘pseudo-resp onse’ seen with some of
the newer anti-angiogenic therapies [5,10], adds to the
already complex cha llenge of early assessme nt as these
phenomena can confound image interpretations.
The accurate and early prediction of response and/or
progression remains important for several reasons. In
* Correspondence:
† Contributed equally
1
Faculty of Medicine, University of Toronto, Toronto, Canada
Full list of author information is available at the end of the article
Gladwish et al. Radiation Oncology 2011, 6:121
/>© 2011 Gladwish et al; licensee BioMed Central Ltd. This is an Open Access article distributed under the terms of the Creat ive
Commons Attribution License (http://cre ativecommons.org/licenses/by/2.0), whic h permits unrestricted use, distribution, and
reproduction in any medium, provided the original work is properly cited.
principle, this may enable more objective evaluation and
compa rison of novel therapies [5]. Secondly, such a bio-
marker could be utilized as a surrogate endpoint in clin-
ical trials, thus conferring the distinct advantage of
earlier response prediction and greater opportunity to
amend or institute alternate therapies, especially given
the aggressive nature of Glio blastoma Multiforme
(GBM ). Thirdly, earlier imaging predictors could poten-
tially allow the conduct of smaller clinical trials requir-
ing fewer patients, enable earlier judgements about
promising versus futile therapies, more expeditious reg-
ulatory approval for new drugs, and ultimately earlier
application and translation of new therapies into clinical
practice [11,12]. In reality however, the evidence for reli-
able imaging response thresholds that could ultimately
influence therapeutic decision making is still l acking.
Currently, response criteria are largely based on the
response evaluation criteria in solid tumors (RECIST)
guidelines [13,14], which were developed to standardize
reporting of outcomes of clinical trials. Most recently,
the Response Assessment in Ne uro-Oncology (RANO)
working group provided updated criteria for high-grade
gliomas [15], but as of yet there is not analysis of these
criteria as they relate to cli nical endpoints such as over-
all survival and progression-free survival.
We embarked on a study investigating early structural
and functional magnetic resonance imaging (MRI) eva-
luations of response in patients with GBM. As a first
step, we sought to investigate the predictive value of
standard structural imaging response criteria one month
after the delivery of concurrent chemotherapy and
radiotherapy (RT). We also undertook exploratory ana-
lysis of alternate structural imaging response thresholds
that may better correlate with and/or predict fo r clinical
outcomes.
Methods
This study was approved by the institutional research
ethics board. Patients were prosp ectively enrolled over a
26 month interval between May 2005 and July 2007.
Patient s were approached for enrollment if they met the
following criteria: histological diagnosis of WHO grade
IV Glioblastoma Multiforme; planned to receive defini-
tive concurrent chemotherapy (temozolomide 75 mg/m
2
daily) and RT (60Gy in 30 fractions over 6 weeks) fol-
lowed by adjuvant temozolomide chemotherapy (200
mg/m
2
× 5 days, monthly for 1 year or until progres-
sion); age ≥18 years; and ECOG performance status 0 or
1. Patients were excluded if they had contraindications
to MRI, severe claustrophobia, or previous cranial radio-
therapy. Relevant clinical and demographic information,
including gender, age, diagnosis date, disease multi-
focality, surgical status, and radiation treatment dates
were also captured.
MRI acquisition was performed at the following time-
points: Baseline (BL) post-operatively but prior to radi o-
therapy(RT);week3andweek6ofRT,1monthafter
completion of RT, then every two months until evidence
of clinical progression (defined below) or un til 1 year of
follow-up. All images were acquired using a 1.5 T GE
Signa Excite scanner (GE Healthc are, Waukesha, WI,
USA). The MRI acquisition protocol was performed as
follows: Axial post-contrast axial T1-weighted fast-spin
echo(FSE)(TE=20ms,TR=416.66ms,FA=90°,
BW = 122.109, slice thickness = 5 mm, slice spacing = 7
mm, 0.859 × 0.859 × 7 mm resolution).
Clinical and imaging end-points included: A) Time to
Clinical Progression [CP] - interval between beginning
of RT and CP defined as aggregate of clinical and radi-
ological progression resulting in a change in patient
management (for example, second-line chemotherapy,
salvage surgery or palliative care); B) Overall Survival
[OS] - defined as the interval between beginning of RT
and death; C) Early Radiological Progression [ERP] -
qualitative impression of any radiological progression
from baseline to one month post-RT as defined by a
radiation oncologist (CM), and D) Pseudoprogression -
when ERP was present but the patient showed clinically
stable disease for at least 6 months post-RT without a
change in the adjuvant chemotherapy regimen.
Post-contrast axial T1-weighted FSE images were
rigidly co-registered (mutual information algorithm)
with the RT planning CT datasets using a commercial
radiotherapy treatment planning system (Pinnacle
3
v7.6c
and 8.1, Philips Radiation Oncology Systems, Madison,
WI). A radiation oncologist (ESK, NL) delineated tumor
volumes on the T1-weighted p ost-contrast MR images
as defined by areas of abnormal contrast enhancement
reflecting residual or recurrent tumor, whilst excluding
areas of post-surgical change. All volumes were then
reviewed and finalized by a diagnostic radiologist (EY).
Both longest diameter (axial, coronal, and sagittal
planes) and 3D volumetric data (cc) were computed at
baseline (BL) and one-month post RT. Progression was
then assess ed via RECIST criteria, a 20% increase in the
longest tumor diameter or a 40% increase in volume
(sums of diameters or volumes were used in the case of
multi-focal disease). Disease response as determined by
RECIST was defined as a 65% decrease in volume or a
30% decrease in diameter. The MacDonald criteria were
also evaluated: progressive disease defined as a 25%
increase in the largest tumor area (cm
2
)andresponsive
disease defined as a 30% decrease in largest area. Each
patient was then classified in a binary fashion, as either
having progressive or responsive disease based on these
imaging thresholds. In addition, the following range of
volume, area and diameter progression/response thresh-
olds (see Additional File 1 - Table 1) were investigated
Gladwish et al. Radiation Oncology 2011, 6:121
/>Page 2 of 7
including: Diameter - any increase; any increase or
decrease up to > 5%, 15% or 30%; Area - any increase,
any increase or decrease > 5%; 15% or 30%; and Volume
- any increase, > 25% increase, any increase or decrease
> 10%; 25%; or 50%.
Sensitivity and specificity values were calculated for
each threshold using clinical progression-free survival at
1 year and overall survival at 2 years. Receiver-operator
curves (ROC) were also constructed and statistical ana-
lysis was performed on the basis of work by DeLong et.
al. [16]. Kaplan-Meier survival curves w ere created to
analyze early progression, pseudoprogression and clinical
progression as previously defined.
Results
A total of 30 patients were prospecti vely recruited. One
patient refused study procedures after enrollment and
another 4 patients did not undergo MRI examination
one m onth after RT, leaving a total of 25 patients from
whom imaging data was analyzed. It s hould be noted
that demographical and follow-up dat a was taken from
all 29 patients followed, however only the demographics
of the 25 patients analyzed in this study are reported
here. The median age of patients enroll ed was 56 years
(15 m en, 10 women, range 46 - 68 years). Five patients
presented with multifocal disease. Tumor volumes at
baseline ranged from 0.96 cm
3
to 143.2 cm
3
. The major-
ity of patients were enrolled after gross total resection (n
= 14), while 8 and 3 patients underwent partial resection
and biopsy only, respectively.
The study cohort had a median follow-up of 26.3
months (range 13.3 - 37.7 months). Median survival was
high at 26.7 months and median time to clinical pro-
gression was 7.5 months (range 1.5 mo. - 35.9 mo.).
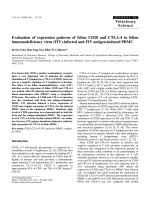
A qualitative impression of any radiological progres-
sion(ERP)frombaselinewasfoundin11patients
(40.0%), although only 2 patients strictly met the Mac-
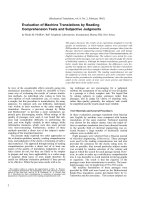
Donald criteria for progression at 1 mon th. Median sur-
vival for patients with ERP was significantly shorter than
thos e without (11.2 mo vs. not reached, p < 0. 001) (Fig-
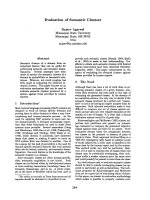
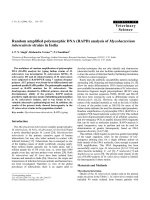
ure 1). Of those with ERP, five were subsequently deter-
mined to have pseudoprogression (45.5% of ERP).
Pseudoprogressors fared better than true early progres-
sors, with a median survival of 19.0 months vs. 7.2
months (p < 0.001), (Figure 2)
Sensitivity and specificity values were calculated for each
response threshold, along with the positive and negative
likelihood ratios (+LH; -LH) and the area-under-the-curve
(AUC) for volume, area and diameter metrics (see Addi-
tional files 1, 2, 3 - Table 1, 2 and 3 respectively) in pre-
dicting for 2-year overall survival. The most sensitive tests
were those measuring response, namely greater than 25%
and 50% decreases in volume and 15% and 30% decreases
in area and diameter. The most specific tests were those
with the highest thresholds for progression, namely the
RECIST criteria for both volume and diameter, and Mac-
Donald criteria for area. In general, the volume measure-
ments consistently performed better in every category
than did the area and diameter metrics. This trend can
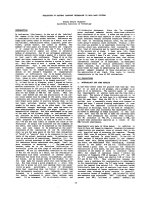
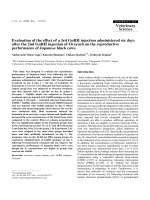
also be visualized in Figure 3, receiver-operator curves
plotting sensitivity vs. 1-specificity for the volume, area
and diameter thresholds against overall survival at 2 years.
TherespectiveAUC’s are 0.83 (0.59 - 0.94 95% CI), 0.76
(0.53 - 0.90 95% CI) an d 0.69 (0. 44 - 0.84 95% CI) for
volume, area and diameter respectively. These values were
significantly differ ent from chance (AUC of 0.5) for both
volume and area (p < 0.005 and p < 0.05, respectively) but
not for diameter (p > 0.1). When comparing amongst
AUC’s there was no significant difference between volume,
area or diameter, with the greatest trend seen between
volume and diameter (p > 0.1). The two most prognos tic
thresholds were > 15% decrease in area (3.33 +LH, 0.22
-LH) and > 25% decrease in volume (3.38 +LH, 0.21 -LH).
Figure 1 Overall survival accordi ng to 1 month r adiological
progression status: Overall. survival based on any early radiological
progression (ERP), observed one month after RT.
Figure 2 Overall survival according to true vs. pseudo-
progression status: Overall survival. based on true vs. pseudo
progression at one month.
Gladwish et al. Radiation Oncology 2011, 6:121
/>Page 3 of 7
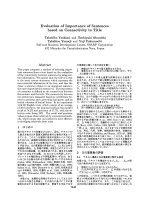
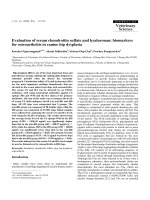
Figure 4 compares the receiver-operator characteristics of
volume thresholds when predicting for progression-free
survival at 1 year and overall survival at 2 years, demon-
strating a trend that volume metrics to be more predictive
of overall survival at 2 years than PFS at 1 year (AUC 0.83
vs. 0.70, p < 0.2). Fi gure 5 depicts Kaplan-Meier s urviva l
based on > 25% volume response at 1-month post RT
nearing statistical significance (median survival 14.9 mo
vs. not reached, p < 0.06).
Discussion
The early and accurate prediction of respons e to cancer
treatment through the application of imaging criteria
has several potential advantages. Ideally, imaging
thresholds would provide utility as surrogates for out-
come over and above the more traditional measures
including overall and progression free survival [17],
allowing for more expeditious conduct of clinical trials
(both p hase II [18] and III). This in turn could lead to
the earlier institution of alternate therapies that show a
beneficial effect on outcome. This is particularly impor-
tant in dealing with aggressiv e and rapidly growing
malignancies such as GBM.
Our results show that across all thresholds, b oth pro-
gressive and responsive, volume was uniformly more
predictive of OS and PFS as seen by the right shift of
the diameter ROC curve in Figur e 3 (AUC of 0.83 vs.
0.76 vs. 0.69). However this was only a trend, not
achieving significance amongst the three, the closest
being volume vs. diameter (p > 0.15). This is similar to
what Shah et al and Galanis et al have reported as cor-
relations between uni and mult i-dimensional radiologi-
cal data in classifying progressive disease [19,20].
Furthermore, we show that a qualit ative interpretation
of any radiological progression one-month post therapy
is associated with poor outcomes. However, this assess-
ment is not acted upon clinically because of the con-
founding potential for treatment effect (or
pseudoprogression), and our current inability (clinically
and radiologically) to distinguish the two groups apriori.
Many recent investigations have looked at the incidence
and outcomes related to pseudoprogression [21-24].
Two Canadian studies by Roldan et al and Sanghera et
al found rates of pseudoprogression of 40% and 32%
respectively, and median survivals of 9.1 months and
31.2 months [22,23]. Another recent study by Gerstner
et al found the pseudoprogression rate to be 57% with a
median survival of 24.4 months, however their definition
of pseuodprogression was at 3 months post-chemoRT
[24], compared to 6 months in this stud y (and the two
Figure 3 Receiver-Operator Curve by Dimension Metric:
Receiver-operator curves for volume (solid, square), area (dashed,
cross) and diameter (dashed, diamond) thresholds in predicting 2
year overall survival. Line of indecision is marked as a dotted line.
Figure 4 Receiver-Operator Curve of Volume Metrics by
Clinical End-point: Receiver-operator curves for volume thresholds
in predicting for 2 year overall survival (solid, square) and 1 year
clinical progression-free survival (dashed, diamond). Line of
indecision is marked as a dotted line.
Figure 5 Kaplan-Meier survival according to 25% Volume
Response at 1 month: Kaplan-Meier survival curve for patients
with and without a > 25% response in tumour volume, one month
after RT.
Gladwish et al. Radiation Oncology 2011, 6:121
/>Page 4 of 7
referenced previously). All three showed no significant
difference in OS between those with pseudoprogressi on
andthosewithoutERP.Theresultsfromthisstudy
were in keeping with other literature, including a rate of
pseudoprogression of 38.5% and a median survival of
19.0 months. There was also no survival benefit between
pseudoprogressors and those patients with no ERP,
however pseudoprgressors showed improved OS com-
pared with true early progressors (median survival 19.0
mo v s. 7.2 mo, p < 0.01), in keeping with the results of
Roldan and Sanghera [22,23]. This demonstrates that
there is sufficient qualitative information in early struc-
tural imaging to help guide clinician s in identifying pro-
gressive vs. responsive disease, with the exception of
pseudoprogression, a topic which is now finding its way
into the realm of imaging response criteria.
Historically, quantitative imaging criteria was first
addressed in 1979 by the WHO in their published
guidelines [2]. Since then, RECIST v1.0 [13] was pub-
lished in 2000 with subsequent revised criteria (version
1.1) in 2009 [14]. Each was developed in an attempt to
standardize reporting and facilitate comparison of ima-
ging response assessment w ithin the context of clinical
oncology trials [4,11], however the results of this study
show that the ability to assess progressive disease via
quantitative radiological data remains limited. We found
that each of the MacDonald, RECIST and additional
thresholds, both uni and multi-dimensional, while speci-
ficforprogressivediseasewerehighlyinsensitive.This
translated into a poor correlation with both PFS at one
year and OS at two years (Figure 4), therefore limiting
their usefulness a s endpoint surrogates in clinical trials.
One obvious contributor to this effect is the issue of
pseudoprogression, in tha t pseudoprogressors will
always negatively impact the accuracy of progressive
thres holds based on standard structural imaging. Recent
updates in response assessment criteria by the RANO
group (Response Assessment in Neuro-Oncology) have
included an effort to address these challenges by devel-
oping guidelines specific to the management of brain
tumors including parameters for disease progression
[15]. They suggest deferring the determination of pro-
gressive disease until ≥ 12 weeks after the completion of
RT, except in the case of a new lesion outside of the
radiation field and/or pathology proven progressive dis-
ease within the original tumor site. This recommenda-
tion aims to defer a change in clinical management until
pseuodprogression can be more reliably ruled out. How-
ever, as was mentioned previously the OS between pseu-
doprogressors identified at one month after RT is not
significantly different from non-progressors, and there-
fore if these patients could be identified more readily,
the truly progressive patients would avoid an additional
8 weeks of ineffective chemotherapy.
In contrast, metrics for defining responsive disease
performed much better in terms of both PFS and OS
(Figure 4), likely in part because identifying responders
is not marred by the issue of pseudoprogression and
also because intuitively, those with large reductions i n
tumor burden will do better than those without. Clinic al
trials showing evidence of radiological response in GBM
are therefore likely to have an increased clinical rele-
vance in terms of survival endpoints, than those focus-
ing on progressive characteristics. This is contrary to
the findings o f Galanis et al who f ound that progressive
disease to be more predictive of OS. This difference i s
probably multi-factorial, for one a variety of gliomas
were included as compared to solely GBM as in this
study. Secondly, the there was a smaller portion of
responders in the Galanis study, likely owing in part to
the addition of temozolomide to the treatment regiment
in this study. Finally, the timing of the imaging was later
in the Galanis study, 4 months post-induction of therapy
as compared to one month post-RT in our study. This
difference in timing may decrease the incidence of pseu-
doprogressors as a fraction may have already declared
themselves as true early progressors by that point,
thereby alleviating their negative statistical impact on
the progressive imaging thresholds. If true, it is concei-
vable that optimizing the timing of post-therapy follow-
up imaging could aid in of identification of pseudopro-
gressors. Our study only looked at a single imaging time
point, however further investigation into multiple ima-
ging time points would certainly be insightful. It is unli-
kely however that the answer to this challenging issue
lies in timing along, and as such an array of research
continues to look for potentially more robust and quan-
tifiable solutions. Many groups have looked at the use of
functional imaging modalities to augment standard ana-
tomical information. The addition of perfusion and dif-
fusion-weighted techniques are thought to be able to
provide information about tumor activity as a potential
biomarker of tumor progression [25]. As such, the role
of f unctional MRI (diffusion-weighted and perfusion) is
the s ubject of intense clinical investigation [26-33], and
recent findings have shown that diffusion-weighted ima-
ging can predict for OS and time-to-progression in high
grade glioma [29,30]. Furthermore, recent results by
Tsien et. al. have shown promise in using dynamic sus-
ceptibility contrast magnetic resonace imaging (DSC-
MRI) and parametric response maps measuring relative
cerebral blood volume to identify pseudoprogression
from true progression during therapy [34]. The role of
FLT-PET and molecular imaging is also being actively
investigated as a potential modality for imaging tumor
progression [35,36].
A primary limitation of our study lies in a relatively
small sample size of prospectively recruited Glioblastoma
Gladwish et al. Radiation Oncology 2011, 6:121
/>Page 5 of 7
patients. Our work must b e further validated in a l arger
cohort for meaningful interpretation and future clinical
translation. Furthermore, as was mentioned above, our
study only investigated a single imaging time point (one
month post-RT), additional imaging would be useful
determining if there is an optimal time point, and what
that might be. Our study cohort had a significantly higher
median survival (26.2 mo. 95% CI 13.7 - not reached)
than expected from the literature (14.6 mo. 95% CI 13.2 -
16.8 [37]). Finally, baseline imaging in the study was per-
formed post-operatively, where resolving post-surgical
changes may have been a potential confounding factor in
the assessment of response. Strengths of this cohort
include a typical and balanced population demogra phic
in age, gender and size. Extent of surgery was also
balanced with ~50% undergoing gross total resection and
the remainder having either partial total resection or
biopsy alone. The extended length of follow-up (median
22 months) was also beneficial to this study.
Conclusion
We sought to evaluate early radiologic response criteria
relevant to clinical outcomes in patients with GBM treated
with concurrent chemotherapy and radiotherapy, and
found that a qualitative clinical impression of radiologic
progression at one month after therapy was predictive of
poor outcomes d espite the confounding factor of treatment
effect (pseudoprogression ). Quantitatively, we found that
response metrics were more indicative of outcome than
progressive indices and that there was a trend of volu-
metric data outperforming diameter or area thresholds,
however significance was not reached in this case. Further
investigation will focus on adding additional imaging time
points as well as adjunct funct ional imaging to better
understand progression features that may have a stronger
predictive value than structural geometric indices alone.
Additional material
Additional file 1: Table 1: Sensitivity and specificity metrics in
predicting 2 year overall survival according to various volume
thresholds, from baseline to one month after RT.
Additional file 2: Table 2: Sensitivity and specificity metrics in
predicting 2 year overall survival according to various area
thresholds, from baseline to one month after RT.
Additional file 3: Table 3: Sensitivity and specificity metrics in
predicting 2 year overall survival according to various diameter
thresholds, from baseline to one month after RT.
Author details
1
Faculty of Medicine, University of Toronto, Toronto, Canada.
2
Radiation
Medicine Program, Princess Margaret Hospital, Toronto, Canada.
3
Department of Radiation Oncology, Liverpool Hospital, New South Wales,
Australia.
4
University of New South Wales, NSW, Australia.
5
Department of
Radiation Oncology, University of Toronto, Toronto, Canada.
6
Department of
Medical Biophysics, Universi ty of Toronto, Toronto, Canada.
7
Department of
Clinical Study Coordination and Biostatistics, Princess Margaret Hospital,
Toronto, Canada.
8
Department of Medical Imaging, Princess Margaret
Hospital, Toronto, Canada.
Authors’ contributions
Conception and design: AG, ESK and CM. Provision of study materials or
patients: ESK, NL, WM, BM, EY and CM. Collection and assembly of data: AG,
ESK, JH, GL and CM. Data analysis and interpretation: AG, ESK, GL. Manuscript
writing: AG, ESK, JH, NL and CM. Final approval of manuscript: AG, ESK, JH,
GL, NL, BA, WM, EY and CM.
Competing interests
The authors declare that they have no competing interests.
Received: 16 April 2011 Accepted: 23 September 2011
Published: 23 September 2011
References
1. Macdonald DR, Cascino TL, Schold SC Jr, Cairncross JG: Response criteria
for phase II studies of supratentorial malignant glioma. J Clin Oncol 1990,
8(7):1277-80.
2. WHO handbook for reporting results of cancer treatment. Geneva
(Switzerland) 1979.
3. Perry JR, Cairncross JG: Glioma therapies: how to tell which work? J Clin
Oncol 2003, 21(19):3547-9.
4. Suzuki C, Jacobsson H, Hatschek T, Torkzad MR, Boden K, Eriksson-Alm Y,
et al: Radiologic measurements of tumor response to treatment:
practical approaches and limitations. Radiographics 2008, 28(2):329-44.
5. van den Bent MJ, Vogelbaum MA, Wen PY, Macdonald DR, Chang SM: End
point assessment in gliomas: novel treatments limit usefulness of
classical Macdonald’s Criteria. J Clin Oncol 2009, 27(18):2905-8.
6. Ruben JD, Dally M, Bailey M, Smith R, McLean CA, Fedele P: Cerebral
radiation necrosis: incidence, outcomes, and risk factors with emphasis
on radiation parameters and chemotherapy. Int J Radiat Oncol Biol Phys
2006, 65(2):499-508.
7. Brandes AA, Franceschi E, Tosoni A, Blatt V, Pession A, Tallini G, et al: MGMT
promoter methylation status can predict the incidence and outcome of
pseudoprogression after concomitant radiochemotherapy in newly
diagnosed glioblastoma patients. J Clin Oncol 2008, 26(13):2192-7.
8. Taal W, Brandsma D, de Bruin HG, Bromberg JE, Swaak-Kragten AT,
Smitt PA, et al: Incidence of early pseudo-progression in a cohort of
malignant glioma patients treated with chemoirradiation with
temozolomide. Cancer 2008, 113(2):405-10.
9. Brandsma D, Stalpers L, Taal W, Sminia P, van den Bent MJ: Clinical
features, mechanisms, and management of pseudoprogression in
malignant gliomas. Lancet Oncol 2008, 9(5):453-61.
10. Gonzalez J, Kumar AJ, Conrad CA, Levin VA: Effect of bevacizumab on
radiation necrosis of the brain. Int J Radiat Oncol Biol Phys 2007,
67(2):323-6.
11. Henson JW, Ulmer S, Harris GJ: Brain tumor imaging in clinical trials. AJNR
Am J Neuroradiol 2008, 29(3):419-24.
12. Lang FF, Gilbert MR, Puduvalli VK, Weinberg J, Levin VA, Yung WK, et al:
Toward better early-phase brain tumor clinical trials: a reappraisal of
current methods and proposals for future strategies. Neuro Oncol 2002,
4(4):268-77.
13. Therasse P, Arbuck SG, Eisenhauer EA, Wanders J, Kaplan RS, Rubinstein L,
et al: New guidelines to evaluate the response to treatment in solid
tumors. European Organization for Research and Treatment of Cancer,
National Cancer Institute of the United States, National Cancer Institute
of Canada. J Natl Cancer Inst
2000, 92(3):205-16.
14.
Eisenhauer EA, Therasse P, Bogaerts J, Schwartz LH, Sargent D, Ford R, et al:
New response evaluation criteria in solid tumors: revised RECIST
guideline (version 1.1). Eur J Cancer 2009, 45(2):228-47.
15. Wen PY, Macdonald DR, Reardon DA, van den Bent MJ, Chang SM, et al:
Updated response assessment criteria for high-grade gliomas: response
assessment in neuro-oncology working group. J Clin Oncol 2010,
28(11):1963-1972.
16. DeLong ER, DeLong DM, Clarke-Pearson DL: Comparing the areas under
two or more correlated receiver operating characteristic curves: a
nonparametric approach. Biometrics 1988, 44:837-845.
Gladwish et al. Radiation Oncology 2011, 6:121
/>Page 6 of 7
17. Lamborn KR, Yung WK, Chang SM, Wen PY, Cloughesy TF, DeAngelis LM,
et al: Progression-free survival: an important end point in evaluating
therapy for recurrent high-grade gliomas. Neuro Oncol 2008, 10(2):162-70.
18. Shankar LK, Van den AA, Yap J, Benjamin R, Scheutze S, FitzGerald TJ:
Considerations for the use of imaging tools for phase II treatment trials
in oncology. Clin Cancer Res 2009, 15(6):1891-7.
19. Shah S, Kesari S, Xu R, Batchelor T, O’Neill A, Hochberg F, Levy B,
Bradshaw J, Wen P: Comparison of linear and volumetric criteria in
assessing tumor response in adult high-grade gliomas. Neuro Onc 2006,
8:38-46.
20. Galanis E, Buckner JC, Maurer MJ, Sykora R, Castillo R, Ballman KV,
Erickson BJ: Validation of neuroradiologic response assessment in
gliomas: Measurement by RECIST, two-dimensional, computer-assisted
tumor area, and computer-assisted tumor volume methods. Neuoro Onc
2006, 8(2):156-65.
21. Sorensen AG, Batchelor TT, Wen PY, Zhang WT, Jain RK: Response criteria
for glioma. Nat Clin Prac Onc 2008, 11(5):634-44.
22. Roldán GB, Scot JN, Hamilton MG, Easaw JC, et al: Population-based study
of pseudoprogression after chemotadiotherapy in GBM. Can J Neurol Sci
2009, 36:617-22.
23. Sanghera P, Perry J, Davey P, Tsao MN, et al: Pseudoprogression following
chemotadiotherapy for glioblastoma multiforme. Can J Neurol Sci 2010,
37:36-42.
24. Gerstner ER, McNamara MB, Norden AD, LaFrankie D, Wen PY: Effect of
adding temozolomide to radiation therapy on the incidence of pseudo-
progression. J Neuroncol 2009, 94:97-101.
25. Provenzale JM, Mukundan S, Barboriak DP: Diffusion-weighted and
perfusion MR imaging for brain tumor characterization and assessment
of treatment response. Radiology 2006, 239(3):632-49.
26. Cao Y, Tsien CI, Nagesh V, Junck L, Ten HR, Ross BD, et al: Survival
prediction in high-grade gliomas by MRI perfusion before and during
early stage of RT [corrected]. Int J Radiat Oncol Biol Phys 2006,
64(3):876-85.
27. Chang S, Clarke J, Wen PY: Novel Imaging Response Assessment for Drug
Therapies in Recurrent Malignant Glioma. J Clin Onc 2009, 107-11.
28. Park I, Tamai G, Lee MC, Chuang CF, Chang SM, Berger MS, et al: Patterns
of recurrence analysis in newly diagnosed glioblastoma multiforme after
three-dimensional conformal radiation therapy with respect to pre-
radiation therapy magnetic resonance spectroscopic findings. Int J Radiat
Oncol Biol Phys 2007, 69(2):381-9.
29. Hamstra A, Chenevert T, Moffat B, et al: Evaluation of the functional
diffusion map as an early biomarker of time-to-progression and overall
survival in high-grade glioma. Proc Nat Acad Scien 2005, 102(46):16759-64.
30. Hamstra DA, Galbán CJ, Chenevert TL, et al: Functional diffusion map as
an early imaging biomarker for high-grade glioma: correlation with
conventional radiologic response and overall survival. J Clin Oncol 2008,
26:3387-94.
31. Chenevert TL, Stegman LD, Taylor JM, et al: Diffusion magnetic resonance
imaging: An early surrogate marker of therapeutic efficacy in brain
tumors. J Natl Cancer Inst 2000, 92:2029-36.
32. Provenzale JM, York G, Serajuddin H, et al: Correlation of relative
permeability and relative cerebral blood volume in high-grade cerebral
neoplasms. Am J Roentgenol 2006, 187:1036-42.
33. Bian W, Khayal IS, Nelson SJ, et al: Multiparametric characterization of
grade 2 glioma subtypes using magnetic resonance spectroscopic,
perfusion and diffusion imaging. Transl Oncol 2009, 2:271-80.
34. Tsien C, Galbán C, Chenevert T, et al: Parametric Response Map As an
Imaging Biomarker to Distinguish Progression From Pseudoprogression
in High-Grade Glioma. J Clin Oncol 2010, 28:2293-2299.
35. Larson SM, Schwartz LH: 18F-FDG PET as a candidate for “qualified
biomarker": functional assessment of treatment response in oncology. J
Nucl Med 2006, 47(6):901-3.
36. Backes H, Ullrich R, Jacobs AH, et al: Noninvasive quantification of (18)F-
FLT human brain PET for the assessment of tumour proliferation in
patients with high-grade glioma. Eur J Nucl Med Mol Imaging 2009,
26:1960-67.
37. Stupp R, Mason WP, van den Bent MJ, et al: Radiotherapy plus
concomitant and adjuvant temozolomide for glioblastoma. N Engl J Med
2005, 352:987-996.
doi:10.1186/1748-717X-6-121
Cite this article as: Gladwish et al.: Evaluation of early imaging response
criteria in glioblastoma multiforme. Radiation Oncology 2011 6:121.
Submit your next manuscript to BioMed Central
and take full advantage of:
• Convenient online submission
• Thorough peer review
• No space constraints or color figure charges
• Immediate publication on acceptance
• Inclusion in PubMed, CAS, Scopus and Google Scholar
• Research which is freely available for redistribution
Submit your manuscript at
www.biomedcentral.com/submit
Gladwish et al. Radiation Oncology 2011, 6:121
/>Page 7 of 7