Microsoft Press Configuring sql server 2005 môn 70 - 431 phần 7 pdf
Bạn đang xem bản rút gọn của tài liệu. Xem và tải ngay bản đầy đủ của tài liệu tại đây (2.91 MB, 98 trang )
552 Chapter 15 Monitoring and Troubleshooting SQL Server Performance
C:\PerfLogs directory. You can then open this log file in System Monitor for further
analysis, which Lesson 5, “Correlating Performance and Monitoring Data,” covers as
it explains how to leverage performance counters.
Quick Check
1. How do you launch System Monitor?
2. For what purpose do you use System Monitor?
Quick Check Answers
1. You launch System Monitor from the Start menu by selecting Performance
within the Administrative Tools menu on any machine running Windows.
2. You use System Monitor to gather numeric data related to various system
and application metrics. System Monitor cannot tell you what is executing,
but it can quantify an activity for a given system or application component.
PRACTICE Configuring a System Monitor Counter Log
In this practice, you will configure a System Monitor counter log, which you will use
in Lesson 5 to practice how to correlate data between Profiler and System Monitor.
1. Launch System Monitor by choosing Start, Administrative Tools, Performance.
2. Expand the Performance Logs And Alerts node.
3. Right-click Counter Logs and choose New Log Settings.
4. Specify a name for your log file settings and click OK.
5. Click Add Counters and add the following counters:
A. Network Interface\Output Queue Length
B. Processor\% Processor Time
C. SQL Server:Buffer Manager\Buffer Cache Hit Ratio
D. SQL Server:Buffer Manager\Page Life Expectancy
E. SQL Server:SQL Statistics\Batch Requests/Sec
F. SQL Server:SQL Statistics\SQL Compilations/Sec
G. SQL Server:SQL Statistics\SQL Re-compilations/Sec
C1562271X.fm Page 552 Friday, April 29, 2005 7:59 PM
Lesson 2: Working with System Monitor 553
6. Set the interval to one second.
7. Specify a user to run the counter log and enter the user’s password.
8. Leave the Log Files and Schedules tabs at their defaults.
9. Click OK. By default, System Monitor stores log files in the folder C:\PerfLogs. If
this folder does not yet exist, you are prompted to create it. Click Yes.
10. Right-click your new counter log and choose Start.
Lesson Summary
■ System Monitor provides a key tool for gathering statistical data related to hard-
ware and software metrics, which Profiler does not capture.
■ You should always capture System Monitor counters in a log if you plan to do
any analysis of the data or correlating with other tools.
■ To define the counters that System Monitor captures in the counter log, you can
use Add Objects to gather all counters associated with a particular object or Add
Counters to specify individual counters.
Lesson Review
The following questions are intended to reinforce key information presented in this
lesson. The questions are also available on the companion CD if you prefer to review
them in electronic form.
NOTE Answers
Answers to these questions and explanations of why each answer choice is right or wrong are
located in the “Answers” section at the end of the book.
1. A System Monitor counter log can gather which types of information? (Choose
all that apply.)
A. The applications currently running in Windows
B. Numerical data related to hardware performance
C. Queries being executed against SQL Server
D. The number of orders being placed per second
C1562271X.fm Page 553 Friday, April 29, 2005 7:59 PM
554 Chapter 15 Monitoring and Troubleshooting SQL Server Performance
Lesson 3: Using the Database Engine Tuning Advisor
The Database Engine Tuning Advisor (DTA) is the greatly enhanced replacement to the
Index Tuning Wizard tool that shipped with previous versions of SQL Server. DTA
plays an important role in an overall performance solution, letting you leverage the
query optimizer to receive recommendations on indexes, indexed views, or partitions
that could improve performance.
Hackers have developed sophisticated algorithms for breaking into secure systems,
but the most time-honored approach and the one that has a 100 percent success rate
is the brute force attack. DTA applies the same concept, taking a workload file as an
input and then exhaustively testing each query against all possible permutations of
indexes, indexed views, and partitions to come up with the best possible solution.
This lesson will explain all of the options available in DTA and how to integrate this
powerful tool into your performance-tuning work.
After this lesson, you will be able to:
■ Build a workload file.
■ Configure DTA to analyze a workload.
■ Save recommendations from DTA.
Estimated lesson time: 45 minutes
IMPORTANT If DTA fails to start
There have been many reports of DTA failing to start and displaying a C++ compile error. This is
a known issue related to incompatible registry settings that older applications might have added.
If you cannot get DTA to start, see the Microsoft article “Bug Details: Database Engine Tuning
Advisor” (at />4b0f-4c5c-b919-283a71cea5fe) for information about how to fix the problem.
Real World
Michael Hotek
I have been doing performance-tuning work in SQL Server for well over a
decade. What I have heard for too long from too many people is that perfor-
mance tuning is an art form. That could not be further from the truth. Compos-
ing the next number one hit, painting a masterpiece, or building an original
C1562271X.fm Page 554 Friday, April 29, 2005 7:59 PM
Lesson 3: Using the Database Engine Tuning Advisor 555
piece of furniture is an art. Performance tuning is nothing more than the appli-
cation of knowledge based on a set of rules to produce a result.
Although processor utilization, amount of memory available, and disk I/O can
affect database query performance, SQL Server’s query optimizer plays a critical
role in the performance of any query. SQL Server is a piece of software that is
written based on rules. The optimizer applies a defined, but not documented, set
of rules to determine how to gather the data that a query requests. We can only
deduce these basic rules by understanding how data is organized in SQL Server
as well as inspecting showplans to see the query paths that various queries have
taken. From these pieces of information, we can start to apply the rules of per-
formance tuning.
At many organizations, gathering and analyzing data to determine where the
performance issues are is the first hurdle. The second hurdle is in understanding
what to do about the issues to improve performance. Although many perfor-
mance issues require changes to the code that is executing, many more can be
solved simply by adding indexes, dropping indexes, or changing indexes, which
is where DTA plays an important role in any environment. It enables you to get
at core issues related to indexing without having to spend large amounts of time
on analysis.
One of the first things I do at a customer site when dealing with performance
issues is to start Profiler and begin capturing queries. I can then take that Profiler
trace and feed it directly into DTA. Using the trace I give it, DTA simply takes
each query and applies the rules of the optimizer in a nearly exhaustive manner.
It uses the query costing values to determine whether a particular query could
benefit from having indexes or indexed views created for it or whether partition-
ing the table would improve performance.
The index recommendations let me zero in on particular areas as well as partic-
ular queries that I need to look at. In many cases, running DTA regularly and
using its recommendations can help avoid or mitigate performance issues.
Although running DTA doesn’t eliminate the need for further analysis, as I will
describe in subsequent lessons in this chapter, it can at least keep your phone
from ringing off the hook with users upset at the responsiveness of a system and
let you spend more time doing even deeper analysis to accomplish even better
performance.
C1562271X.fm Page 555 Friday, April 29, 2005 7:59 PM
556 Chapter 15 Monitoring and Troubleshooting SQL Server Performance
Building a Workload File
DTA requires you to provide it with a workload that it can analyze. You can provide
the workload in a variety of formats, including a trace file, a trace table, or a Transact-
SQL script.
The most common workload used within DTA is a trace file. You can generate this
trace by using SQL Server Profiler, which ships with a template designed to capture
the data DTA needs to perform its analysis. To generate the trace file, launch Profiler,
select the Tuning trace template, and save the results to a file. Alternatively, you can
load the trace into a table that DTA uses to perform its analysis.
NOTE Using a Transact-SQL script as a workload file
A Transact-SQL script makes for an interesting workload file, which simply contains a batch of SQL
that you want to analyze. Although there isn’t anything earth-shattering about creating a file that
contains a batch of SQL, this option takes on a new meaning when you integrate it with your devel-
opment processes. For example, you can highlight a query in a batch of SQL in the query window
within SSMS, right-click the query, and select Send To Database Engine Tuning Advisor. This action
launches DTA against the SQL batch you highlighted, letting you perform targeted analysis while
you are developing queries.
Configuring DTA to Analyze a Workload
Analyzing a workload in DTA consists of three basic steps:
1. Launch DTA and connect to your server.
2. Select a workfile to analyze.
3. Specify tuning options.
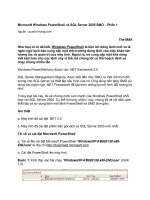
Let’s walk through each of these steps. First, launch DTA so that you can configure a
new analysis session, as shown in Figure 15-14.
Each session you create will be saved, so you can go back and review previous analysis
sessions and view the recommendations that DTA generated. To easily identify ses-
sions, make sure to give each one a descriptive name. You need to specify the work-
load source along with the database for the workload analysis. You also have to
specify the databases and tables that you want to tune within the workload. DTA uses
the database you specify for the workload analysis as the basis for making tuning deci-
sions. And by specifying the databases and tables for tuning, you let DTA ignore some
of the events in the workload file.
C1562271X.fm Page 556 Friday, April 29, 2005 7:59 PM
Lesson 3: Using the Database Engine Tuning Advisor 557
Figure 15-14 Configuring an analysis session
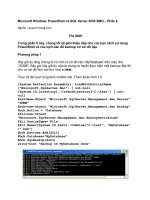
After you specify the general options for the tuning session, click the Tuning Options
tab (see Figure 15-15).
Figure 15-15 Specifying tuning options to consider
C1562271X.fm Page 557 Friday, April 29, 2005 7:59 PM
558 Chapter 15 Monitoring and Troubleshooting SQL Server Performance
One of the most important options to set when configuring a tuning session that
involves workloads from production systems is to limit the tuning time. Otherwise,
DTA could run for several days before completing.
DTA performs its analysis by loading the specified workload and starting the first
command to tune. DTA then interrogates the query optimizer with various options
and compares the query cost that the optimizer returns. DTA repeats this interroga-
tion process until it cannot find any options that produce a query plan of a lower cost.
DTA then logs any recommendations for that query—such as creating an index, an
indexed view, or partitioning the table—and moves on to the next statement to repeat
the process.
CAUTION DTA’s performance impact
DTA actively sends requests to the query optimizer, which then returns a query cost. The query cost
is based on the live distribution statistics for data within the database being tuned. Therefore, DTA
generally uses your production database when it is in an analysis session. Thus, you must be very
careful when executing a DTA analysis because the load it puts on the database can affect perfor-
mance. If possible, restore a backup of your production database on another server and use it for
the DTA analysis session.
In general, you will specify that DTA look for both indexes and indexed views to
create for better performance. However, you can restrict the structures that DTA will
consider.
DTA also analyzes whether partitioning a table might improve query performance.
When you are configuring partitioning options in DTA, keep in mind that if you
are using the SWITCH command with partitioning, you will want to restrict DTA’s
analysis to aligned partitions only.
MORE INFO Partitioning
For information about partitioning, see Chapter 6, “Creating Partitions.”
The final tuning options you can specify for DTA concern whether to keep physical
design structures (PDSs). If you specify the option to keep them all, DTA recom-
mends only creation of indexes, indexed views, or partitioning. If you specify any of
the other options, DTA also includes recommendations regarding dropping struc-
tures if that could improve performance.
With the Advanced Options page, shown in Figure 15-16, you can specify whether
you want to have online or offline recommendations.
C1562271X.fm Page 558 Friday, April 29, 2005 7:59 PM
Lesson 3: Using the Database Engine Tuning Advisor 559
Figure 15-16 Specifying advanced tuning options
NOTE Restrictions on online operations
Online operations are restricted by the edition of SQL Server 2005 that you are running. See SQL
Server 2005 Books Online for more information about the specific capabilities of your edition.
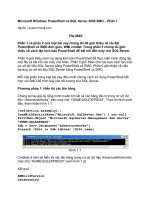
After you configure your DTA tuning session, you can start an analysis by clicking
Start Analysis, which displays extended information on the session, as Figure 15-17
shows.
Figure 15-17 Viewing the analysis progress
C1562271X.fm Page 559 Friday, April 29, 2005 7:59 PM
560 Chapter 15 Monitoring and Troubleshooting SQL Server Performance
DTA displays the progress of each action in the middle of the screen; you will notice
that the majority of the time is spent on the Performing Analysis action. As DTA com-
pletes its analysis of each statement, it displays the statement in the bottom pane.
When DTA encounters a statement that it has already analyzed, it increments the
Frequency counter for that statement and continues to the next statement in the
workload.
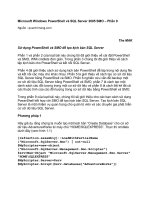
To view DTA’s performance recommendations, select the Recommendations tab (see
Figure 15-18).
Figure 15-18 Viewing performance recommendations
DTA displays all recommendations, and you can sort and filter them by using the col-
umn headers on the grid.
Scrolling to the right displays the definition of each recommendation as a hyperlink
(see Figure 15-19). Clicking a hyperlink launches a pop-up window that contains the
complete Transact-SQL statement required to implement the recommendation.
C1562271X.fm Page 560 Friday, April 29, 2005 7:59 PM
Lesson 3: Using the Database Engine Tuning Advisor 561
Figure 15-19 Viewing performance recommendations continued
Each analysis session produces several reports that you can view by selecting the
Reports tab shown in Figure 15-20.
Figure 15-20 Viewing analysis reports
C1562271X.fm Page 561 Friday, April 29, 2005 7:59 PM
562 Chapter 15 Monitoring and Troubleshooting SQL Server Performance
Selecting a report changes the data in the bottom pane. The only reports that you
can view are shipped with DTA. Although there isn’t an option to add custom
reports, you can export the contents of any report to an XML file from the right-click
menu.
BEST PRACTICES Leveraging trace tables
With DTA, using a trace table can actually provide a more powerful, integrated, and automated
analysis capability than using a trace file. You can set up a job that periodically launches a SQL
Trace to capture a trace and save it to a file. You can then create a second job that explicitly stops
the trace after a given interval. After the trace is stopped, you can move the trace file to a central
location and use fn_tracegettable() to load the trace into a table. By creating one table per SQL
Server instance within a database, you can create a central repository for all traces in your environ-
ment. You can then configure DTA to use your trace table as a workload source for analysis. Set up
DTA to analyze the workload and quit after approximately an hour.
Of course, incremental traces will get loaded into the table. And based on the portion of the table
that DTA has analyzed, you can create a process that executes after an incremental trace is loaded
and removes any rows from the trace table corresponding to queries already analyzed, allowing
each subsequent run of a DTA analysis to work on queries that have not already been covered.
Eventually, after many incremental analysis runs, you will achieve full analysis of the entire
workload.
Remember that when you configure an analysis run, each session is saved and preserves DTA’s
recommendations and reports. You can then clone the session and use the clone to initiate a sub-
sequent analysis run. This capability enables you to quickly and easily use the settings from a
previous run against your trace table to execute another analysis run.
Saving Recommendations from DTA
After a DTA analysis session is complete, you can save DTA’s recommendations
from the Actions menu. When you save recommendations, DTA creates a script
file that contains the Transact-SQL code required to implement all the recommen-
dations.
Instead of saving recommendations to a file, you can apply them directly to a data-
base either immediately or by creating a job in SQL Server Agent to apply them.
However, applying changes directly to a database through DTA is not recom-
mended because this action does not integrate with your source code control sys-
tem and does not maintain your source tree. You also generally have multiple
copies of the same database in development, testing, and production to which you
should apply the changes.
C1562271X.fm Page 562 Friday, April 29, 2005 7:59 PM
Lesson 3: Using the Database Engine Tuning Advisor 563
Quick Check
■ How can you use DTA as a primary tool for performance tuning?
Quick Check Answer
■ Using a workload file generated by SQL Trace, DTA can analyze each state-
ment run against a database to determine whether performance can be
improved by adding indexes, indexed views, partitioning tables, or even
possibly dropping indexes, indexed views, and partitions.
PRACTICE Analyzing a Workload in DTA
In this practice, you will create a workload file and then use that workload file as a
source for DTA to analyze for performance improvements.
1. Open SSMS and connect to your SQL Server instance.
2. Open a new query window and change the context to the AdventureWorks
database.
3. Open SQL Server Profiler (choose Tools, SQL Server Profiler), connect to your
SQL Server instance, and create a new trace.
4. Specify the trace template called Tuning and set Profiler to save the trace to a file.
5. Start the trace.
6. Switch back to your query window and execute several queries against the
AdventureWorks database.
7. Stop the trace and close SQL Server Profiler.
8. Close SSMS without saving your queries.
9. Start DTA and connect to your SQL Server instance.
10. If not already created, create a new session.
11. Specify a name for the session.
12. Select the workload file that you just created in SQL Server Profiler.
13. Select the AdventureWorks database for workload analysis.
14. Select the check box next to the AdventureWorks database and leave the default
for all of the tables.
15. On the Tuning Options tab, leave all default options.
C1562271X.fm Page 563 Friday, April 29, 2005 7:59 PM
564 Chapter 15 Monitoring and Troubleshooting SQL Server Performance
16. Start the analysis. (Click Start Analysis on the toolbar.)
17. After the analysis is complete, review DTA’s output for recommendations and
look at each report DTA generated for the workload.
Lesson Summary
■ DTA takes a workload file as input and then exhaustively tests each query in the
workload file against all possible permutations of indexes, indexed views, and
partitions to come up with the best possible performance recommendations.
■ The most common workload used within DTA is a trace file. You can generate
the trace file by using SQL Server Profiler’s Tuning template, which is designed
to capture the data DTA needs to perform its analysis.
■ Analyzing a workload in DTA consists of three basic steps: launching DTA,
selecting a workfile to analyze, and specifying tuning options.
■ When you save DTA’s recommendations from the Actions menu, DTA will create
a script file that contains the Transact-SQL code required to implement all its
recommendations.
Lesson Review
The following questions are intended to reinforce key information presented in this
lesson. The questions are also available on the companion CD if you prefer to review
them in electronic form.
NOTE Answers
Answers to these questions and explanations of why each answer choice is right or wrong are
located in the “Answers” section at the end of the book.
1. Which types of workloads can DTA use? (Choose all that apply.)
A. Profiler deadlock trace
B. SQL script
C. Table containing trace data
D. Counter log
C1562271X.fm Page 564 Friday, April 29, 2005 7:59 PM
Lesson 3: Using the Database Engine Tuning Advisor 565
2. Which of the following are valid configuration options for tuning a workload?
(Choose all that apply.)
A. Create views
B. Drop indexes
C. Online indexes only
D. Nonclustered indexes
C1562271X.fm Page 565 Friday, April 29, 2005 7:59 PM
566 Chapter 15 Monitoring and Troubleshooting SQL Server Performance
Lesson 4: Using Dynamic Management Views
and Functions
Dynamic management views (DMVs) and Dynamic management functions (DMFs) fill an
instrumentation gap by providing capabilities that DBAs have long needed to effec-
tively manage SQL Server databases. By leveraging the detailed and extremely granu-
lar information that DMVs and DMFs provide, administrators can rapidly diagnose
problems and get systems back online. They can also use these new tools proactively
to spot patterns and take corrective action before outages occur. Although a full dis-
cussion of using DMVs and DMFs is far beyond the scope of this lesson, it will cover
the basics of SQL Server 2005’s new instrumentation infrastructure and how to begin
using these facilities as core data providers within any monitoring process.
After this lesson, you will be able to:
■ Understand the categories of DMVs and DMFs.
■ Identify key performance and monitoring DMVs and DMFs.
Estimated lesson time: 60 minutes
Real World
Michael Hotek
When SQL Server 2000 was released, the marketing hype was that the database
system provided all the functionality of a true enterprise-class database platform.
I’ve always disagreed with that assessment. Although SQL Server 2000 was a
very good product that provided a lot of valuable functionality, it fell short of
what I consider “enterprise class.”
An enterprise-class database platform isn’t simply capable of storing a large
amount of data. It also needs to have very robust and easy-to-access instrumen-
tation that exposes enough detail to let DBAs quickly diagnose problems and
keep the environment working at optimum levels.
SQL Server 2000 essentially provided a black box for DBAs to use. You could
solve most performance problems by using SQL Trace to extract data from the
black box and then aggregate it to find the queries that were affecting perfor-
mance. However, this process consumed a large amount of time. In addition,
C1562271X.fm Page 566 Friday, April 29, 2005 7:59 PM
Lesson 4: Using Dynamic Management Views and Functions 567
there were entire classes of problems that were extremely difficult to find and
solve, as anyone having to use sp_lock would know.
During the Consumer Technology Preview (CTP) cycle for SQL Server 2005, I
was working with an independent software vendor (ISV) that was benchmark-
ing its application on SQL Server 2005. This was a new version of the applica-
tion, containing new functionality that hadn’t been through rigorous
performance testing yet. The purpose of the first phase of the benchmark was to
determine whether SQL Server 2005 performance characteristics were going to
be good enough to let the ISV aggressively push forward with its plans or if it
was going to need to wait for awhile until SQL Server performance caught up
with its needs.
We launched the first few tests and received mixed results. The performance was
within the ISV’s broad target, but it should have been much better. During the
third run, we started looking at SQL Server 2005’s missing index DMVs and
found two indexes that should have been created but were somehow missed.
Leveraging SQL Server’s new online index creation capability, we added these
indexes during the load test to test whether this process would cause the appli-
cation to crash. The indexes were created without impact, and the application’s
performance immediately improved.
This entire process took about two minutes from start to finish. In SQL Server
2000 and earlier versions, we would have had to start a SQL Server Profiler trace,
captured a significant portion of the queries issued against the test, analyzed the
trace output, found the queries we needed to look at, and then evaluated the
code to determine what improvements we needed to make. With prior versions,
we might have been lucky to complete this process in half a day. After analyzing
lots of query plans, we also would have found only one of the indexes that we
created. If we had been analyzing a production system, the DMVs and DMFs in
SQL Server 2005 would have saved us at least four hours of analysis time that we
could have then devoted to other critical DBA tasks such as sleeping.
Key Performance and Monitoring DMVs and DMFs
DMVs and DMFs are divided into dozens of categories that encompass various features,
subsystems, and statistical categories. Categorization of the views and functions is
achieved by using a standardized naming convention in which the first part of the
C1562271X.fm Page 567 Friday, April 29, 2005 7:59 PM
568 Chapter 15 Monitoring and Troubleshooting SQL Server Performance
name, or prefix, indicates the category for a DMV or DMF. Table 15-1 lists the prefixes
for each category and the general purpose of the DMVs or DMFs in each category.
Database Statistics
You can use one DMV and two DMFs to gather basic index usage information within
a database.
The sys.dm_db_index_usage_stats DMV contains core statistics about each index
within a database. Use this view when you need to find the number of seeks, scans,
lookups, or updates that have occurred with an index.
BEST PRACTICES Using sys.dm_db_index_usage_stats
The sys.dm_db_index_usage_stats DMV is a good place to start to find any indexes that the query
optimizer is not using. If the system has been running for awhile, and an index does not have any
seeks, scans, or lookups registered for it, it is a strong possibility that the index is not being used to
satisfy any queries. Or an index might show activity but is no longer being used. You can determine
the last time an index was used by examining the last_user_seek, last_user_scan and last_user_lookup
columns.
Of much more interest on a day-to-day basis, however, are the sys.dm_db_index_
operational_stats and sys.dm_db_index_physical_stats DMFs.
The index_operational_stats function takes four parameters: database_id, object_id,
index_id, and partition_id. This function displays all the current I/O statistics related
to locking, latching, and access. You use this function to find out how heavily a par-
ticular index is being used in terms of modifications as well as scans or lookups. You
would also reference the output of this function when you are concerned about lock-
ing or latching contention in the database.
Table 15-1 DMV and DMF Prefixes
Prefix General purpose
dm_db_* Provides general database statistics such as space and index
utilization.
dm_exec_* Provides query statistics.
dm_io_* Provides I/O statistics.
dm_os_* Provides hardware-level information.
C1562271X.fm Page 568 Friday, April 29, 2005 7:59 PM
Lesson 4: Using Dynamic Management Views and Functions 569
The index_physical_stats function takes five parameters: database_id, object_id,
index_id, partition_id, and mode. This function returns row size and fragmentation
information. In previous versions of SQL Server, DBCC SHOWCONTIG was used to
return this type of data.
The final set of views and functions essentially provide a real-time index analysis. The
views beginning with sys.dm_db_missing_index_* track indexes that could be created
against your database. When queries are executed that cause the table to be scanned,
and SQL Server determines that it could have taken advantage of an index to satisfy
the query, it logs entries in sys.dm_db_missing_index_details, sys.dm_db_missing_
index_group_stats, and sys.dm_db_missing_index_groups. The group stats view con-
tains counters for the number of times a particular index could be used as well as the
seeks, scans, and some basic costing values. The index details view contains informa-
tion about the table that should have an index created on it as well as the column for
that index. The index groups view provides an aggregation functionality.
By combining these three views together, you can proactively analyze new indexes
while a system is operating without requiring workload traces to be generated for
analysis in DTA. Although these views are not a replacement for DTA, which also con-
siders indexed views and partitions and provides a more exhaustive analysis of
indexes, they can be a very effective initial level of analysis.
BEST PRACTICES Calculating the value of proposed indexes
The most difficult decision to make is which of the indexes proposed by the sys.dm_db_missing_index*
views can provide the most benefit. Applying some basic calculations, you can derive a numerical
comparison based on SELECT activity only for each of the proposed indexes. The following example
shows the code you can use to apply the calculations:
SELECT *
FROM
(SELECT user_seeks * avg_total_user_cost * (avg_user_impact * 0.01) AS index_advantage,
migs.* FROM sys.dm_db_missing_index_group_stats migs) AS migs_adv
INNER JOIN sys.dm_db_missing_index_groups AS mig ON migs_adv.group_handle =
mig.index_group_handle
INNER JOIN sys.dm_db_missing_index_details AS mid ON mig.index_handle = mid.index_handle
ORDER BY migs_adv.index_advantage
On operational systems, values above 5,000 indicate indexes that should be evaluated for creation.
When the value passes 10,000, you generally have an index that can provide a significant perfor-
mance improvement for read operations.
This algorithm accounts only for read activity, so you will always want to consider the impact of
maintenance operations as well.
C1562271X.fm Page 569 Friday, April 29, 2005 7:59 PM
570 Chapter 15 Monitoring and Troubleshooting SQL Server Performance
Query Statistics
The query statistics DMVs and DMFs encompass the entire group of functionality
related to executing a query in SQL Server. This functionality is broken into two dis-
tinct groups: connections to the instance and queries executing inside the engine.
Connection information is contained in two DMVs: sys.dm_exec_requests and
sys.dm_exec_sessions. Each connection to a SQL Server instance is assigned a system pro-
cess ID (SPID), with information about each session available in sys.dm_exec_sessions.
You can retrieve session information regarding the user or application creating the
connection, login time, connection method, and a variety of information concerning
the high-level statistics for the state of the connection.
BEST PRACTICES sys.dm_exec_sessions
In previous versions of SQL Server, you would retrieve the information that sys.dm_exec_sessions
provides by executing the sp_who or sp_who2 system stored procedures, or by retrieving rows from
the sysprocesses table. However, sys.dm_exec_sessions contains significantly more information than
previous versions of SQL Server logged.
Each session in SQL Server will normally be executing a single request. However, it is
possible for a single SPID to spawn multiple requests. You can retrieve statistics about
each executing request from sys.dm_exec_requests. The requests DMV forms the basis
for resolving many performance issues.
The information contained within this view can be separated into four categories:
query settings, query execution, transactions, and resource allocation. Query settings
encompass the options that can be applied to each request executed, such as quoted
identifiers, American National Standards Institute (ANSI) nulls, arithabort, transac-
tion isolation level, and so on. Query execution encompasses items such as the mem-
ory handle to the SQL statement, the memory handle to the query plan, CPU time,
reads, writes, the ID of the scheduler, the SPID blocking the request if applicable, and
so on. Transactions encompass such items as the transaction ID, the number of open
transactions, the number of result sets, the deadlock priority, and related statistics.
Resource allocation encompasses the wait type and wait time.
IMPORTANT The DBA’s friend: sys.dm_exec_requests DMV
Because the sys.dm_exec_requests view is used to determine many different operation states, it will
become an extremely familiar tool for any DBA managing a SQL Server server.
C1562271X.fm Page 570 Friday, April 29, 2005 7:59 PM
Lesson 4: Using Dynamic Management Views and Functions 571
Detailed query statistics are contained within the sys.dm_exec_query_stats and
sys.dm_exec_cached_plans DMVs. Query stats provides detailed statistics related to the
performance of a query as well as the amount of resources the query consumed.
Using this DMV, you can determine the number of reads (logical and physical), writes
(logical and physical), CPU, and elapsed time for a query. The DMV tracks these sta-
tistics based on the SQL handle and also contains the plan handle.
MORE INFO Query plans, execution plans, and the query optimizer
Every SQL statement that is executed must be compiled. After it is compiled, it is stored in the
query cache and identified by a memory pointer called a handle. The SQL Server query optimizer
then must determine a query plan for the statement. After the query plan is determined, it is also
stored in the query cache and identified by a memory pointer. The compiled plan then generates
an execution plan for the query to use. When the query executes, the sys.dm_exec_query_stats DMV
tracks the SQL handle with the associated plan handle for that execution, as well as all the statistical
information for that query. The details of query plans, execution plans, and the query optimizer are
beyond the scope of this book, but you can find comprehensive coverage of these topics in the
book Inside SQL Server 2005: The Storage Engine, by Kalen Delaney (Microsoft Press, 2007).
You use the sys.dm_exec_cached_plans DMV, which is similar to syscacheobjects in pre-
vious SQL Server versions, to retrieve information about query plans. SQL Server
query plans can be of two basic types: compiled and execution. A compile plan is gen-
erated for each unique SQL statement that has been executed. Parameters and literals
are substituted with generic placeholders so that execution of a stored procedure with
varying values for parameters, for example, is still treated as the same SQL statement
and does not cause the optimizer to create additional plans. Compiled plans are reen-
trant, meaning that they can be reused.
An execution plan, on the other hand, is created for each concurrent execution of a
particular statement. Thus, if 15 connections were executing the same stored proce-
dure concurrently, regardless of whether the parameters were the same, there would
be one compiled plan and 15 execution plans in the query cache.
Although the SQL handle and the plan handle are meaningful to the SQL Server
engine, they are meaningless to a person. So SQL Server provides two functions to
translate the information. The sys.dm_exec_sql_text DMF takes a single parameter of
the SQL handle and returns in text format the query that was executed. The
sys.dm_exec_query_plans DMF takes a single parameter of the plan handle and returns
an XML showplan.
C1562271X.fm Page 571 Friday, April 29, 2005 7:59 PM
572 Chapter 15 Monitoring and Troubleshooting SQL Server Performance
BEST PRACTICES An easier way to translate handle information
Although it might be interesting to find handles in the query stats or cached plan DMVs and then
input them into the DMFs to translate everything into human-readable format, there is an easier
way to achieve this translation. The CROSS APPLY operator invokes a table-valued function for each
row within a table. Thus, you can use the following queries to apply this translation for given rows
in the query stats or cached plans DMVs:
SELECT * FROM sys.dm_exec_query_stats CROSS APPLY sys.dm_exec_query_plan(plan_handle)
SELECT * FROM sys.dm_exec_query_stats CROSS APPLY sys.dm_exec_sql_text(sql_handle)
SELECT * FROM sys.dm_exec_cached_plans CROSS APPLY sys.dm_exec_query_plan(plan_handle)
Because an operational system can easily have thousands of rows in sys.dm_exec_query_stats or
sys.dm_exec_cached_plans, you shouldn’t execute the previous queries without providing a WHERE
clause to restrict the scope.
I/O Statistics
The DMVs and DMFs that deal with I/O track the physical I/O to the data files and
the log files for each database.
A key DMF in this category is sys.dm_io_virtual_file_stats, which takes two parameters:
database ID and file ID (both of which can be null). This DMF is comparable to the
fn_virtual_filestats() function in SQL Server 2000, but it contains more granular infor-
mation to enable you to make better decisions. The virtual file stats DMF breaks down
the physical I/O written to each file within a database into reads, writes, bytes read,
and bytes written. It also tracks I/O stalls, broken down by reads and writes. The I/O
statistics are cumulative from the time the SQL Server instance was started. This DMF
helps you evaluate whether you have an I/O imbalance between files for your data-
base. And this information, in turn, enables you to determine whether tables or
indexes should be moved to provide better throughput from physical reads or writes.
Another useful DMF in the I/O statistics category is sys.dm_io_pending_io_requests,
which contains a row for each request that is waiting for an I/O operation to complete.
On a very active system, you always find requests that are pending. However, if you
find a particular request that has to wait a significant amount of time or you have very
large numbers of requests that are pending all the time, you might have a disk I/O
bottleneck.
Hardware Statistics
The final category of DMVs covered in this lesson deals with the operating system
interface between SQL Server and Windows as well as the physical hardware
interaction.
C1562271X.fm Page 572 Friday, April 29, 2005 7:59 PM
Lesson 4: Using Dynamic Management Views and Functions 573
Although you can use System Monitor to gather a variety of counters, the logs gathered
are not formatted to allow you to easily extract and correlate the data with a variety of
other sources. To get a result set that you can more easily manipulate, you can use the
sys.dm_os_performance_counters DMV. This view provides all the counters that a SQL
Server instance exposes in an easily manipulated result set.
NOTE Accessing hardware counters
Keep in mind that the performance counters DMV provides only SQL Server counters and does not
allow access to any hardware counters. To access hardware counters, you have to make Windows
Management Instrumentation (WMI) calls to pull the data into a result set that you can then manipulate.
Another key DMV for hardware statistics is sys.dm_os_wait_stats, which provides the
same data that you could gather by using DBCC SQLPERF(WAITSTATS) in SQL Server
2000. This DMV plays an important role in any performance analysis by aggregating
the amount of time processes had to wait for various resources to be allocated.
MORE INFO Wait types
SQL Server 2000 had 77 wait types. SQL Server 2005 exposes 194 wait types. Although a complete
discussion of each wait type is beyond the scope of this book, for details about wait types see Gert
Drapers’ SQLDEV.Net Web site at www.sqldev.net/misc/sp_waitstats.htm.
Quick Check
■ What function do DMVs and DMFs play in a monitoring and analysis
system?
Quick Check Answer
■ DMVs and DMFs provide a rich granular instrumentation platform for
SQL Server 2005, providing the core resources for gathering virtually any
type of data for an instance or a database.
Lesson Summary
■ Prior versions of SQL Server implemented a basic “black box” approach to the
database engine, which made it difficult to manage and monitor. SQL Server
2005 opens up the black box by providing a large set of detailed interfaces that
expose virtually every operational statistic within the database engine.
C1562271X.fm Page 573 Friday, April 29, 2005 7:59 PM
574 Chapter 15 Monitoring and Troubleshooting SQL Server Performance
■ SQL Server’s DMVs and DMFs are broken into four general categories, providing
information about database statistics, query statistics, I/O statistics, and hard-
ware statistics.
Lesson Review
The following questions are intended to reinforce key information presented in this
lesson. The questions are also available on the companion CD if you prefer to review
them in electronic form.
NOTE Answers
Answers to these questions and explanations of why each answer choice is right or wrong are
located in the “Answers” section at the end of the book.
1. You notice that performance of certain high-volume queries has suddenly
degraded, and you suspect that you have contention issues within your data-
bases. Which DMV or DMF do you use to determine whether you have a conten-
tion issue and which users are being affected?
A. sys.dm_os_performance_counters
B. sys.dm_os_wait_stats
C. sys.dm_db_index_physical_stats
D. sys.dm_exec_requests
C1562271X.fm Page 574 Friday, April 29, 2005 7:59 PM
Lesson 5: Correlating Performance and Monitoring Data 575
Lesson 5: Correlating Performance and Monitoring Data
SQL Server Profiler, System Monitor, DTA, DMVs, and DMFs each capture a piece of
monitoring data. Although you can use each individually to solve problems, their true
value comes when you use all these tools in a cohesive manner to monitor systems.
Because SQL Server does not operate in a vacuum, this integration enables you to
evaluate data from all layers: from the disk subsystem, to the operating system,
through the memory space, into the query optimizer, through the data structures,
and out to the client.
The sections in this lesson provide examples of correlating data from multiple sources
to understand a performance issue. These examples are intended to provide a starting
point to demonstrate how each of the tools fit together; they do not provide an
exhaustive treatment of all the ways you can use the tools together, which would eas-
ily fill an entire book. Each of the scenarios in this lesson demonstrates how data from
one tool could lead you down the incorrect path, whereas correlating multiple pieces
of data enables you to pinpoint the correct bottleneck or issue in the system.
After this lesson, you will be able to:
■ Describe the basic processing architecture for queries.
■ Correlate System Monitor data with a SQL Server Profiler trace.
■ Correlate DMVs/DMFs with SQL Server Profiler traces.
■ Correlate DMVs/DMFs with System Monitor data.
■ Correlate several DMVs/DMFs to evaluate performance.
■ Combine data from SQL Server Profiler, System Monitor, DMVs, and DMFs into a
consolidated performance view.
Estimated lesson time: 30 minutes
Basic Query Processing Architecture
SQL Server uses a cooperative multiprocessing model instead of a symmetric multipro-
cessing model. The main difference between these two processing models is the way
processor scheduling is handled. In a cooperative model, only a single thread is exe-
cuting at one time on a processor, and the thread cedes control of the processor when
it does not have work to perform. In this way, it allows multiple threads to cooperate
with each other to maximize the amount of actual work being performed.
C1562271X.fm Page 575 Friday, April 29, 2005 7:59 PM
576 Chapter 15 Monitoring and Troubleshooting SQL Server Performance
Controlling this cooperative behavior is the job of the User Mode Scheduler (UMS).
When SQL Server starts, it creates one UMS for each logical or physical processor that
it is allowed to use on the system. Instead of handing off threads to the operating sys-
tem to schedule on a processor, SQL Server performs its own scheduling via the UMS.
As connections are made to SQL Server, the corresponding SPID is allocated to a
UMS. This allocation process uses a basic balancing algorithm that seeks to spread
the processing as evenly among the UMSs as possible. Although requests by a partic-
ular connection will generally execute on the same UMS, it is possible for a particular
request to be handled by any UMS that is available.
Each UMS uses three queues to process queries: runnable, running, and waiting.
When a query is executed, it is assigned a thread and placed into the runnable queue.
Threads are taken off this queue on a first in, first out (FIFO) basis. The thread is
placed into the running queue and scheduled on the processor. At the instance the
thread needs to wait for a resource such as I/O, network, or memory to be allocated,
it is swapped off the processor and moved to the waiting queue.
The thread lives on the waiting queue for as long as is necessary to wait for the
resource to be allocated to the thread. During this time, SQL Server tracks the amount
of time the thread is waiting, as indicated by the wait time, as well as the resource that
it is waiting on, as indicated by the wait type.
After the resource is freed up, the thread is swapped off the waiting queue and placed
at the bottom of the runnable queue, where it must wait behind all other processes to
reach the top of the runnable queue. The amount of time a process spends in the run-
nable queue before being swapped onto the processor is called the signal wait.
What does all of this information about processor scheduling internals have to do
with monitoring or performance? When a query executes, it requires a variety of
resources. The query has to be compiled, which requires memory and processor
resources. The compiled plan has to be generated and stored in the query cache,
which requires memory and processor. The executable plan then has to be swapped
onto a processor to execute the query, which requires processor, memory, and poten-
tially disk access. As the query reads and writes data, locks must be established,
requiring yet more memory, processor, and possibly disk I/O. Finally, the results of
the query have to be packaged and sent back to the client, which requires memory,
processor, and network I/O.
C1562271X.fm Page 576 Friday, April 29, 2005 7:59 PM