Báo cáo khoa học: " Testing the portal imager GLAaS algorithm for machine quality assurance" pot
Bạn đang xem bản rút gọn của tài liệu. Xem và tải ngay bản đầy đủ của tài liệu tại đây (1.48 MB, 20 trang )
BioMed Central
Page 1 of 20
(page number not for citation purposes)
Radiation Oncology
Open Access
Methodology
Testing the portal imager GLAaS algorithm for machine quality
assurance
G Nicolini
1
, E Vanetti
1
, A Clivio
1,3
, A Fogliata
1
, G Boka
1,4
and L Cozzi*
1,2
Address:
1
Oncology Institute of Southern Switzerland, Medical Physics Unit, Bellinzona, Switzerland,
2
University of Lausanne, Faculty of
Medicine, Lausanne, Switzerland,
3
University of Milan, Medical Physics Specialisation School, Milan, Italy and
4
Latvian Oncology Center of Riga
Eastern University Clinical Hospital. Dept. of Dosimetry., Riga, Latvia
Email: G Nicolini - ; E Vanetti - ; A Clivio - ; A Fogliata - ;
G Boka - ; L Cozzi* -
* Corresponding author
Abstract
Background: To report about enhancements introduced in the GLAaS calibration method to
convert raw portal imaging images into absolute dose matrices and to report about application of
GLAaS to routine radiation tests for linac quality assurance procedures programmes.
Methods: Two characteristic effects limiting the general applicability of portal imaging based
dosimetry are the over-flattening of images (eliminating the "horns" and "holes" in the beam profiles
induced by the presence of flattening filters) and the excess of backscattered radiation originated
by the detector robotic arm supports. These two effects were corrected for in the new version of
GLAaS formalism and results are presented to prove the improvements for different beams,
detectors and support arms. GLAaS was also tested for independence from dose rate (fundamental
to measure dynamic wedges).
With the new corrections, it is possible to use GLAaS to perform standard tasks of linac quality
assurance. Data were acquired to analyse open and wedged fields (mechanical and dynamic) in
terms of output factors, MU/Gy, wedge factors, profile penumbrae, symmetry and homogeneity. In
addition also 2D Gamma Evaluation was applied to measurement to expand the standard QA
methods. GLAaS based data were compared against calculations on the treatment planning system
(the Varian Eclipse) and against ion chamber measurements as consolidated benchmark.
Measurements were performed mostly on 6 MV beams from Varian linacs. Detectors were the PV-
as500/IAS2 and the PV-as1000/IAS3 equipped with either the robotic R- or Exact- arms.
Results: Corrections for flattening filter and arm backscattering were successfully tested.
Percentage difference between PV-GLAaS measurements and Eclipse calculations relative doses at
the 80% of the field size, for square and rectangular fields larger than 5 × 5 cm
2
showed a maximum
range variation of -1.4%, + 1.7% with a mean variation of <0.5%. For output factors, average
percentage difference between GLAaS and Eclipse (or ion chamber) data was -0.4 ± 0.7 (-0.2 ± 0.4)
respectively on square fields. Minimum, maximum and average percentage difference between
GLAaS and Eclipse (or ion chamber) data in the flattened field region were: 0.1 ± 1.0, 0.7 ± 0.8, 0.1
± 0.4 (1.0 ± 1.4, -0.3 ± 0.2, -0.1 ± 0.2) respectively. Similar minimal deviations were observed for
flatness and symmetry.
Published: 21 May 2008
Radiation Oncology 2008, 3:14 doi:10.1186/1748-717X-3-14
Received: 26 February 2008
Accepted: 21 May 2008
This article is available from: />© 2008 Nicolini et al; licensee BioMed Central Ltd.
This is an Open Access article distributed under the terms of the Creative Commons Attribution License ( />),
which permits unrestricted use, distribution, and reproduction in any medium, provided the original work is properly cited.
Radiation Oncology 2008, 3:14 />Page 2 of 20
(page number not for citation purposes)
For Dynamic wedges, percentage difference of MU/Gy between GLAaS and Eclipse (or ion
chamber) was: -1.1 ± 1.6 (0.4 ± 0.7). Minimum, maximum and average percentage difference
between GLAaS and Eclipse (or ion chamber) data in the flattened field region were: 0.4 ± 1.6, -1.5
± 1.8, -0.1 ± 0.3 (-2.2 ± 2.3, 2.3 ± 1.2, 0.8 ± 0.3) respectively.
For mechanical wedges differences of transmission factors were <1.6% (Eclipse) and <1.1% (ion
chamber) for all wedges. Minimum, maximum and average percentage difference between GLAaS
and Eclipse (or ion chamber) data in the flattened field region were: -1.3 ± 0.7, -0.7 ± 0.7, -0.2 ±
0.2 (-0.8 ± 0.8, 0.7 ± 1.1, 0.2 ± 0.3) respectively.
Conclusion: GLAaS includes now efficient methods to correct for missing "horns" and "holes"
induced by flattening filter in the beam and to compensate for excessive backscattering from the
support arm. These enhancements allowed to use GLAaS based dosimetric measurement to
perform standard tasks of Linac quality assurance with reliable and consistent results. This fast
method could be applied to routine practice being also fast in usage and because it allows the
introduction of new analysis tools in routine QA by means, e.g., of the Gamma Index analysis.
1. Background
Electronic portal imagers based on amorphous silicon flat
panels are widely available in clinics and of natural inter-
est for dosimetric purposes due to their intrinsic features.
Many efforts have been put in develop methods to use
these detectors for pre-treatment IMRT verification
because of the possibility to reduce dramatically the time
needed to perform the quality assurance processes com-
pared to other devices, normally too time consuming.
A lot of publications investigated the performances and
characteristics of the amorphous silicon (aSi) detector
response [1-8]. One of the key factors, for dosimetric pur-
poses, of aSi detectors is certainly their linear response in
dose and dose rate, feature that allows a theoretically sim-
ple calibration process and a direct usage as dosimeters in
many clinical and physical applications. One limiting fac-
tor, that often blocked a wide dosimetric usage of aSi's is
that, in most of the cases, these detectors are part of the
electronic portal imaging systems attached to linear accel-
erators and, in order to produce better image quality on
the patients, basic detector calibration includes correc-
tions for dark current and flood field aiming to generate
an over flattened image from open fields. The conse-
quence is that there is a basic difficulty in reproducing the
off-axis ratio of normal clinical beams generated by the
flattening filter (and other components) and ''corrected"
for by the imager electronics. To complicate the dosimet-
ric usage of aSi detectors there is the need to properly
determine their response (in terms of linearity slope) at
different field sizes and different energies and spectra, e.g.
for primary or transmitted radiation (through multileaf
collimators or through wedges).
Another important fact that has been originally pointed
out by [9,10] for the Varian Portal Vision but in principle
relevant for all similar systems, relates to the fact that aSi
detectors are mounted on support arms connected to
linacs without sufficient back-scatter material (due to
mechanical reasons) to avoid or minimize the influence
of the arm itself in the signal generation (some radiation
back-scattered by the arm impinges on the aSi active area).
As a consequence of this fact, the group of Siebers meas-
ured up to 5% asymmetry in the detector signal when
changing field size from the conditions of image calibra-
tion (the largest field size) due to the different amount of
backscattered radiation.
In summary, the problems mentioned above, together
with some other practical difficulty and the absence of
integrated software tools, limited the usage of aSi detec-
tors as standard dosimeters to perform basic quality assur-
ance tasks in radiation oncology. To achieve this goal,
various algorithms converting the raw data acquired by
the imagers into dose readings have to be implemented
and tuned to overcome the undesired features variably
affecting the dose response.
Our group developed and implemented in clinical prac-
tice such an algorithm, called GLAaS [11,12] to convert
images from the aSi detectors PV-aS500 and PV-aS1000
from Varian Medical Systems, into dose matrices. In the
previous publications the application of GLAaS was dis-
cussed and reported limitedly to pre-treatment IMRT ver-
ifications. GLAaS is a calibration algorithm mainly based
on the application, on a pixel-by-pixel basis, of specific
dose response curve parameters, pre-determined in an
empiric way, and accounting for field size, primary or
transmitted radiation and dynamic movement of multi-
leaf collimator (for IMRT); the calibration could be per-
formed at any desired depth in water equivalent materials.
GLAaS did not added any 'calculation' or 'convolution'
element in the process as this would correspond, in prac-
tice, to generate a simplified dose calculation engine from
Radiation Oncology 2008, 3:14 />Page 3 of 20
(page number not for citation purposes)
measured data for comparison against other measure-
ments or other calculation engines (e.g. from the treat-
ment planning systems). Power of GLAaS is the capability,
with a minimal data manipulation, namely a simple
direct calibration process, to convert raw measurements
into absolute dose matrices usable for a variety of applica-
tions. In addition, the methods developed for GLAaS are
quite flexible since, most of the parameters needed for its
application are either determined on a single shot basis
during its ''commissioning" or are derived from informa-
tion contained, e.g., in the DICOM-RT structures of RT-
Plans if GLAaS is applied to verify measurements against
calculations performed by treatment planning systems
(TPS).
Aim of the present study is to report about recent
improvements to the basic GLAaS to better account for the
general weak points mentioned above: a correction
method to take into account the variation of off-axis ratio
mostly determined by the flattening filter (FF) and a cor-
rection for the different arm backscattering when different
field sizes are applied. In addition, GLAaS has been vali-
dated and adapted to operate with different dose rates
(either fixed or variable during data acquisition) testing
the eventual problem of saturation at high frequencies
(depending from the read-out electronics). Finally,
GLAaS, have been validated also for high dose per field
deliveries (so far it was used in clinical applications lim-
ited to 2 Gy per field).
The reason for exploring these improvements was the
intention to generalize the field of application of GLAaS
based dosimetry moving from IMRT specific tests to peri-
odic Linac Quality Assurance programmes of the radia-
tion beams. For this reason, data will be reported about
investigations performed on a variety of test conditions
on open square, rectangular, symmetric or asymmetric
fields as well as for fields with mechanical or dynamic
wedges. The results on output and wedge factors and on
beam penumbra, homogeneity and symmetry characteris-
tics will demonstrate the potentials of GLAaS as a fast and
practical tool for routine periodic machine based quality
assurance procedures. A further step, currently in its final
development stage, will expand GLAaS to the verification
of arc therapies, particularly for dynamic conformal arcs
and intensity modulated arcs with fixed or variable beam
delivery features (e.g. variable dose rate).
2. Methods
The GLAaS algorithm [11] to convert raw images acquired
with the portal imager into dose matrices has been used
for this study. GLAaS has been configured to convert
images acquired without any buildup on the PV cassette
into dose at the depth of maximum dose d
max
at the same
source-detector distance SDD.
A detailed description of the GLAaS algorithm, developed
originally for pre-treatment IMRT verification, can be
found in the original manuscript [11] and the description
of its extension to the set-up setting allowing converting
raw images into dose matrices at the depth of d
max
is con-
tained in [12]. In this study we adopted all the methods
described there and the recommended measuring depth.
A summary of the algorithm logic and of the main equa-
tions, as well as a review of the experimental set-up are
provided here in Appendix 1.
As pointed out also in the appendix, given the different
nature of the conventional radiation fields with respect to
IMRT fields, the latter being built as sequences of variable
MLC apertures, it was necessary to introduce some ele-
mentary change in the basic definitions of fields and seg-
ments (used to discriminate in the GLAaS between areas
of detector receiving primary or transmitted radiation).
For open and wedged fields, it was intuitively assumed
that one single radiation segment is concurring to the
image generation to which is applied the whole GLAaS
computation for primary radiation (transmission below
collimating jaws is assumed to be negligible). For
dynamic wedges, in principle it should be necessary to
define a sequence of segments of progressively smaller
size, following the jaws during motion. In practice it is
sufficient to use one single segment, defined by the largest
jaws opening since this contribution dominates over the
entire field delivery. More details are provided in appen-
dix 1.
The present report is divided into two main sections: the
first is mostly devoted to describe the improvements
introduced in GLAaS concerning the limitations described
in the introduction (and called here flattening filter and
arm backscattering corrections). Also the verification of
GLAaS sensitiveness to various dose rates is addressed.
These improvements were necessary to expand GLAaS
field of application to quality assurance procedures differ-
ent from IMRT. The second part of the study is devoted to
a summary of GLAaS performances when it is applied to
radiation tests in the framework of routine linac Quality
Assurance.
To perform the present study most of the data were
acquired on a Clinac 6EX (6 MV beam) equipped with a
Portal Vision PV-aS500/IAS2 (connected to the linac gan-
try through the robotic arm called R-arm). These data were
used to test GLAaS improvements, machine QA of both
static and dynamic (as dynamic wedges) fields. The fol-
lowing PV-aS500 parameters' setting was used: SyncMode
= 0, Rows per PVSync = 384, Synchronized Delay = 0,
Number of Reset Frames = 0.
Radiation Oncology 2008, 3:14 />Page 4 of 20
(page number not for citation purposes)
To validate the generality of the improvements and to ver-
ify some of the features described below, some test were
repeated also on a second linac with 6 and 18 MV photon
beams and equipped with a PV-aS1000/IAS3 mounted on
the so called Exact-arm. In this case, EPID parameter set-
tings were: Acquisition Technique=Integrated Image, Rea-
dout=Sync-Integrated. Specific comments or results are
here reported only if different from what is presented or
useful for discussion.
For simplicity, unless explicitly mentioned, all results will
refer to the 6MV beam. Results and findings for the high
energy beam are fully consistent and would not add any-
thing to the value of the report. In addition, the validation
of the GLAaS performances on different beam energies
was reported in [12] proving the independence of GLAaS
from beam energy.
Most of the dose matrices used to validate the methods,
were derived from calculations performed with the Varian
Eclipse treatment planning system, version 7.5.51, using
the AAA photon dose calculation algorithm, version
8.0.05. Eclipse calculations were performed in a water
phantom, at the depth of the maximum dose, (d
max
= 1.5
cm for 6MV), at the distance SDD (source-detector dis-
tance) of 100 cm for PV-aS1000/IAS3 (or 140 cm for PV-
aS500/IAS2).
To strengthen the validation process, also measurements
performed with ion chambers were used as reference.
These data were acquired in a real water phantom at the
depth of d
max
and proper SDD with a 0.125 cm
3
volume
ion chamber for point and profiles acquisitions. For
Enhanced Dynamic Wedges (EDW) the linear array of 48
ion chamber PTW LA48, in the same measuring condi-
tions, was used and in the tables and figures referenced
simply as ion chamber.
2.1 Enhancing GLAaS
a) The flattening filter correction
The basic process of image calibration in an electronic
portal imager, and in particular for the Varian PortalVi-
sion (PV), includes the acquisition of a field as wide as the
detector area (a 'flood field') used to equalize the detector
reading through the whole area to improve image quality.
In this way, the effect of the flattening filter in the machine
output, generating the well-known "horns" in the most
peripheral region of the fields is mostly canceled from PV
images. For dosimetry purposes, it is then necessary to re-
include this feature of the radiation beams, eventually off-
line, if the detector shall be used as a reliable dosimeter for
open fields. For IMRT fields, as discussed in [12] this
problem was of secondary importance since the signifi-
cant contribution from radiation transmitted below the
multileaf collimator smears out the effect. In this study we
introduced a first order simple correction in GLAaS, on
the primary radiation only, that operates through a simple
correction matrix determined once during the configura-
tion of the GLAaS and to be eventually updated if major
interventions on beam steering are introduced. This
matrix is obtained computing the ratio, point by point,
between a reference dose matrix (measured or computed
by Eclipse at the chosen configuration (in terms of source
detector distance, SDD, and depth equal to d
max
)) for the
field size covering the whole detector area, and the corre-
sponding matrix from the imager where the points equal
the dose on the central axis for that field. This correction
matrix is used as a pixel by pixel multiplicative factor to be
applied only to the primary radiation component in the
GLAaS formalism. More sophisticated methods could be
elaborated but the cost/effect benefit should be carefully
evaluated with respect to this first-order elementary
approach.
b) The PV arm backscattering correction
The backscatter radiation contribution originated by the
portal imager support structure and discussed in [9,10], is
automatically compensated by the flood field image
acquisition during the imager calibration procedure and
hence it is properly accounted for only for the largest field
size covering the entire active detector area. When the field
size is decreased, also the amount of backscattered radia-
tion from the arm is decreased, and the intrinsic correc-
tion from the flood field tends to over-correct for this
effect. Visually and quantitatively this ends, for smaller
fields, in lowering the measured dose in the part of the
field seeing the support arm, i.e. generating slightly asym-
metric fields. The effect is more pronounced in the half
portion of the beam toward the gantry, where the
mechanical and electrical components of the arm are
positioned. As for the flattening filter correction, the rele-
vance of this effect on IMRT fields was of smaller impor-
tance compared to the proper management of the
effective field size of the sliding window and to the proper
discrimination between primary and transmitted radia-
tion. For open and partially for wedged fields it is instead
fundamental to minimise all systematic and known
sources of perturbation in the measurements and, for this
reason, a method to compensate for this effect was devel-
oped and implemented in GLAaS. Similarly to the flatten-
ing filter case, a first order correction method is used. For
all the square fields acquired in the configuration phase
(ranging from 5 × 5 cm
2
to the maximum allowed field
size), the ratio between the readings of the half portion of
the field image seeing the arm (in the Varian convention
the +y direction) and the half portion of the field not see-
ing the arm (-y) was computed. These matrices were then
made linear to obtain, per each matrix, a family of angular
coefficients of the y profile bending as a function of x (the
arm backscatter contribution is slightly not symmetric
Radiation Oncology 2008, 3:14 />Page 5 of 20
(page number not for citation purposes)
with respect to the x axis). Since the arm backscattering
contribution depends quite strongly on the field size,
being more intensive for smaller fields, the correction
coefficients increases from large to small fields.
During GLAaS application to a generic field, a linear fit, as
a function of the jaw aperture toward +y, is computed in
order to select from the library the appropriate correction
coefficients (slope of the bending) to be applied, pixel by
pixel, at the primary radiation component of the formal-
ism.
As for the previous method, this solution represents a
pragmatic approach to solve a known and complex issue.
Deep modeling of the arm back-scatter is in principle pos-
sible via, e.g., Monte Carlo simulations but this would
require a detailed knowledge of the arm structures and a
huge investment in terms of configuration.
c) Dose Rate independence
To explore the application of GLAaS to verification of
dynamic wedges, it was necessary to validate the calibra-
tion procedure for all dose rates available on a linac (in
our case: 100, 200, 300, 400, 500 and 600 MU/min) and
to assess its desirable operational independence from it.
The latter is fundamental for two reasons: i) it allows in
commissioning phase, to configure GLAaS for only one
dose rate only and ii) to use it during irradiations per-
formed with variable dose rate as the dynamic wedges.
The second objective could be reached also in the case of
strong detector sensitivity from dose rate by using libraries
of calibrations and appropriate interpolations but it
would be obviously quite complex from the logic and
practical point of view.
In addition, different read-out electronics (IAS2 and IAS3)
are associated to the detectors and among various differ-
ences, one is potentially relevant at this stage. The ampli-
tude of the readable signal (over the number of frames
between different detector cleanings) is limited to 14 bits
in IAS2 while it is virtually not limited for IAS3. This lim-
itation has a potential direct impact on the maximum
dose rate usable on IAS2 to avoid saturation, or on the
contrary, on the operational conditions (namely the
SDD) to be used with higher dose rates to avoid satura-
tion. IAS3 is not affected by potential limitations in dose
rate. For both systems (aS500/IAS2 and aS1000/IAS3)
complete sets of calibrations were acquired for all availa-
ble dose rates and GLAaS parameters have been recorded
and compared.
Because of the limited read-out buffer mentioned above,
for the IAS2 case, the experiments were carried out setting
SDD at 140 cm, a distance sufficient to reduce with
inverse square low, the signal impinging on the detector
and allowing testing the operation under the nominal
dose rates delivered from the linac. It has to be mentioned
that the IAS2 electronic is, from the Varian point of view,
an end-of-life product and, for future applications, only
IAS3 electronics should be considered.
To test the practical independence from the dose rate used
to calibrate GLAaS and the dose rate used to deliver a test
field, various IMRT fields were acquired with different
dose rates, and analysed with different GLAaS calibrations
(performing all the permutations) and results will be
summarised here. It is obvious that this validation has a
fundamental implication on a longer perspective since
GLAaS independence from dose rate would allow its
application to any type of beam delivery with variable
dose rate, particularly in the area of advanced intensity
modulation (arc) therapies.
d) High dose per field
A complementary aspect of the enhancement process of
GLAaS was the assessment of its usability for relatively
high dose per field. In the IMRT framework, GLAaS was
operated in a regime roughly ranging from 0 to 2 Gy per
field (normally 0 to <1 Gy) while in principle, for generic
quality assurance purposes, it could be necessary to
expose the detectors to higher dose levels. To test this fac-
tor in a simple but comprehensive way (i.e. exploring a
large dose variation within a single image acquisition), a
set of IMRT fields were delivered and verified via GLAaS
assigning different dose levels, ranging from 0.2 to 5 Gy to
the maximum field dose. In principle, the possibility to
use PV and GLAaS for any dose (even higher than 5 Gy)
should be guaranteed by the fact that read-out electronics
operates by averaging the signal of each pixel over a given
number of frames (while the detector is reset without
loosing any acquisition frame), and recording the corre-
sponding readings together with the total number frames.
With this operation mode, the detector channels do not
saturate with increasing dose.
2.2 Exploring GLAaS for Machine Quality Assurance
The second part of the study was devoted to validate the
usage of GLAaS for simple linac quality assurance radia-
tion tests.
An intrinsic advantage of GLAaS is that it allows perform-
ing dosimetric analysis on truly 2D data with a spatial res-
olution of either ~0.4 mm (PV-aS1000) or ~0.7 mm (PV-
aS500). On the contrary standard dosimetric tests for
linac QA processes are based on measurements either
"zero" dimensional (points) or mono-dimensional
(series of points in a line like with array detectors) or,
when bi-dimensional data are available as when using 2D
matrix detectors, the spatial resolution is very coarse
(from 5 to 10 mm in average) and/or the points in the
Radiation Oncology 2008, 3:14 />Page 6 of 20
(page number not for citation purposes)
matrices are arranged in pre-defined simple geometries as
in the detectors used to perform star measurements or to
analyse beam profiles in the main axis in few points. The
intrinsic bi-dimensionality of GLAaS allows therefore
investigating also evaluation methods based on several
criteria, standard parameters or, e.g. the gamma analysis.
In addition, it is possible to use, as reference for constancy
checks any type of point measurements (if data like out-
put factors or wedge factors are of interest) but also to use
2D measurements from other detectors or 2D calculations
from treatment planning systems. In other words, GLAaS
is compatible with a large variety of reference data to per-
form quality assurance tests. In the present work, given
our previous experience in comparing GLAaS based meas-
urements against treatment planning calculations, the
standard reference was chosen to be the TPS but, when-
ever possible, results were benchmarked against measure-
ments with ion chamber as described above.
a) Open fields
A set of 16 open fields, square and rectangular, has been
selected, sizing from 3 × 3 to 30 × 30 cm
2
. Several param-
eters were recorded; in the present paper the following are
reported:
i. Single point dose on the central axis (CAX): Output Fac-
tors (ratio between the readings of the test field and the 10
× 10 cm
2
field), and dose in Gy were compared between
PV-GLAaS measurements, ion chamber measurements,
and Eclipse calculations. GLAaS and Eclipse values were
computed as the average over a square ROI ranging from
5 × 5 pixels for fields smaller than 3 × 3 cm
2
to 65 × 65 pix-
els (about 5 × 5 mm) for fields larger than 8 × 8 cm
2
cen-
tered on the CAX.
ii. Profiles on the main axes: penumbrae (distance
between the 20% and the 80% dose level), minimum,
maximum and average dose in the flattened region,
defined as the central 80% of the field size were com-
puted. A twofold comparison was conducted: PV-GLAaS
against Eclipse calculations or against ion chamber meas-
urements wherever available. The following summary
results were reported:
- the percentage difference between the minimum dose
from GLAaS and the minimum dose from Reference
(Eclipse or ion chamber) in all points of the flattened
region: R
min
= 100*(D
min
GLAaS
-D
min
Reference
)/D
min
GLAaS
,
where D
min
is the minimum dose value the flattened
region.
- the percentage difference between the maximum dose
from GLAaS and the maximum dose from Reference in all
points of the flattened region: R
max
= 100*(D
max
GLAaS
-
D
max
Reference
)/D
max
GLAaS
, where D
max
is the maximum dose
value in the flattened region.
- the percentage difference between the average dose from
GLAaS and the average dose from Reference in all points
of the flattened region: R
ave
= 100*(D
ave
GLAaS
-D
ave
Reference
)/
D
ave
GLAaS
, where D
ave
is the average dose value in the flat-
tened region.
- the minimum value of the percentage difference, point
by point, between GLAaS and Reference computed dose
in the flattened region: min(100*(D
GLAaS
-D
Reference
)/
D
GLAaS
). For this (and the following two) parameters only
Eclipse was used as reference.
- the maximum value of the percentage difference, point
by point, between GLAaS and Reference computed dose
in the flattened region: max(100*(D
GLAaS
-D
Reference
)/
D
GLAaS
).
- the average value of the percentage difference, point by
point, between GLAaS and Reference computed dose in
the flattened region: ave(100*(D
GLAaS
-D
Reference
)/D
GLAaS
).
R
min
, R
max
, R
ave
and all remaining results are reported as
averages over all beams, both directions, all field sizes.
In addition, standard parameters used in routine QA anal-
ysis were computed and reported: the flatness, defined as
[(D
max
-D
min
)/(D
max
+D
min
)] in percentage (IEC 60976),
and the symmetry, defined as Maximum Dose Ratio in
percentage: max [D(x)/D(-x)] (IEC 60976).
iii. 2-dimensional images (only for GLAaS and Eclipse
doses): exploiting at maximum the potentialities of
GLAaS, the Gamma Agreement Index (GAI), defined as
the percentage of points inside the field size passing the
gamma evaluation criteria [13] of DTA = 3 mm and ΔD =
2, 2.5, 3, and 3.5% was computed. The relatively large
DTA threshold used for open fields permits to overcome
possible criticalities in the penumbra region due to the
different spatial resolutions (~0.4 or ~0.7 mm for the PV
data, >1 mm for Eclipse). This gamma analysis is quite
interesting and rather uncommon in normal QA practice
and can generate new standards in the evaluation of peri-
odic dosimetric controls.
To complement the overview of GLAaS performances on
open fields that could be part of standard radiation tests,
a set of 14 open asymmetric fields was acquired. These
were defined as half or quarter beams with different field
sizes (starting from the whole open 20 × 20 and 10 × 10
cm
2
). For those cases only output factors and profiles are
recorded.
Radiation Oncology 2008, 3:14 />Page 7 of 20
(page number not for citation purposes)
b) Enhanced Dynamic Wedges (EDW)
All EDW wedges (10, 15, 20, 25, 30, 45, and 60 degrees),
IN and OUT directions (in the Varian systems, EDW are
operated by the upper Y jaws and are defined IN or OUT
if the Y1 or Y2 jaw is respectively moved during irradia-
tion), for a 20 × 20 cm
2
field were acquired and compared
with the corresponding Eclipse computations and LA48
measurements. Results are presented for Dose/MU, pro-
files (reporting minimum, maximum and average differ-
ences between computed and measured profiles) and 2D
GAI (DTA = 3 mm, ΔD = 3%).
c) Mechanical wedge fields
All mechanical wedges (15, 30, 45, and 60 degree wedge),
for a 10 × 10 cm
2
field were analysed in terms of Transmis-
sion Factors, wedge angles, profiles and 2D GAI (DTA = 3
mm, ΔD = 3%).
3. Results
3.1 Enhancing GLAaS
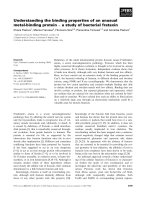
a) The flattening filter correction and the PV arm backscattering
The application of the flattening filter and PV arm back-
scattering were tested for several field sizes. Examples are
shown in figure 1 where the Gamma evaluation matrices
(determined with DTA = 3 mm and ΔD = 3%) are pre-
sented for an open 15 × 15 cm
2
field without any correc-
tion, with flattening filter and with arm backscattering (R-
arm in this example). The profiles shown in the figure for
three different field sizes are normalized to 100% at the
CAX in both x and y directions and show data from Eclipse
calculations, PV-GLAaS measurements without or with
the various corrections. Concerning arm backscattering,
the effect is qualitatively the same for the R or the Exact-
arms therefore only data for R-arm are shown for simplic-
ity but results are equivalent in the other case.
From the profiles shown, it is easy to appraise the progres-
sive improvement from the starting GLAaS data (flat pro-
files) to the presence of the expected 'hole' in the middle
and 'horns' towards the edges to finally the compensation
for the profile asymmetry in y. This pattern is not present
in the GLAaS when not corrected for flattening filter, and
it is on the contrary present in the corresponding not cor-
rected gamma evaluation matrix, while the field inhomo-
geneity is better modeled when the flattening filter
correction is accounted for (disappearing the 'horns' and
'hole' from the gamma evaluation matrix).
The difference between GLAaS and Eclipse dose for the
corrected and uncorrected profiles at the level of the 80%
of the field size (the edge of the flattened region) are
reported in table 1, averaged over all open fields larger
than 5 × 5 cm
2
analysed in the present study.
To retrospectively assess the impact of using this set of cor-
rections, a representative set of IMRT pre-treatment verifi-
cation analysed with the native GLAaS implementation,
were reprocessed with the new enhanced release. With the
inclusion of the flattening filter correction, the mean
Gamma value of IMRT fields decreased of <10% from an
average of 0.27 to 0.25 over the last 100 fields verified for
clinical treatments while the Gamma Agreement Index
improved only of few tenth of percentage. Similarly, the
addition of the arm backscattering correction affected
only in a minimal extent (mostly not visible) the IMRT
pre-treatment results. These findings confirmed the origi-
nal assumptions made in [11,12] that in IMRT, the com-
plex pattern of delivery and the relevance of radiation
transmitted below the MLC, masks strongly these features
that are, on the contrary, important to be properly man-
aged for open fields.
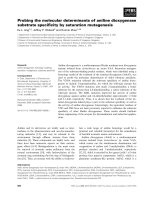
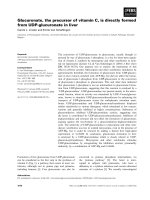
c) Dose Rate independence
The GLAaS configuration parameters derived from fit pro-
cedures according to the formalism shortly described in
appendix, are summarized in table 2 for the two systems
investigated. Data are reported as averages and standard
deviations of the average of the calibrations parameters
obtained from acquisitions at 100, 200, 300, 400, 500,
and 600 MU/min. All fit parameters of the GLAaS formal-
ism resulted equivalent within the measurement errors
whichever the dose rate. This is a confirmation of the
independence from dose rate of the detector response on
one side and of the robustness of the GLAaS procedure
that preserves this fundamental feature of aSi systems.
Validation tests were performed as described in the meth-
ods with several IMRT fields acquired with all dose rates
and analysed mixing the conditions according to all per-
mutations. In general, no difference was observed in the
results (GAI, mean gamma and standard deviation) in all
conditions confirming the possibility to perform only one
GLAaS calibration and to use GLAaS with any dose rate.
Figures 2 (aS500/IAS2) and 3 (aS1000/IAS3) present one
example of IMRT field acquired with a given dose rate and
reanalyzed with GLAaS parameters from all different dose
rates; as mentioned, it is impossible to discriminate
between the different gamma matrices and to identify the
one from the proper matching of dose rates in acquisition
and reprocessing. Figures 2 and 3 show also the results of
the configuration process in terms of plots of experimen-
tal data and fit curves for output factors vs. effective win-
dow width and for angular coefficients vs. output factor
according to the GLAaS formalism. These figures better
substantiate the independence of the GLAaS formalism
from the adopted dose rate.
Radiation Oncology 2008, 3:14 />Page 8 of 20
(page number not for citation purposes)
Flattening filter and arm-backscattering correctionFigure 1
Flattening filter and arm-backscattering correction. Example for an open 15 × 15 cm
2
field of Gamma Evaluation matrices (DTA
= 3 mm, ΔD = 3%) a) without corrections, b) with flattening filter correction, c) with both flattening filter and arm backscatter-
ing correction, d) profiles in x and y directions for 10 × 10, 15 × 15 and 20 × 20 cm
2
fields from Eclipse calculations, PV-GLAaS
without, with flattening filter, and with flattening filter + arm backscattering corrections included. Data are shown at d
max
for a
beam energy of 6 MV.
(d)
(a) (b) (c)
10x10 cm
2
10x10 cm
2
15x15 cm
2
15x15 cm
2
20x20 cm
2
20x20 cm
2
Radiation Oncology 2008, 3:14 />Page 9 of 20
(page number not for citation purposes)
d) High dose per field
The Gamma Agreement Index was computed for the set of
several IMRT beams delivered with different dose per
field. The independence of GLAaS from dose per field was
verified through the assessment of the Gamma Agreement
Index between each delivery and the corresponding calcu-
lation. The standard deviation of GAI over all tested cases
resulted < 0.3% for an average GAI >99%. Mean and
Standard deviation of GAI in normal clinical practice is
99.3 ± 0.9 [12]. This means that the observed variation
due to different dose levels (from 0.2 to 5 Gy) is signifi-
cantly smaller (one third) of the normal observed uncer-
tainty and, therefore, GLAaS performances can be
considered independent from this factor in a wide range
of clinical doses. Prospectively, as for the dose rate study,
this could also have relevant implications in the case of
advanced IMRT techniques.
3.2 GLAaS for Machine QA
a) Open fields
Results on Output Factor and Dose/MU on the CAX are
reported in table 3 as percentage difference between
GLAaS and Eclipse, GLAaS and ion chamber, and, to
benchmark findings, between Eclipse and ion chamber.
Mean differences are limited within ± 1%. In particular,
the smallest deviations are found in the comparison
between GLAaS and ion chamber measurements, with a
maximum variation of 1.1% over the whole set of meas-
ured fields, confirming the quality and robustness of
GLAaS based dosimetry.
Profiles were differently analysed in the flattened region
and at field edge. In this second case, the mean difference
between the field penumbrae measured with GLAaS and
computed by Eclipse for all open fields was investigated.
A small overestimation of the penumbrae computed by
Eclipse relatively to GLAaS measurements in the y direc-
tion was recorded (0.3 ± 0.4 mm, range [-0.2, +1.3] mm).
The difference increased in the x direction: 1.4 ± 0.3 mm,
[+1.0, +2.2]. This result was expected for two reasons. In
Eclipse only profile data in one direction are used to con-
figure the system (x profiles that are along the motion
direction of the lower jaws in the gantry head) and the
data used to commission Eclipse were measured with a
resolution of 2.5 mm rather coarse if compared to the PV
resolution of 0.784 mm (aS500) or 0.392 mm (aS1000).
As a consequence, penumbrae from Eclipse are expected
to be larger in x direction because of resolution while,
concerning y, wider penumbrae are expected in GLAaS
because this is the direction of motion of upper jaws, not
perfectly modeled in Eclipse (here penumbrae in the two
main directions are identical). In effect, penumbrae meas-
ured with GLAaS were about 1 mm wider in y compared
to x.
Results of the differences between profiles in the flattened
region are reported in table 4 for all fields larger than 5 ×
5 cm
2
. In table 5, some of the standard parameters com-
monly used for profile analysis have been reported for
GLAaS processed measured images, Eclipse calculations,
and ion chamber measurements, for some field sizes, x
and y directions.
The high quality of the agreement between Eclipse calcu-
lations and GLAaS measurements, can be appraised also
in figure 4 where the gamma index maps for some field
Table 1: Impact of flattening filter and arm backscatter corrections: percentage difference between PV-GLAaS measurements and
Eclipse calculations relative doses at the 80% of the field size, for square and rectangular fields larger than 5 × 5 cm
2
; values are the
average ± SD, and range; data for 6MV beam at d
max
.
No correction [%] Flattening filter correction [%] Flatt.Filter + arm Backscatt. correction [%]
-x dir. -1.9 ± 1.3 [-3.3, -0.1] -0.2 ± 0.4 [-0.8, +0.3] -0.2 ± 0.4 [-0.9, +0.3]
+x dir. -1.9 ± 1.4 [-3.5, +0.1] -0.2 ± 0.3 [-0.8, +0.1] -0.2 ± 0.3 [-0.8, +0.0]
-y dir. -1.7 ± 0.7 [-3.2, -0.5] +0.6 ± 0.7 [-0.6, +1.8] +0.5 ± 0.7 [-0.6, +1.7]
+y dir. -4.2 ± 1.6 [-5.3, -0.3] -1.8 ± 0.7 [-2.4, -0.3] -0.2 ± 0.8 [-1.4, +1.2]
Table 2: GLAaS configuration parameters: average (± SD) values over all dose rates from 100 to 600 MU/Gy
Parameter aS500/IAS2 Mean ± %SD aS1000/IAS3 Mean ± %SD
c (eq. 2 Appendix 1) 1.197 ± 0.3% 1.255 ± 0.2%
d (eq. 2 Appendix 1) -8.755 10
-2
± 1.6% -1.121 10
-1
± 1.1%
a (eq. 3 Appendix 1) -3.179 10
-6
± 1.9 % -4.29 10
-6
± 1.6 %
b (eq. 3 Appendix 1) 1.456 10
-5
± 1.6% 1.993 10
-5
± 1.2%
Radiation Oncology 2008, 3:14 />Page 10 of 20
(page number not for citation purposes)
Summary of Dose Rate independence study for the IAS2 read-out electronics (associated to the PV-aS500 detector)Figure 2
Summary of Dose Rate independence study for the IAS2 read-out electronics (associated to the PV-aS500 detector). Example
of Gamma Evaluation matrices (DTA = 3 mm, ΔD = 3%) for a field measured with beam delivery operated at dose rates from
100 to 600 MU/min while dose calculation was performed at 300 MU/min. Plots of the calibration data acquired at different
dose rates and corresponding fits.
100 MU/min200 MU/min300 MU/min
400 MU/min500 MU/min600 MU/min
aS500/IAS2
600 MU/min 300 MU/min 100 MU/min
1.1
1.0
0.9
OF
1.1
1.0
0.9
OF
1.1
1.0
0.9
OF
1.00
m
pr
[Gy 10
-5
]
1.10
1.05
1.05
1.10
1.00
m
pr
[Gy 10
-5
]
1.10
1.05
1.05
1.10
1.05
m
pr
[Gy 10
-5
]
1.25
1.20
1.10
1.15
1.11.00.9
OF
1.11.00.9
OF
1.11.00.9
OF
20100
EwwF [cm]
30
20100
EwwF [cm]
30
20100
EwwF [cm]
30
Radiation Oncology 2008, 3:14 />Page 11 of 20
(page number not for citation purposes)
Summary of Dose Rate independence study for the IAS3 read-out electronics (associated to the PV-aS1000 detector)Figure 3
Summary of Dose Rate independence study for the IAS3 read-out electronics (associated to the PV-aS1000 detector). Example
of Gamma Evaluation matrices (DTA = 3 mm, ΔD = 3%) for a field measured with beam delivery operated at dose rates from
100 to 600 MU/min while dose calculation was performed at 300 MU/min. Plots of the calibration data acquired at different
dose rates and corresponding fits.
aS1000/IAS3
100 MU/min200 MU/min300 MU/min
400 MU/min500 MU/min600 MU/min
600 MU/min 300 MU/min 100 MU/min
1.1
1.0
0.9
OF
0.8
1.2
1.1
1.0
0.9
OF
0.8
1.2
1.1
1.0
0.9
OF
0.8
1.2
m
pr
[Gy 10
-5
]
1.7
1.6
1.5
1.4
m
pr
[Gy 10
-5
]
1.7
1.6
1.5
1.4
m
pr
[Gy 10
-5
]
1.6
1.5
1.4
20100
EwwF [cm]
30 20100
EwwF [cm]
30 20100
EwwF [cm]
30
1.11.00.9
OF
0.8 1.2 1.11.00.9
OF
0.8 1.2 1.11.00.9
OF
0.8 1.2
Radiation Oncology 2008, 3:14 />Page 12 of 20
(page number not for citation purposes)
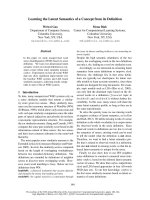
are shown as well as profiles in x and y for two square and
two asymmetric fields. In the plots, Eclipse, GLAaS and
ion chamber data are compared.
From the Gamma analysis of all fields, the average
Gamma Agreement Index (DTA = 3 mm) computed over
the whole field area for all square and asymmetric fields,
resulted: 92.7 ± 6.0 %, 97.3 ± 1.3 %, 98.4 ± 0.9 %, and
99.2 ± 0.4 % for ΔD = 2, 2.5, 3, 3.5% respectively.
b) Enhanced Dynamic Wedges (EDW)
In table 6 Dose/MU on the CAX are reported as percentage
difference between GLAaS and Eclipse, GLAaS and ion
chamber measurements, and, as benchmark, between
Eclipse and ion chamber. The best agreement was
observed between GLAaS and ion chamber (maximum
deviation smaller than 1.5%), while larger differences
were found between GLAaS and Eclipse or between
Eclipse and ion chamber. This, again, substantiates the
role of GLAaS as a dosimeter equivalent to conventional
ion chambers.
Table 7 summarises results of the differences between
Eclipse and GLAaS profiles in the flattened region for all
EDW fields. In the first part of the table results from all the
wedge angles are reported while in the second part the 60
degree EDW was removed. The difference between the
results of the two parts shows, as usual, that the 60 degree
EDW presents the least accuracy in dose computation. The
agreement between Eclipse and GLAaS, in average it is
within 1.3% (1.7% if also EDW 60 is accounted for). Fig-
ure 5 shows GLAaS dose matrices and 2D gamma maps
for 15, 30, 45 and 60 degrees EDW fields with also corre-
sponding profiles in the wedge direction for GLAaS meas-
urements, Eclipse calculations and for ion chamber
measures (with LA48).
As for the case of simple open fields, the good agreement
of results is confirmed by the average Gamma Agreement
Index computed over the whole field area between GLAaS
and Eclipse dose matrices: 97.5 ± 1.1% (minimum value
95.4%) for DTA = 3 mm and ΔD = 3%.
c) Mechanical wedge fields
In table 8 the Transmission Factors (on the CAX for a 10
× 10 cm
2
field) are reported as percentage difference
between GLAaS and Eclipse, GLAaS and ion chamber
measurements, and, as benchmark, between Eclipse and
ion chamber. The agreement between GLAaS and ion
chamber is within 1.1%, better than with respect to
Eclipse as in for the case of EDW.
Profile slopes are reported in table 9. Slopes were defined
as 2*Artg(ΔDose/ΔDist), with ΔDose and ΔDist evaluated
at the points located at half distance on the right and left
sides respect to the field center. Results of the differences
between Eclipse and GLAaS measured profiles in the flat-
tened region are reported in table 10 for all analysed fields
(all wedges, 10 × 10 and 20 × 20 cm
2
fields).
Also in this case, figure 6 shows some examples of GLAaS
dose matrices, 2D gamma maps and profiles for GLAaS,
Table 3: Open fields: average (± SD) percentage difference between GLAaS and Reference (Eclipse or ion chamber) of output factors
and Dose/MU over 16 analysed square and rectangular fields, and 14 asymmetric fields.
GLAaS vs. Eclipse [%] GLAaS vs. IonCh. [%] Eclipse vs. IonCh. [%]
Square and rectangular fields
Output factor: -0.4 ± 0.7 [-1.3, +1.3] -0.5 ± 0.4 [-1.1, 0.0] -0.2 ± 0.4 [-1.3, +0.4]
Dose/MU: 0.8 ± 0.6 [-0.1, +2.3] 0.6 ± 0.3 [0.0, +1.1] -0.2 ± 0.4 [-1.4, +0.3]
Asymmetric fields
Output factor: -0.8 ± 0.7 [-2.3, 0.0] - -
Dose/MU: -0.3 ± 0.7 [-1.7, +0.6] - -
Table 4: Open fields: minimum, maximum and average (± SD) percentage difference between GLAaS and Reference (Eclipse or ion
chamber) for fields larger than 5 × 5 cm
2
, in the flattened region.
GLAaS vs. Eclipse Mean ± SD [Range] [%] GLAaS vs. IonCh. Mean ± SD [Range] [%]
R
min
= 100*(D
min
GLAaS
-D
min
Ref
)/D
min
GLAaS
0.1 ± 1.0 [-0.7, +3.9] 1.0 ± 1.4 [+0.1, +2.6]
R
max
= 100*(D
max
GLAaS
-D
max
Ref
)/D
max
GLAaS
0.7 ± 0.8 [-0.3, +2.4] -0.3 ± 0.2 [-0.4, 0.0]
R
ave
= 100*(D
ave
GLAaS
-D
ave
Ref
)/D
ave
GLAaS
0.1 ± 0.4 [-0.5, +0.6] -0.1 ± 0.2 [-0.3, +0.1]
min(100*(D
GLAaS
-D
Ref
)/D
GLAaS
) 1.1 ± 1.0 [0.0, 3.9] -
max(100*(D
GLAaS
-D
Ref
)/D
GLAaS
) -0.6 ± 0.5 [-1.5, 0.0] -
ave(100*(D
GLAaS
-D
Ref
)/D
GLAaS
) 0.1 ± 0.4 [-0.5, 0.6] -
Radiation Oncology 2008, 3:14 />Page 13 of 20
(page number not for citation purposes)
Eclipse and ion chamber data. The average Gamma Agree-
ment Index computed over the whole field area between
GLAaS and Eclipse dose matrices was: 98.7 ± 0.6% (mini-
mum value 97.8%) for DTA = 3 mm and ΔD = 3%.
4. Discussion and Conclusion
The present report addressed some improvements intro-
duced into the formalism of the GLAaS algorithm used to
calibrate amorphous silicon based electronic portal imag-
ers to convert raw images from into dose matrices at the
depth of maximum dose. This enhanced version of GLAaS
was motivated by the intention to apply GLAaS dosimetry
to standard procedures of Quality Assurance of linac
beams. In particular, GLAaS could be adopted to perform
simple periodic stability control as determination of out-
put and wedge factors or to monitor beam profile charac-
teristics. In addition, from 2D dose matrices with high
spatial resolution, it is possible to use GLAaS also to com-
pute gamma index maps over the entire field areas, in the
penumbra region and outside beams introducing new
methods in routine quality assurance processes. A third
point of interest is that GLAaS can be used using as refer-
ence data any type of measurement (including GLAaS
itself) but can be operated also using as references calcula-
tions from planning systems. This could open also the
possibility to perform extensive quality control to plan-
ning systems themselves or to verify linac stability over
time against the data used to prepare treatments of
patients.
The improvements introduced in this study were required
to properly account for the 'holes' and 'horns' typical
shape of radiation fields generated by the flattening filter
and to compensate for the extra contribution to signals
originated by backscattered radiation from the imager
support arm. These are known issues in portal dosimetry,
addressed also by other authors and the solution pro-
posed in our study is, as GLAaS, empirical and pragmatic.
Simple correction matrices (or coefficients), easily deter-
mined at the time of configuration for any type of detector
or read-out electronic and beam quality.
To solve the backscattering problem also alternative solu-
tions were proposed as result of the deep investigations of
the Richmond group [9] that in 2005 [10] suggested, from
Monte Carlo calculations, to add a lead layer to absorb the
scattered radiation. More advanced modeling of the men-
tioned effects is possible but the quality of the results
shown in this report allows confidence in the robustness
of the simple method proposed.
Table 5: Open fields: summary of main parameters from profile analysis; data are shown for three exemplifying field sizes.
Field/axis D
min
* [%] D
max
* [%] D
ave
* [%] Flatness [%] Symmetry [%]
5 × 5, y Ion chamber 93.6 100.0 98.8 3.3 100.4
Eclipse 93.9 100.1 99.6 3.2 100.0
GLAaS 96.2 100.8 100.1 2.3 100.1
10 × 10, y Ion chamber 98.8 100.8 100.2 1.0 100.5
Eclipse 100.0 100.9 100.4 0.4 100.0
GLAaS 100.0 101.5 100.8 0.8 100.0
20 × 20, y Ion chamber 99.9 102.7 101.7 1.4 100.6
Eclipse 100.0 102.2 101.4 1.1 100.1
GLAaS 99.9 103.4 101.6 1.7 101.2
5 × 5, x Ion chamber 94.7 100.3 99.0 2.9 100.4
Eclipse 93.9 100.1 99.6 3.2 100.0
GLAaS 97.7 100.1 99.4 1.2 100.0
10 × 10, x Ion chamber 99.2 101.0 100.3 0.9 100.6
Eclipse 100.0 100.9 100.4 0.4 100.1
GLAaS 99.3 100.6 100.1 0.7 100.0
20 × 20, x Ion chamber 99.7 102.6 101.4 1.4 100.4
Eclipse 100.0 102.2 101.4 1.1 100.1
GLAaS 99.7 102.5 101.3 1.4 100.2
* within flattened region
Table 6: EDW: average (± SD) percentage difference of Dose/MU between GLAaS and Reference (Eclipse or ion chamber), and range
over 14 analysed EDW fields.
GLAaS vs Eclipse [%] GLAaS vs IonCh. [%] Eclipse vs IonCh. [%]
Dose/MU: -1.1 ± 1.6 [-4.8, +1.2] 0.4 ± 0.7 [-0.9, +1.4] 1.6 ± 1.3 [+0.1, +4.2]
Radiation Oncology 2008, 3:14 />Page 14 of 20
(page number not for citation purposes)
Examples of various verification (Gamma Evaluation matrices (DTA = 3 mm, ΔD = 3%) and profiles) for open square, rectangu-lar and asymmetric fieldsFigure 4
Examples of various verification (Gamma Evaluation matrices (DTA = 3 mm, ΔD = 3%) and profiles) for open square, rectangu-
lar and asymmetric fields. Profiles are shown in the x and y directions: first row: 10 × 10 and 20 × 20 cm
2
fields; second row:
asymmetric (half beam) fields of 10 × 20 and 20 × 10 cm
2
. Data are reported for Eclipse calculations (blue dashed), GLAaS (red
line), and ion chamber (black dots). Depth of measure or calculation was d
max
for a beam energy of 6MV.
15x15 cm
2
10x10 cm
2
5x5 cm
2
20x3 cm
2
10x4 cm
2
10x2 cm
2
(0,10)x(0,10) cm
2
(5,0)x10 cm
2
10x(5,0) cm
2
Radiation Oncology 2008, 3:14 />Page 15 of 20
(page number not for citation purposes)
Without the flattening filter and arm backscattering cor-
rections, GLAaS was and is reliably usable for IMRT pre-
treatment verification as shown by results in [11,12] but
for wider application like generic quality assurance of
linac beams (or planning systems) these were considered
to be mandatory. This derives from the fact that both cor-
rections are quantitatively relevant on the primary radia-
tion component of the dosimetric signal and for open (or
wedged) fields this is the completely dominant fraction.
The case of IMRT is different because in this modality,
radiation transmitted through the MLC cannot be ignored
and play a significant role in the field modulation.
As mentioned repeatedly and systematically done in the
study, given its bi-dimensional nature, it is obvious its
compare GLAaS dosimetric data against dose calculations
from the treatment planning systems; in our case the Var-
ian Eclipse. It shall be nevertheless mentioned that this
approach is reliable and safe only when computation is
performed with sufficiently accurate algorithms. For the
present study, the Anisotropic Analytical Algorithm AAA
for photon dose calculation was applied, an algorithm
deeply tested and presenting good agreement with ion
chamber measurements in water for different settings
[14]. Still, as shown by the present data, GLAaS allowed
detecting some known features of the Eclipse-AAA system
in terms of MU calculations and or penumbra evaluation
proving its robustness and high reliability as an investiga-
tional tool. Its bi-dimensionality and the concomitant
application of gamma index analysis suggests also that
GLAaS dosimetry could be in this respect more informa-
tive than simple ion-chamber based investigations
because it would allow the exploration of positive or neg-
ative beam features over the entire field area (and out-
side). In this respect GLAaS dosimetry is also superior to
other 2D methods based on different commercial devices
that are normally characterized by poor spatial resolution
(ranging from 5 to 10 mm in general) and limited number
of detection points (small areas or only privileged direc-
tions can be measured with decent spatial resolutions). In
addition, time and easiness of execution is also an impor-
tant factor. For example films have a long procedure of
developing, scanning, conversion into dose through cali-
bration curves depending on many factors (developer,
energy, ) while linear arrays or 2D detectors are some-
times difficult to mount, and expensive.
Of final interest, there is also the observation that, when
directly compared, GLAaS results and ion-chamber meas-
urements showed the best agreement than the other com-
binations as a definitive prove of GLAaS proper
implementation and value and the legitimacy to use
GLAaS for routine tests, even in the framework of manda-
tory and legally binding procedures. GLAaS gives the pos-
sibility to check not only relative dose distributions, but
also absolute dose values for any type of field, contrarily
Table 7: EDW: minimum, maximum and average (± SD) percentage difference between GLAaS and Reference (Eclipse or ion
chamber) in the flattened region.
GLAas vs Eclipse Mean ± SD [Range] [%] GLAaS vs IonCh. Mean ± SD [Range] [%]
Angles 10 to 60 degree
R
min
= 100*(D
min
GLAaS
-D
min
Ref
)/D
min
GLAaS
0.4 ± 1.6 [-2.0, +4.4] -2.2 ± 2.3 [-5.5, -0.3]
R
max
= 100*(D
max
GLAaS
-D
max
Ref
)/D
max
GLAaS
-1.5 ± 1.3 [-4.7, +0.5] 2.3 ± 1.2 [+1.0, +3.9]
R
ave
= 100*(D
ave
GLAaS
-D
ave
Ref
)/D
ave
GLAaS
-0.1 ± 0.3 [-0.9, +0.1] 0.8 ± 0.3 [+0.5, +1.1]
min(100*(D
GLAaS
-D
Ref
)/D
GLAaS
) 1.2 ± 1.2 [+0.5, +4.4] -
max(100*(D
GLAaS
-D
Ref
)/D
GLAaS
) -1.7 ± 1.1 [-4.7, -0.5] -
ave(100*(D
GLAaS
-D
Ref
)/D
GLAaS
) 0.1 ± 0.2 [-0.2, +0.6] -
Angles 10 to 45 degree
R
min
= 100*(D
min
GLAaS
-D
min
Ref
)/D
min
GLAaS
-0.2 ± 0.7 [-2.0, +0.9] -1.1 ± 0.8 [-2.0, -0.3]
R
max
= 100*(D
max
GLAaS
-D
max
Ref
)/D
max
GLAaS
-1.1 ± 0.9 [-3.2, +0.5] 1.8 ± 0.7 [+1.0, +2.5]
R
ave
= 100*(D
ave
GLAaS
-D
ave
Ref
)/D
ave
GLAaS
0.0 ± 0.2 [-0.4, +0.1] 0.6 ± 0.2 [+0.5, +0.8]
min(100*(D
GLAaS
-D
Ref
)/D
GLAaS
) 0.8 ± 0.3 [+0.5, +1.4] -
max(100*(D
GLAaS
-D
Ref
)/D
GLAaS
) -1.3 ± 0.8 [-3.2, -0.5] -
ave(100*(D
GLAaS
-D
Ref
)/D
GLAaS
) 0.0 ± 0.1 [-0.2, +0.2] -
Table 8: Mechanical wedges: average (± SD) percentage difference of Transmission Factors between GLAaS and Reference (Eclipse or
ion chamber) over the 4 wedge insert directions.
GLAaS vs Eclipse [%] GLAaS vs IonCh. [%] Eclipse vs IonCh. [%]
W1 - 15° -1.3 ± 0.2 -1.1 ± 0.1 0.2 ± 0.1
W2 - 30° -1.6 ± 0.1 0.2 ± 0.1 1.7 ± 0.1
W3 - 45° -1.6 ± 0.1 -0.8 ± 0.1 0.8 ± 0.0
W4 - 60° -1.3 ± 0.2 -0.8 ± 0.2 0.4 ± 0.0
Radiation Oncology 2008, 3:14 />Page 16 of 20
(page number not for citation purposes)
Examples of EDW verification showing Gamma Evaluation matrices (DTA = 3 mm, ΔD = 3%) and profiles in the y direction for 15, 30, 45, and 60° EDW ''IN" direction on a 20 × 20 cm
2
fieldFigure 5
Examples of EDW verification showing Gamma Evaluation matrices (DTA = 3 mm, ΔD = 3%) and profiles in the y direction for
15, 30, 45, and 60° EDW ''IN" direction on a 20 × 20 cm
2
field. Data are reported for Eclipse calculations (blue dashed), GLAaS
(red line), and ion chamber (black dots).
EDW15
EDW30
EDW45
EDW60
Gamma evaluation Dose Gamma evaluation Dose
Gamma evaluation Dose Gamma evaluation Dose
EDW 15 EDW 30
EDW 45 EDW 60
Radiation Oncology 2008, 3:14 />Page 17 of 20
(page number not for citation purposes)
to what suggested e.g. by Budgell et al [15], where the
EPID Quality Assurance was intended to check only the
constancy of the parameters during time, despite of the
specific value.
In summary, all the results shown, indicate that, a Quality
Assurance program can reliably incorporate GLAaS
dosimetry as an instrument for radiation tests to either
monitor beam stability or to perform planning system val-
idations (e.g. when new releases are issued). With GLAaS
parameters like output factors, dose/MU, profiles, profile
related parameters like flatness, symmetry, homogeneity
and penumbrae can be quickly and reliably measured in
good setting conditions of distance and depth (dmax is
not the only option for GLAaS), and not only as reproduc-
ibility values. In addition, not addressed here but obvious
also from previous publications, GLAaS dosimetry can be
operated at any gantry angle and therefore it is a suitable
and ideal method to solve some tricky issue of periodic
quality assurance procedures.
A dedicated interface was developed for the purpose and
is going to allow, in our institute, to perform routine activ-
ities with proper automatic calculation of all needed qual-
ity assurance parameters and immediate electronic
recording as well as a variety of graphical interactive tools
to perform users defined additional analysis.
Even if GLAaS appears to be extremely solid, it will not
replace ion chamber measurements (e.g. depth dose
measurements) but gives the possibility to enforce in crit-
ical areas, frequent beam checks being a fast and eco-
nomic approach of beam testing.
PV-GLAaS has been demonstrated to be a comprehensive
tool for QA in terms of pre-treatment IMRT verification
[11,12], as well as for QA in terms of periodic beam check
for any kind of fields: open, symmetric or asymmetric,
EDW, wedge. MLC verification was not included in the
present report and will be subject of a specific investiga-
tion to incorporate into GLAaS the possibility to analyse
all characteristics, static and dynamic of MLC beams as
well as dosimetric features of MLC systems.
Further ongoing studies, subject of future reports are
focused on one extremely actual and important issue: the
usage of GLAaS on advanced IMRT delivery methods, like
(volumetric) modulated dynamic arc therapy. These
investigations will be possible also given the proof, shown
in the present study, of GLAaS independence from varia-
ble dose rate and from variable and high dose per field.
Competing interests
The authors declare that they have no competing interests.
Dr. Luca Cozzi acts as Scientific consultant to Varian Med-
ical Systems AG
Authors' contributions
AF, GN and LC designed the study.
AF and LC wrote the manuscript
EV, AC, GN and GB performed data acquisition and
processing.
AF, GN, LC, EV and AC developed the algorithms
EV and AC wrote the computer programmes
All authors reviewed and approved the manuscript
Appendix 1
The GLAaS formalism was defined in detail in [11,12].
Here a short summary is provided with some notes to the
features specific to open and wedged field verification.
Table 9: Mechanical wedges: reconstructed profile slopes.
GLAaS [°] IonChamber [°] Eclipse [°]
W1 - 15° 15.0 14.7 14.7
W2 - 30° 30.9 31.2 29.8
W3 - 45° 45.1 44.0 44.4
W4 - 60° 75.6 73.9 74.3
Table 10: Mechanical wedges: minimum, maximum and average (± SD) percentage difference between GLAaS and Reference (Eclipse
or ion chamber) in the flattened region.
GLAaS vs Eclipse Mean ± SD [Range] [%] GLAaS vs Ion Chamber Mean ± SD [Range] [%]
R
min
= 100*(D
min
GLAaS
-D
min
Ref
)/D
min
GLAaS
-1.3 ± 0.7 [-2.0, -0.2] -0.8 ± 0.8 [-1.8, +0.3]
R
max
= 100*(D
max
GLAaS
-D
max
Ref
)/D
max
GLAaS
-0.7 ± 0.7 [-1.5, +0.5] 0.7 ± 1.1 [-0.6, +2.8]
R
ave
= 100*(D
ave
GLAaS
-D
ave
Ref
)/D
ave
GLAaS
-0.2 ± 0.2 [-0.4, +0.2] 0.2 ± 0.3 [-0.1, +0.7]
min(100*(D
GLAaS
-D
Ref
)/D
GLAaS
) 0.3 ± 0.2 [0.0, +0.6] -
max(100*(D
GLAaS
-D
Ref
)/D
GLAaS
) -1.4 ± 0.8 [-2.4, -0.3] -
ave(100*(D
GLAaS
-D
Ref
)/D
GLAaS
) -0.2 ± 0.2 [-0.5, +0.1] -
Radiation Oncology 2008, 3:14 />Page 18 of 20
(page number not for citation purposes)
Examples of mechanical wedges verification showing Gamma Evaluation matrices (DTA = 3 mm, ΔD = 3%) and profiles in the wedge direction for 15, 30, 45, and 60° wedges on a 10 × 10 cm
2
fieldFigure 6
Examples of mechanical wedges verification showing Gamma Evaluation matrices (DTA = 3 mm, ΔD = 3%) and profiles in the
wedge direction for 15, 30, 45, and 60° wedges on a 10 × 10 cm
2
field. Data are reported for Eclipse calculation (blue dashed),
GLAaS (red line), and ion chamber (black dots).
Wedge 15
Wedge 30
Wedge 45
Wedge 60
Gamma evaluation Dose Gamma evaluation Dose
Gamma evaluation Dose Gamma evaluation Dose
Wedge 15 Wedge 30
Wedge 45 Wedge 60
Radiation Oncology 2008, 3:14 />Page 19 of 20
(page number not for citation purposes)
For a given beam, the response of the amorphous silicon
detectors is linear (D(Gy)=m*R+q). However response to
primary or transmitted radiation is different and, in addi-
tion, dynamic deliveries like IMRT or EDW are changing
dosimetric and geometrical conditions continuously dur-
ing delivery. GLAaS accounts for those changes in time
and position, using different m and q values, and differen-
tiating between primary and transmitted (below the MLC
or physical wedges) radiation, on a pixel by pixel basis.
The total dose d
i
in the i-th pixel, over the entire IMRT field
delivery is:
where: m and q are the slope and the intercept for a field
of size EwwF (Equivalent window width Field), r is the
reading attributed to the primary radiation for the beam
''segment" s, and R is the total PV reading; subscripts pr
refer to primary, tr to transmitted radiation. The field is
considered as a sum of N segments. For IMRT fields the
definition of segments is straightforward (also in the case
of dynamic sliding window). For open fields there is obvi-
ously only one segment as well as for hard wedged fields.
For dynamic wedges, in principle it should be necessary to
define a sequence of segments of progressively smaller
size, following the jaws during motion. In practice it is
sufficient to use one single segment, defined by the largest
jaws opening since this contribution dominates over the
entire field delivery. In these cases equation (1) becomes,
inside the field:
While outside the field the only second term of eq. (1) is
used.
The parameter values computed during the configuration
of the GLAaS to analytically obtain the slopes come from
the following empirical algorithm:
OF(EwwF) = [c + d · ln(EwwF)]
-1
(2)
where EwwF is the equivalent field size of each segment
m
pr
(OF) = a · OF + b (3)
where m
pr
is the slope for primary radiation, and OF is the
PV measured output factor as per equation (2).
For transmitted radiation the following relationship is
used:
m
tr
= k · m
pr
(4)
The parameter k depends on the type of field to measure.
It is applied to radiation transmitted through the MLC,
k~1.08. In the case of hard wedged fields, equation (1*),
k ranges from 1.02 to 1.05 while for dynamic wedges, still
according to eq. (1*), k = 1.
GLAaS configuration consists in the determination of a set
of empirical parameters: a, b, c, d, k, q
pr
and q
tr
.
Experimental set-up: the measured PV images are
acquired without adding any build-up on the top of the
cassette. The measuring depth is considered to be 0.8 cm,
i.e. the intrinsic water-equivalent thickness of the EPID
device, but measurements are converted to dose at a depth
equal to d
max
. Measurements are then compared with
doses either measured with other detectors or computed
by the TPS at d
max
in water. In this way the configuration
relates PV acquisitions performed without adding any
build-up material on the top of the PV cassette with doses
calculated/measured at d
max
, where the definition of dose
is more reliable. This procedure is similar to that usually
applied when in-vivo dosimetry is performed with solid-
state diodes without sufficient build-up material.
References
1. Grein EE, Lee R, Luchka K: An investigation of a new amorphous
silicon portal imaging device for transit dosimetry. Med Phys
2002, 29:2262-2268.
2. Greer PB: Correction of pixel sensitivity variation and off-axis
response for amorphouse silicon EPID dosimetry. Med Phys
2005, 32:3558-3568.
3. Greer PB, Popescu CC: Dosimetric properties of an amorphous
silicon electronic portal imaging device for verification of
dynamic intensity modulated radiation therapy. Med Phys
2003, 30:1618-1627.
4. Winkler P, Hefner A, Georg D: Dose-response characteristics of
an amorphous silicon EPID. Med Phys 2005, 32:3095-3105.
5. Berger L, François P, Gaboriaud G, Rosenwald JC: Performance
optimization of the Varian aS500 EPID system. J Appl Clin Med
Phys 2006, 7:105-114.
6. Greer PB: Off-axis dose response characteristics of an amor-
phous silicon electronic portal imaging device. Med Phys 2007,
34:3815-3824.
7. Parent L, Fielding AL, Dance DR, Seco J, Evans PM: Amorphous sil-
icon EPID calibration for dosimetric applications: compari-
son of a method based on Monte Carlo prediction of
response with existing techniques. Phys Med Biol 2007,
52:3351-3368.
8. Greer PB, Vial P, Oliver L, Baldock C: Experimental investigation
of the response of an amorphous silicon EPID to intensity
modulated radiotherapy beams. Med Phys 2007, 34:4389-4398.
9. Ko L, Oh Kim J, Siebers JV: Investigation of the optimal back-
scatter for an aSi electronic portal imaging device. Phys Med
Biol 2004, 49:1723-1738.
10. Moore JA, Siebers JV: Verification of the optimal backscatter
for an aSi electronic portal imagin device. Phys Med Biol 2005,
50:2341-2350.
11. Nicolini G, Fogliata A, Vanetti E, Clivio A, Cozzi L: GLAaS: an abso-
lute dose calibration algorithm for an amorphous silicon por-
d d d m EwwF r q m R
ipritri prs isprs
s
N
tr i
=+= ⋅+
⎛
⎝
⎜
⎜
⎞
⎠
⎟
⎟
+⋅−
=
∑
,, , , ,
()
1
rrq
is
s
N
tr,
=
∑
⎛
⎝
⎜
⎜
⎞
⎠
⎟
⎟
+
⎛
⎝
⎜
⎜
⎞
⎠
⎟
⎟
1
(1)
d d k m EwwF r q
ipri prs isprs
s
N
== ⋅ ⋅+
⎛
⎝
⎜
⎜
⎞
⎠
⎟
⎟
=
∑
,,,,
()
1
(1a)
Publish with BioMed Central and every
scientist can read your work free of charge
"BioMed Central will be the most significant development for
disseminating the results of biomedical research in our lifetime."
Sir Paul Nurse, Cancer Research UK
Your research papers will be:
available free of charge to the entire biomedical community
peer reviewed and published immediately upon acceptance
cited in PubMed and archived on PubMed Central
yours — you keep the copyright
Submit your manuscript here:
/>BioMedcentral
Radiation Oncology 2008, 3:14 />Page 20 of 20
(page number not for citation purposes)
tal imager. Applications to IMRT verification. Med Phys 2006,
33:2839-2851.
12. Nicolini G, Fogliata A, Vanetti E, Clivio A, Vetterli D, Cozzi L: Test-
ing the GLAaS algorithm for dose measurements on an
amorphous silicon portal imager on low and high energy
photon beams. Med Phys 35:464-472.
13. Low DA, Harms WB, Mutic S, Purdy JA: A technique for the quan-
titative evaluation of dose distributions. Med Phys 1998,
25:656-660.
14. Fogliata A, Nicolini G, Vanetti E, Clivio A, Cozzi L: Dosimetric val-
idation of the anisotropic analytical algorithm for photon
dose calculation: fundamental characterization in water.
Phys Med Biol 2006, 51:1421-1438.
15. Budgell GJ, Zhang R, Mackay RI: Daily monitoring of linear accel-
erator beam parameters using an amorphous silicon EPID.
Phys Med Biol 2007, 52:1721-1733.