Báo cáo khoa học: "Impact of different leaf velocities and dose rates on the number of monitor units and the dose-volume-histograms using intensity modulated radiotherapy with sliding-window technique" potx
Bạn đang xem bản rút gọn của tài liệu. Xem và tải ngay bản đầy đủ của tài liệu tại đây (1.65 MB, 9 trang )
BioMed Central
Page 1 of 9
(page number not for citation purposes)
Radiation Oncology
Open Access
Research
Impact of different leaf velocities and dose rates on the number of
monitor units and the dose-volume-histograms using intensity
modulated radiotherapy with sliding-window technique
Hilke Vorwerk*, Daniela Wagner and Clemens F Hess
Address: Department of Radiotherapy and Radiooncology, University Hospital Göttingen, Robert-Koch-Str. 40, 37099 Göttingen, Germany
Email: Hilke Vorwerk* - ; Daniela Wagner - ;
Clemens F Hess -
* Corresponding author
Abstract
Background: Intensity modulated radiotherapy (IMRT) using sliding window technique utilises a
leaf sequencing algorithm, which takes some control system limitations like dose rates (DR) and
velocity of the leafs (LV) into account. The effect of altering these limitations on the number of
monitor units and radiation dose to the organs at risk (OAR) were analysed.
Methods: IMRT plans for different LVs from 1.0 cm/sec to 10.0 cm/sec and different DRs from
100 MU/min to 600 MU/min for two patients with prostate cancer and two patients with squamous
cell cancer of the scalp (SCCscalp) were calculated using the same "optimal fluence map". For each
field the number of monitor units, the dose volume histograms and the differences in the "actual
fluence maps" of the fields were analysed.
Results: With increase of the DR and decrease of the LV the number of monitor units increased
and consequentially the radiation dose given to the OAR. In particular the serial OARs of patients
with SCCscalp, which are located outside the end position of the leafs and inside the open field,
received an additional dose of a higher DR and lower LV is used.
Conclusion: For best protection of organs at risk, a low DR and high LV should be applied. But
the consequence of a low DR is both a long treatment time and also that a LV of higher than 3.0
cm/sec is mechanically not applicable. Our recommendation for an optimisation of the discussed
parameters is a leaf velocity of 2.5 cm/sec and a dose rate of 300–400 MU/min (prostate cancer)
and 100–200 MU/min (SCCscalp) for best protection of organs at risk, short treatment time and
number of monitor units.
Background
Intensity modulated radiotherapy (IMRT) offers a method
of delivering a radiation dose conformed to the shape of
targets while minimizing the dose to the surrounding tis-
sue and nearby critical organs. For IMRT with sliding win-
dow technique, modern IMRT planning systems
incorporate many control system limitations in their leaf
sequencing algorithms, such as limits for the leaf velocity
(LV), the actual dose rate (DR), leakage, dynamic leaf gap,
transmission and a minimum leaf gap (mechanical dis-
tance between the tops of the MLCs). Incorporation of
control system limitations into the leaf sequencing algo-
Published: 23 September 2008
Radiation Oncology 2008, 3:31 doi:10.1186/1748-717X-3-31
Received: 26 March 2008
Accepted: 23 September 2008
This article is available from: />© 2008 Vorwerk et al; licensee BioMed Central Ltd.
This is an Open Access article distributed under the terms of the Creative Commons Attribution License ( />),
which permits unrestricted use, distribution, and reproduction in any medium, provided the original work is properly cited.
Radiation Oncology 2008, 3:31 />Page 2 of 9
(page number not for citation purposes)
rithm results in decreased discrepancies between planned
and delivered IMRT fields. Dynamic sliding-window leaf
sequences can be produced, which require neither beam
interruptions nor dose rate modulations for the parameter
values used in calculating the sequence [1,2].
In the treatment planning process for IMRT with sliding
window technique, an optimization process is first carried
out to optimise the coverage of the target volume and to
protect the organs at risk. With this optimization informa-
tion the system calculates an "optimal fluence map". In a
second step the leaf motions are calculated taking the
above mentioned limitations of the real accelerator into
consideration. Thus "actual fluence maps" are created out
of the "optimal fluence maps". The used control system
limitations can be defined by the user.
The purpose of our study was to analyse the impact of dif-
ferent DR and LV on the "actual fluence maps" using the
same "optimal fluence map" and thereby the impact on
the number of monitor units and the dose-volume-histo-
gram of the organs at risk (OAR). We found larger impacts
on the results for patients with squamous cell cancer of
the scalp than for patients with prostate cancer.
Methods
Patient data
Patient data was acquired from four patients who were
recently treated with IMRT in our department. Two of the
patients were treated for prostate cancer (PC) with 72 Gy
(2 Gy per fraction) using five fields and two for squamous
cell cancer of the scalp (SCCscalp) with 60 Gy (2 Gy) per
fraction using four to five fields (figure 1). We chose two
examples per tumor entity to avoid random errors in one
patient.
Treatment planning system
For this study the planning system Helios (Version 8.1
ARIA, Algorithms 8.1.17, Varian Medical Systems, Palo
Alto, CA, USA) was used. The treatment plans were calcu-
lated for a Clinac 2300 C/D from Varian Medical Systems
and for a Millenium multi leaf collimator (MLC) with 120
leafs.
The treatment planning system created "optimal fluence
maps" after the optimization process (figure 1). These flu-
ences did not consider the mechanical components of the
linear accelerator and MLC. Particularly the "optimal flu-
ences maps" were independent of the LV and the DR. In a
second step the leaf motions were calculated based on the
chosen LV and DR of the field (see below). Taking the leaf
motions into consideration, the treatment planning sys-
tem created "actual fluence maps", which contain control
system limitations of the accelerator in contrast to the
"optimal fluence maps". The dose distribution was calcu-
lated in a third step based on the "actual fluence".
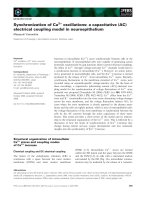
Beam eye view illustrations of "optimal fluences" for patients with prostate cancer (left) and squamous cell cancer of the scalp (right)Figure 1
Beam eye view illustrations of "optimal fluences" for patients with prostate cancer (left) and squamous cell
cancer of the scalp (right). Left: Beam eye view from 305° gantry angle from a patient (PC) in relation to the locations of
the organs at risk: femoral heads (red and blue), rectum (cyan), bladder (yellow). Right: Beam eye view from 290° gantry angle
from a patient (SCCscalp) in relation to the locations of the organs at risk: chiasm (blue), brainstem (cyan), nn. optici (green
and purple), lenses (yellow and orange).
Radiation Oncology 2008, 3:31 />Page 3 of 9
(page number not for citation purposes)
Analysis
We analysed the number of monitor units for each field
depending on following DR and LV:
• 1.0 cm/sec, 1.5 cm/sec, 2.0 cm/sec, 2.5 cm/sec, 3.0 cm/
sec, 3.5 cm/sec, 4.0 cm/sec, 10.0 cm/sec
• 100 MU/min, 200 MU/min, 300 MU/min, 400 MU/
min, 500 MU/min, 600 MU/min
IMRT plans with a leaf velocity limit of 10.0 cm/sec are
mechanically not applicable. We chose this velocity in
order to analyse the theoretical effects of very high LV (fig-
ure 2).
We measured the number of monitor units (NMU)
depending on the DR and LV for all fields and entities. The
figures demonstrate examples.
Different tumor entities and different photon energies
For patients with SCC scalp we used a four and five field
technique with 6 MVX (photons with a maximum energy
of 6 MeV). The patients with PC were treated with a mixed
beam technique, which acquired two fields with 20 MVX
from the lateral sides and three fields from dorsal and ven-
tral with 6 MVX. All fields with 6 MVX were analysed and
in a second step the fields with 6 MVX were compared
with the 20 MVX fields.
Effects on the dose volume histogram
The influence of the different LV and DR on the dose vol-
ume histograms (DVH) of the planning target volume
(PTV), the body and OAR were analysed for all fields and
"actual fluence maps". The bladder, rectum, and femoral
heads were considered as OAR for the patients with PC
(figure 1). All of these OARs were located in the direct
course of beam of at least two of the five fields.
The chiasm, brain stem, nn. optici, lenses, and brain were
analysed for the patients with SCCscalp (figure 1) [3]. In
these patients the chiasm, brain stem and nn. optici were
located in the direct course of beam of at least two fields.
The lenses are always located outside the end positions of
the leafs and in half of the fields inside the open field.
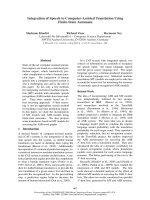
Influence of different maximum leaf velocities on the number of monitor units appliedFigure 2
Influence of different maximum leaf velocities on the number of monitor units applied. Mean of the number of
monitor units of all fields against the leaf velocity of both patient with prostate cancer and of both patient with squamous cell
cancer of the scalp for different dose rates: green rhombus – 100 MU/min, blue square – 200 MU/min, purple triangle – 300
MU/min, red circle – 400 MU/min, orange rhombus – 500 MU/min, yellow square – 600 MU/min.
0
50
100
150
200
250
300
350
400
450
0246810
leaf velocity [cm/sec]
number of monitor unit
s
cancer of the scalp
prostate cancer
600 MU/min
100 MU/min
Radiation Oncology 2008, 3:31 />Page 4 of 9
(page number not for citation purposes)
Comparison of actual fluence images
The treatment planning system has no function included
to compare different fluence images, but the planning sys-
tem can create artificial predicted portal dose images
(PPDI). This tool can be used for the verification of IMRT
plans. PPDIs of the "actual fluence maps" were created
and compared with each other by use of the gamma index
evaluation with 3 mm and 3% [4-6]. The relation between
the gamma index and the number of monitor units were
analysed.
Results
The number of monitor units depends on the dose rate
The higher the DR the higher was the NMU per field
(NMU ~ DR) not only for the two treatment plans of
patients with PC but also for the two treatment plans of
patients with SCCscalp (figure 3). With increase of the LV
the gradient of the straight line became steeper for all
fields, particularly for patients with SCCscalp (figure 3).
The number of monitor units depends on the leaf velocity
The higher the DR, the higher the difference between the
NMU for different LV (figure 3). The NMU decreased with
higher LV approximately as followed (figure 2):
With a leaf velocity of 10.0 cm/sec the differences between
the NMU for different DR was very low with 3–7 MU for
PC and 6–14 MU for SCCscalp.
The dependence of the NMU on the LV was more pro-
nounced in treatment plans for patients with SCCscalp
than with PC (figure 2 and 3). The mean of the NMU of
all fields were higher for SCC scalp (225 MU) than for PC
(199 MU).
To estimate the complexity of the fluence maps for all
fields, the NMU of the dynamic field was divided by the
NMU of the corresponding open field. The complexity of
NMU c LV
c
== =−
12
2
140 193 1 6 0 3c to c to - for different DR P
1
(CC
c to c to - for different DR SCCscal
)
(
12
212 373 0 3 0 05==− pp)
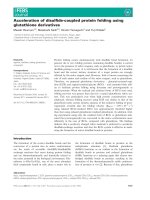
Influence of different dose rates on the number of monitor units appliedFigure 3
Influence of different dose rates on the number of monitor units applied. Mean of the number of monitor units of all
fields against the dose rate of both patient with prostate cancer and of both patient with squamous cell cancer of the scalp for
different leaf velocities: dark green triangle- 1.0 cm/sec, turquoise rhombus – 1.5 cm/sec, blue square – 2.0 cm/sec, purple tri-
angle – 2.5 cm/sec, red square – 3.0 cm/sec, orange rhombus – 3.5 cm/sec, yellow circle – 4.0 cm/sec, light green triangle – 10.0
cm/sec.
0
50
100
150
200
250
300
350
400
450
0 100 200 300 400 500 600 700
dose rate [MU/min]
number of monitor units
cancer of the
scal
p
prostate cancer
1.0 cm/sec
10.0 cm/sec
Radiation Oncology 2008, 3:31 />Page 5 of 9
(page number not for citation purposes)
the fluence maps was higher in the fields of SCCscalp
compared with the fields of PC as expected.
Comparison of fields with 6 MVX and 20 MVX in treatment
plans for prostate cancer
The gradient of the linear dependence between NMU and
DR was comparable for fields planned with 6 MVX and 20
MVX (figure 4). Only for a LV of 1.0 cm/sec and 20 MVX
could we demonstrate a higher NMU than expected
(median 75 MU's difference between all fluences of all
fields with 6 MVX (PC) and of all fields with 20 MVX
(PC)). Unlike all other curves there was nearly no depend-
ence of the NMU on the DR for a leaf velocity of 10.0 cm/
sec and 20 MVX.
Influence of different leaf velocities on the dose-volume-
histogram in prostate cancer
Different LV and DR had little influence on the coverage
of the PTV (up to 0.6% difference relative to the mean
over all DR and LV), the dose exposition of the OAR (fig-
ure 5) and the body (represents the low dose areas). The
higher the DR and the lower the LV, the higher was the
dose given to the PTV and OAR. The D55 and D90 of the
rectum differed by 0.2% – 3.7% and 0.3% – 3.9% relative
to the mean over all DR and LV, respectively. This was
comparable for the bladder, the femoral heads and the
body.
Impact of different leaf velocities on the dose-volume-
histogram in patients with squamous cell cancer of the
scalp
The PTV coverage for both patients was nearly independ-
ent of the DR and LV. The percentage of the volume cov-
ered by the 100% isodose line deviated up to 0.25% from
the mean over all DR and LV for each of both patients.
The radiation dose given to all OAR in patients with SCC-
scalp showed an increase with increased NMU and DR
and with decreased LV (figure 6). For the chiasm, the
brain stem and the nn. optici the maximum dose deviated
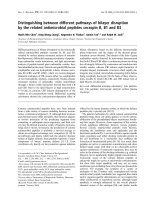
Influence of different energies on the number of monitor units appliedFigure 4
Influence of different energies on the number of monitor units applied. Mean of the number of monitor units of all
fields against the dose rate of all fields with 6 MVX and all fields with 20 MVX of both patients with PC for different leaf veloc-
ities. The continuous lines are values from the field with 6 MVX and the dashed lines from the field with 20 MVX. Calculation
was done for different leaf velocities: dark green triangle- 1.0 cm/sec, turquoise rhombus – 1.5 cm/sec, blue square – 2.0 cm/
sec, purple triangle – 2.5 cm/sec, red square – 3.0 cm/sec, orange rhombus – 3.5 cm/sec, yellow circle – 4.0 cm/sec, light green
triangle – 10.0 cm/sec.
100
120
140
160
180
200
220
240
0 100 200 300 400 500 600 700
dose rate [MU/min]
number of monitor unit
s
prostate cancer
20 MVX
prostate cancer
6 MVX
1.0 cm/sec
10.0 c/sec
Radiation Oncology 2008, 3:31 />Page 6 of 9
(page number not for citation purposes)
by 6.0% – 9.1% (= 3.1 Gy – 4.8 Gy) for different DR and
LV relative to the mean of the maximum dose of all flu-
ences (all DR and LV) of each patient. The dose never
exceeded the dose limitations of the OAR (54 Gy),
because the absolute given doses (maximum 25.2 Gy)
were about half of the limits for the OAR.
The maximum dose to the left and right lens of the first
patient with SCCscalp ranged between 2.0 Gy to 4.0 Gy
and 4.4 Gy to 8.3 Gy, respectively. In this patient the crit-
ical dose of 6 Gy to the lenses was exceeded by use of a
high DR and low LV (LV 1.5–2.0 cm/sec and DR 500–600
MU/min, LV 1.0 cm/sec and DR 300–600 MU/min). We
detected comparable results for the second patient with
SCCscalp.
Gamma index of predicted portal dose images
The "actual fluence maps" differed for different DR and LV
while the "optimal fluence map" was the same. The com-
parison between the "actual fluence maps" calculated
using a DR of 100 MU/min and 600 MU/min showed a
mean gamma index over all fields of 1.1 (PC) and 2.7
(SCCscalp) for a LV of 1.0 and of 0.2 (PC) and 0.7 (SCC-
scalp) for a LV of 10.0. The NMU was correlated with the
gamma index – the higher the NMU, the higher the
gamma index (figure 2).
The mean gamma index between the fields with a LV of
1.0 cm/sec and 10.0 cm/sec was PC (SCCscalp) 0.2 (0.8)
and 1.1 (2.9) using a DR of 100 MU/min and 600 MU/
min, respectively. The gamma index was correlated to the
NMU as well (figure 3).
Dose volume histogram of a patient with prostate cancerFigure 5
Dose volume histogram of a patient with prostate cancer. Dose volume histogram (relation of relative volume to
delivered relative dose) from one patient for PTV (red), rectum (blue) and bladder (yellow) for different dose rates (DR) and
leaf velocities (LV): circle – DR 100 MU/min and LV 1.0 cm/sec. triangle – DR 100 MU/min and LV 10.0 cm/sec. sun – DR 600
MU/min and LV 1.0 cm/sec. square – DR 600 MU/min and LV 10.0 cm/sec.
ratio of total structure volume [%]
0
100
80
60
40
20
0 20 40 60 80 100
relative dose [%]
Radiation Oncology 2008, 3:31 />Page 7 of 9
(page number not for citation purposes)
The images of the gamma evaluation showed differences
particularly outside of the end positions of the leafs but
inside of the open fields.
Discussion
According to our analysis the NMU in IMRT plans with
sliding window technique increased with decreasing LV
(NMU ~ LV
-1
) and increasing DR (NMU ~ DR) (figure 2
and 3). The NMU are important for the amount of trans-
mitted radiation dose through the MLC and the treatment
time (time ~ NMU).
The treatment time should be short in order to reduce the
effects induced by patient movement, breathing and other
random errors during treatment. A low DR implicates
long treatment times, even though the NMU is lower than
for a high DR. To decrease the treatment time the DR
should be as high as possible.
For treatment planning of IMRT the reduction of the
NMU is an important factor. The higher the NMU, the
higher is the transmitted radiation dose [7]. This depends
on the transmission passing through the leafs, between
two adjacent leafs of one carriage and through the gap
between two opposite leafs (this is more pronounced by
the Varian MLCs compared to MLC of other companies
because of their rounded leaf edges). Decreasing the trans-
mitted radiation doses is important for protection of the
Impact of different maximum leaf speeds and dose rates on the dose volume histogramsFigure 6
Impact of different maximum leaf speeds and dose rates on the dose volume histograms. Dose volume histogram
(relation of absolute volume to delivered dose) for the chiasm and brain stem for different dose rates (triangle – 100 MU/min,
square – 200 MU/min, sun – 300 MU/min, circle – 400 MU/min, rhombus – 500 MU/min, heart – 600 MU/min) and leaf veloci-
ties (circle – 1.0 cm/sec, sun – 1.5 cm/sec, "B" – 2.0 cm/sec, "A" – 2.5 cm/sec, square – 3.0 cm/sec, rhombus – 3.5 cm/sec, heart
– 4.0 cm/sec, triangle – 10.0 cm/min) for one patient with squamous cell cancer of the scalp. Top left – dose rate of 600 MU/
min and different leaf velocities. Top right – dose rate of 100 MU/min and different leaf velocities. Bottom left – leaf velocity of
1.0 cm/sec and different dose rates. Bottom right – leaf velocity of 10.0 cm/sec and different dose rates.
relative dose [%]
structure volume [cm
3
]
20
10
0
16
6
2
4
8
12
14
18
0 5 10 15 20 25 30 35 40
600 MU/min
1.0 cm/sec
10.0 cm/sec
100 MU/min
1.0 cm/sec
10.0 cm/sec
1.0 cm/sec 10.0 cm/sec
100 MU/min
600 MU/min
100 MU/min
600 MU/min
brain stem
brain stem
brain stem
brain stem
chiasm
chiasm
chiasm chiasm
relative dose [%]
structure volume [cm
3
]
20
10
0
16
6
2
4
8
12
14
18
0 4 812 1620242832
relative dose [%]
structure volume [cm
3
]
20
10
0
16
6
2
4
8
12
14
18
0 5 10 15 20 25 30 35 40
relative dose
[
%
]
structure volume [cm
3
]
20
10
0
16
6
2
4
8
12
14
18
0 4 812 1620242832
Radiation Oncology 2008, 3:31 />Page 8 of 9
(page number not for citation purposes)
organs at risk, especially for organs that are located out-
side the end position of the leafs and inside the open
fields as the lenses (figure 1).
To minimise the NMU and to avoid unnecessary radiation
doses given to the OAR, the DR should be as low as possi-
ble. Thus the choice of the DR must be a compromise
between these considerations.
We compared the actual fluences of the IMRT fields cre-
ated after leaf sequencing for different LV and DR, to
detect differences in the fluence distribution and particu-
larly the location of these differences. The maximum
gamma index was higher for fluences with a higher NMU
as an expression of transmitted and scattered radiation.
Most differences could be detected outside the end posi-
tion of the leafs and inside the open field. This correlated
with a higher radiation dose in the OAR, which were
located outside the end position of leafs and inside the
open field, as in the lenses in patients with SCCscalp. This
has a significant impact because normally the radiation
dose decreases exponentially with increasing distance
from the treatment field [8]. But in this case the OAR
received more radiation dose than expected when looking
at the distance to the endpoints of the MLC.
The coverage of the PTV is approximately independent of
the LV. Paying attention to the optimal protection of the
OAR the use of a high LV would be the best choice. On the
other hand a high LV implicates mechanical problems
during application of the radiation dose. This may result
in unintended beam interruptions and dose rate modula-
tions during application. A high leaf velocity results in
more frequent collisions between the MLC with more
malfunctions of the MLC motors as a consequence. An
avoidance of collisions can be inducted by larger leaf gaps
(minimum distance between the leave tops) [1]. Further-
more, with a large leaf gap the amount of transmitted
radiation dose between the two MLC banks will increase.
Because of these mechanical and technical limits the LV
should not exceed 3.0 cm/sec.
As desired the higher the LV, the lower are the NMU, the
treatment time and the given radiation dose to the OAR.
In consequence we recommend a LV of 2.5 – 3.0 cm/sec.
The intension by the DR choice is to find the best compro-
mise between reducing treatment time using a high DR
and reducing the given dose to the OAR and the NMU
using a low DR at the same time.
Limits for patients with prostate cancer
In patients with PC the effects on the OAR are not notice-
ably higher with use of a high DR than with a DR of 100
MU/min, but the NMU increases. To decrease the NMU
(with a low DR) and the treatment time (with a high DR)
we recommend a DR of 300 – 400 MU/min.
By use of a LV of 2.5 – 3.0 cm/sec and a dose rate of 300 –
400 MU/min the implication of fields with 6 MVX or 20
MVX is negligible concerning the NMU (figure 4). In order
to make the decision regarding the energy used, one
should consider other reasons such as lowering the maxi-
mum dose or a reduction of the production of neutrons.
For high DR and low LV a high increase of the NMU for
fields with 20 MVX was detected. For fields with 6 MVX
and 20 MVX the limitations slip in the sequencing algo-
rithm are the same except for the transmission and
dynamic leaf gap. The higher NMU can only be founded
in these parameters.
Limits for patients with squamous cell cancer of the scalp
The NMU is higher for patients with SCCscalp than for
patients with PC. This may be due to larger field size or
higher complexity of the fields of patients with SCCscalp.
Even if the equivalent square of the radiation fields were
larger for SCCscalp than for PC, we assume that the com-
plexity of the fluences had the most important influence
on the NMU [9].
For the patients with SCCscalp the effects on the OAR are
more dependent on the used DR than for patients with
PC. This may result not only from the higher NMU but
also from the location of the OAR. In our analysis we
found maximal radiation doses to the lenses, which varied
between 2.0 Gy and 8.3 Gy for different LV and DR. The
TD 50/5 for lenses is 6 Gy [3], so that the use of different
specifications for planning leads to acceptable or unac-
ceptable dose given to the OAR. The OAR for patients with
PC are located largely inside the radiation fields, so that
the increased transmitted and scattered radiation dose
does not effect the patients with SCCscalp as much,
whereas the OAR were mostly located outside the end
position of the leafs. In these cases the choice of the LV
and the DR is more important than for PC, because the
influence on the NMU and transmission radiation is very
high. Another alternative to reduce transmitted radiation
through the MLC may be the use of jaws, which follow the
open window of the MLC dynamically to reduce the deliv-
ered dose outside the open field as described by Schmid-
halter et al. [7].
To reduce radiation dose given to the OAR a lower DR
than for patients with PC should be selected to decrease
the NMU and therefore the amount of transmitted and
scattered radiation dose. Therefore we recommend a DR
of 100 – 200 MU/min.
Publish with BioMed Central and every
scientist can read your work free of charge
"BioMed Central will be the most significant development for
disseminating the results of biomedical research in our lifetime."
Sir Paul Nurse, Cancer Research UK
Your research papers will be:
available free of charge to the entire biomedical community
peer reviewed and published immediately upon acceptance
cited in PubMed and archived on PubMed Central
yours — you keep the copyright
Submit your manuscript here:
/>BioMedcentral
Radiation Oncology 2008, 3:31 />Page 9 of 9
(page number not for citation purposes)
Conclusion
To decrease treatment time, NMU and radiation dose
given to the OAR in IMRT planning with sliding window
technique, a careful decision for DR and LV should be per-
formed. Under consideration of the above mentioned and
additionally mechanical and technical aspects limits for
the LV of 2.5 – 3.0 cm/sec and for the DR of 300 – 400
MU/min should be respected for patients with PC. For
patients with SCCscalp a lower DR (100 – 200 MU/min)
should be chosen to minimize radiation dose given to
serial OAR, particularly those who are located outside the
end position of the leafs and inside the open field.
Competing interests
The authors declare that they have no competing interests.
Authors' contributions
DW participated in the design of the study and carried out
the treatment plans. CFH participated in the draft of the
manuscript. HV performed the statistical analysis. All
authors read and approved the final manuscript.
References
1. Litzenberg DW, Moran JM, Fraass BA: Incorporation of realistic
delivery limitations into dynamic MLC treatment delivery.
Med Phys 2002, 29:810-820.
2. Low DA, Sohn JW, Klein EE, Markman J, Mutic S, Dempsey JF: Char-
acterization of a commercial multileaf collimator used for
intensity modulated radiation therapy. Med Phys 2001,
28:752-6.
3. Emami B, Lyman J, Brown A, Coia L, Goitein M, Munzenrider JE, Shank
B, Solin LJ, Wesson M: Tolerance of normal tissue to therapeu-
tic irradiation. Int J Radiat Oncol Biol Phys 1991, 21:109-122.
4. De Martin E, Fiorino C, Broggi S, Longobardi B, Pierelli A, Perna L,
Cattaneo GM, Calandrino R: Agreement criteria between
expected and measured field fluences in IMRT of head and
neck cancer: The importance and use of the gamma histo-
grams statistical analysis. Radiother Oncol 2007, 85:399-406.
5. Wendling M, Zijp LJ, McDermott LN, Smit EJ, Sonke JJ, Mijnheer BJ,
van Herk M: A fast algorithm for gamma evaluation in 3D.
Med Phys 2007, 34:1647-1654.
6. Spezi E, Lewis DG: Gamma histograms for radiotherapy plan
evaluation. Radiother Oncol 2006, 79:224-230.
7. Schmidhalter D, Fix MK, Niederer P, Mini R, Manser P: Leaf trans-
mission reduction using moving jaws for dynamic MLC
IMRT. Med Phys 2007, 34:3674-3687.
8. Kry SF, Salehpour M, Followill DS, Stovall M, Kuban DA, White RA,
Rosen II: Out-of-field photon and neutron dose equivalents
from step-and-shoot intensity-modulated radiation therapy.
Int J Radiat Oncol Biol Phys 2005, 62:1204-1216.
9. Giorgia N, Antonella F, Eugenio V, Alessandro C, Filippo A, Luca C:
What is an acceptably smoothed fluence? Dosimetric and
delivery considerations for dynamic sliding window IMRT.
Radiat Oncol 2007, 2:42.