Báo cáo khoa học: " Integrated-boost IMRT or 3-D-CRT using FET-PET based auto-contoured target volume delineation for " pps
Bạn đang xem bản rút gọn của tài liệu. Xem và tải ngay bản đầy đủ của tài liệu tại đây (1.04 MB, 12 trang )
BioMed Central
Open Access
Page 1 of 12
(page number not for citation purposes)
Radiation Oncology
Research
Integrated-boost IMRT or 3-D-CRT using FET-PET based
auto-contoured target volume delineation for glioblastoma
multiforme - a dosimetric comparison
Marc D Piroth*
1,4
, Michael Pinkawa
1,4
, Richard Holy
1,4
, Gabriele Stoffels
3,4
,
Cengiz Demirel
1
, Charbel Attieh
1
, Hans J Kaiser
2
, Karl J Langen
3,4
and
Michael J Eble
1,4
Address:
1
Department of Radiation Oncology, RWTH Aachen University Hospital, Pauwelsstrasse 30, 52074 Aachen Germany,
2
Department of
Nuclear Medicine, RWTH Aachen University Hospital, Pauwelsstrasse 30, 52074 Aachen Germany,
3
Institute of Neurosciences and Medicine,
Research Centre Jülich, 52425 Jülich, Germany and
4
JARA (Jülich Aachen Research Alliance) Forschungszentrum Jülich GmbH Wilhelm-Johnen-
Straße, 52428 Jülich, Germany
Email: Marc D Piroth* - ; Michael Pinkawa - ; Richard Holy - ;
Gabriele Stoffels - ; Cengiz Demirel - ; Charbel Attieh - ;
Hans J Kaiser - ; Karl J Langen - ; Michael J Eble -
* Corresponding author
Abstract
Background: Biological brain tumor imaging using O-(2-[
18
F]fluoroethyl)-L-tyrosine (FET)-PET
combined with inverse treatment planning for locally restricted dose escalation in patients with
glioblastoma multiforme seems to be a promising approach.
The aim of this study was to compare inverse with forward treatment planning for an integrated
boost dose application in patients suffering from a glioblastoma multiforme, while biological target
volumes are based on FET-PET and MRI data sets.
Methods: In 16 glioblastoma patients an intensity-modulated radiotherapy technique comprising
an integrated boost (IB-IMRT) and a 3-dimensional conventional radiotherapy (3D-CRT) technique
were generated for dosimetric comparison. FET-PET, MRI and treatment planning CT (P-CT) were
co-registrated. The integrated boost volume (PTV1) was auto-contoured using a cut-off tumor-to-
brain ratio (TBR) of ≥ 1.6 from FET-PET. PTV2 delineation was MRI-based. The total dose was
prescribed to 72 and 60 Gy for PTV1 and PTV2, using daily fractions of 2.4 and 2 Gy.
Results: After auto-contouring of PTV1 a marked target shape complexity had an impact on the
dosimetric outcome. Patients with 3-4 PTV1 subvolumes vs. a single volume revealed a significant
decrease in mean dose (67.7 vs. 70.6 Gy). From convex to complex shaped PTV1 mean doses
decreased from 71.3 Gy to 67.7 Gy. The homogeneity and conformity for PTV1 and PTV2 was
significantly improved with IB-IMRT. With the use of IB-IMRT the minimum dose within PTV1 (61.1
vs. 57.4 Gy) and PTV2 (51.4 vs. 40.9 Gy) increased significantly, and the mean EUD for PTV2 was
improved (59.9 vs. 55.3 Gy, p < 0.01). The EUD for PTV1 was only slightly improved (68.3 vs. 67.3
Gy). The EUD for the brain was equal with both planning techniques.
Published: 23 November 2009
Radiation Oncology 2009, 4:57 doi:10.1186/1748-717X-4-57
Received: 13 August 2009
Accepted: 23 November 2009
This article is available from: />© 2009 Piroth et al; licensee BioMed Central Ltd.
This is an Open Access article distributed under the terms of the Creative Commons Attribution License ( />),
which permits unrestricted use, distribution, and reproduction in any medium, provided the original work is properly cited.
Radiation Oncology 2009, 4:57 />Page 2 of 12
(page number not for citation purposes)
Conclusion: In the presented planning study the integrated boost concept based on inversely
planned IB-IMRT is feasible. The FET-PET-based automatically contoured PTV1 can lead to very
complex geometric configurations, limiting the achievable mean dose in the boost volume. With IB-
IMRT a better homogeneity and conformity, compared to 3D-CRT, could be achieved.
Introduction
In spite of intensive efforts to improve treatment strategies
the prognosis of patients suffering from a Glioblastoma
multiforme remains poor with a median survival time of
12-14 months [1,2]. Even though a radiation dose-
response relationship could be demonstrated in clinical
[3,4] as well as in experimental studies [5-8], no signifi-
cant increase of survival could be achieved in randomized
clinical trials. Although several Phase II-studies showed
promising results [9,10], the RTOG 93-05 study failed to
demonstrate a prognostic improvement for patients
treated with a stereotactic boost in addition to the stand-
ard 60 Gy fractionated conformal radiotherapy with the
alkylating agent carmustine (BCNU) [11]. The authors
speculated that these results may be caused by the fact that
glioblastomas (GBM's) are inherently infiltrating neo-
plasms. Another reason for the poor results of those stud-
ies, however, may be the inability of current imaging
methods to adequately reflect the true extent of the
tumors. Magnetic resonance imaging (MRI) is currently
the method of choice for the diagnosis of primary brain
tumors. The delineation between glioma and surrounding
edema with MRI is unreliable since the tumor is not
sharply demarcated and if in addition the blood-brain
barrier remains intact. Therefore, it appears essential to
base locally focused dose escalation concepts on more
specific imaging methods, such as MR spectroscopy or
Positron Emission Tomography (PET). Several data sug-
gest that brain tumor imaging with PET using amino acids
is more reliable than MRI to define the extent of cerebral
gliomas [12-16]. O-(2-[
18
F]fluoroethyl)-L-tyrosine (FET)
is a well established amino acid tracer for PET. Biological
brain tumor imaging combined with inverse treatment
planning for locally restricted dose escalation in patients
with glioblastoma multiforme seems to be a promising
approach.
The aim of this study was to compare inverse with forward
treatment planning for an integrated boost dose applica-
tion in patients suffering from a glioblastoma multiforme,
while the auto-contoured biological target volumes are
based on O-(2-[18F]Fluorethyl)-L-Tyrosin (FET)-PET and
MRI data sets.
Materials and methods
Patients
Sixteen consecutive patients with a histologically proven
supratentorial glioblastoma multiforme (WHO grade IV)
were treated with an intensity-modulated radiotherapy
comprising an integrated boost dose application (IB-
IMRT). In addition a 3-dimensional conventional radio-
therapy (3D-CRT) treatment plan was generated for dosi-
metric comparison. The selected patients were treated in
our clinic from January 2008 to January 2009 within an
ongoing prospective monocentric phase-II study. The
mean age was 55.6 (36-73) years. Ten patients were male.
The Karnofsky perfomance index was ≥ 70% in 15
patients. A gross total and partial resection could be
achieved in 8 patients. The tumor was located in the right
and left hemisphere in 4 and 12 patients. Half of the
tumors were located in the frontal lobe, while the other
half of patients showed an equally frequent location
within the temporal or parietal lobe. The study was
approved by the university ethics committee and federal
authorities. All subjects gave written informed consent for
their participation in the study.
Target volume definition
After head fixation with a thermoplastic mask (Orfit
®
Ray-
cast
©
-HP mask system, mean target isocenter translation
<2 mm [17]) a dedicated computer tomography (P-CT)
with continuous slices of 2 mm thickness was made. An
O-(2-F-18-Fluorethyl)-L-Tyrosin-PET (FET-PET) was per-
formed in all 16 patients within 2 days after P-CT and
within an interval of 11-20 days after surgical resection or
biopsy of the tumor. Prior to FET-PET patients remained
fasting for at least 6 h. PET images were acquired 15-40
min after intravenous injection of 200 MBq
18
F-FET. The
measurements were performed with an ECAT EXACT HR+
scanner (Siemens Medical Systems, Inc.) in 3-dimen-
sional mode (32 rings; axial field of view, 15.5 cm)
(details s [18]).
All patients received pre- and postoperative MRI's, per-
formed in a 1,5 tesla MRI scanner with a standard head
coil, which were integrated in the planning process. The
MRI protocol consisted of a contrast enhanced T1-
weighted, a T2-weighted and a FLAIR (fluid attenuation
inversion recovery) sequence. All image data sets were
reconstructed and imported into the Philips Pinnacle
3
irradiation treatment planning system (Version 8.0 m,
Philips Medical Systems, Eindhoven, NL). The Philips
Syntegra™ image registration tool was used to co-registrate
the postoperative MRI and FET-PET to the native P-CT.
From the three auto-registration methods available in
Syntegra the Mutual Information (MI) method was used
Radiation Oncology 2009, 4:57 />Page 3 of 12
(page number not for citation purposes)
[19]. The image co-registration process was performed
automatically. Finally the fusion results were assessed vis-
ually based on anatomic landmarks. The preoperative
MRI was integrated side-by-side in the planning process.
Two clinical target volumes (CTV) were generated. For
delineation of CTV1, defined as biological target volume
from postoperative FET-PET imaging, an auto-contouring
process was used.
The definition of the biological target volume with PET is
a critical issue. Due to the limited spatial resolution of 5
mm it is not possible to define the exact tumor border on
PET images. Tumor delineation based on the mean back-
ground activity such as the tumor/brain ratio appears to
be an adequate approach for the problem of tumor defi-
nition in amino acid studies [20]. In a previous biopsy
controlled study we found for tumor tissue a mean lesion-
to-brain ratio of FET uptake of 2.6 ± 0.9 and 1.2 ± 0.4 for
peritumoral tissue [15]. Others reported that best differ-
entiation of tumor and non-tumoral tissue could be
observed at tumor/brain ratios of 2.0 and 2.2 [16,21]. In
the present study CTV1 was defined as the volume within
a cut-off tumor-to-brain ratio (TBR) of ≥ 1.6. Since this
threshold value is in the lower range the tumor volume is
overestimated and is assumed to contain a safety margin
of approx. 5 mm. Therefore no additional margin was
given to between CTV1 and PTV1 (CTV1 = PTV1).
For generating the TBR a polygonal reference region was
drawn over several axial P-CT slices, comprising a volume
of 40-70 cm
3
from the contra-lateral cerebral hemisphere.
Then the mean activity value of the normal brain reference
area was multiplied by the cut-off value for automatic
delineation of CTV1. Finally manual corrections were
done, since the activity in blood vessels or postoperative
extracerebral soft tissue could be above the cut-off value
[22]. Venous structures, visible in the co-registrated MRI,
were excluded. CTV-subvolumes comprising less than 3
voxels (FET-PET voxel size 2 × 2 × 2.4 mm) were deleted.
We classified the shape of the target volume CTV1 into
three categories: convex, concave and complex. The term
"complex" describes a finger-shaped or cuttlefish like
appearance. In addition the number of separate subvol-
umes for each CTV1 was considered for classification of
target volume complexity.
The CTV2 was defined as the contrast-enhanced area from
pre- and postoperative MRI including a safety margin of 2-
3 cm. The margin was further extended to include the sur-
rounding preoperative edema, individually adapted to
organs at risk and osseous structures. The PTV2 was gener-
ated automatically by adding a 0.5 cm margin to the CTV2
and excluding CTV1.
A constant margin of 5 mm was added circumferentially
around the PTV's to account for the penumbra of the radi-
ation beams in 3D-CRT plans
Dose prescription and treatment planning
For IMRT we used an integrated boost technique. The total
dose was 72 Gy, prescribed to the ICRU Reference Point
[23,24], resulting in daily fractions of 2.4 Gy for PTV1. A
mean dose of 60 Gy was recommended for PTV2, result-
ing in daily fractions of 2 Gy.
For 3D-CRT we used a concomitant boost technique. The
total dose of 72 Gy was prescribed to the ICRU Reference
Point [23,24]. Dose calculations were separated in a dose
prescription of 60 Gy for PTV1 and PTV2, and a dose pre-
scription of 12 Gy for PTV1 alone, resulting in equal daily
fractions of 2.4 Gy for PTV1 and 2 Gy for PTV2, compared
to the integrated boost IMRT technique. Normal tissue
dose constraints were 50 Gy (maximum point dose) for
chiasm and optic nerves and 50 - 54 Gy for the brainstem.
Table 1: Dose constraint values, setted initially for PTV's and
OAR's
Region of Interest Type Target Gy % Volume
PTV1 max. dose 77.04 -
uniform dose 72.00 -
min DVH 68.40 95
PTV2 uniform dose 60.00 -
max. dose 72.00 -
max. DVH 67.50 5
max. DVH 64.20 15
max. DVH 63.00 25
Brain max. DVH 25.00 40
max. DVH 40.00 20
Brainstem max. Dose 54.00 -
max. DVH 50.00 30
Chiasma max. dose 50.00
Optic nerves max. dose 50.00
lenses max. dose 5.00
Radiation Oncology 2009, 4:57 />Page 4 of 12
(page number not for citation purposes)
In table 1 the IMRT dose constraint values, setted initially
for PTV's and OAR's, are shown.
In all patients the OAR's were outside the PTV's. Despite a
hypofractionated setting with single doses in PTV1 by 2.4
Gy the single doses in the OAR's were maximally 2 Gy,
corresponding to a conventionally fractionation. So, from
a radiobiologically point of view, the established con-
straints for the OAR's could be taken. The data for normal
tissue complication probabilities are those described by
Emami [25].
Plans were acceptable for both techniques when the given
normal tissue constraints were fulfilled while the mean
dose to PTV2 was 60 Gy.
For IMRT we used a step-and-shoot technique and 6-15
MeV photons for an Elekta Precise
©
linear accelerator
(multileaf collimator with leaves projecting to 1 cm at iso-
center). The direct machine parameter optimization
(DMPO, Pinnacle
©
v8.0 m) algorithm was applied for
inverse planning with a 2 cm
2
minimum segment area,
five minimum segment monitor units and a maximum
number of 100 segments. The dose grid size includes the
PTV's, organs at risk and scalp and additionally 1-4 cm tis-
sue in all directions. The beam arrangements were deter-
mined by the size and location of the tumor and the
corresponding PTV's. No restrictions were given for the
number of beams or angles or whether noncoplanar
beams could be used. For 3D-CRT we used 2-6 beams to
cover PTV1 and also PTV2 (table 2).
Plan comparison
Treatment plan intercomparisons were performed using
the following criteria: mean, minimum and maximum
doses, Inhomogeneity Index (II), Conformity Index (CI)
and Equivalent Uniform Dose (EUD)
Inhomogeneity Index (II) and Conformity Index (CI)
Two indices served to characterize homogeneity and con-
formity:
ؠ Inhomogeneity Index [26] II = (D
max
- D
min
)/D
mean
D
max
: maximum PTV dose; D
min
: minimum PTV dose;
D
mean
: mean PTV dose;
ؠ Conformity Index [27] CI = PTV
PIV
2
/PTV * PIV
PTV
PIV
: PTV volume covered by 95% of the prescrip-
tion dose; PIV: total volume covered by 95% of the
prescription dose.
EUD (Equivalent Uniform Dose)
The EUD, defined as the biologically equivalent dose that,
if given uniformly, will lead to the same effect in the
tumor volume or the normal tissues as the actual nonuni-
form dose distribution, could be, based on Niemierko
[28,29], defined as:
N: number of voxels in the anatomic structure of interest;
d
i
: dose in the i'th voxel; a: tumor or tissue-specific param-
eter that describes the dose volume effect.
In Pinnacle
3
IMRT, which is used for EUD-calculation, the
equation is slightly modified to allow voxels to be only
partially included in a region of interest [30] as:
v: fraction of the region of interest that is occupied by
voxel "i".
In this analysis the tumor or tissue-specific parameter "a",
that describes the dose volume effect, was taken, based on
Burman, as follows: a = -10 for malignant glioma, a = 4 for
brain, a = 6.25 for brain stem, a = 4 for chiasm and optic
nerves [31-33].
Statistics
Statistical analysis was performed using the SPSS 17.0
(SPSS
®
, Chicago, Ill) software. The Wilcoxon's matched-
pair's test was applied to determine statistical differences
between the dose-volume-load calculated with the IB-
EUD =
⎛
⎝
⎜
⎜
⎞
⎠
⎟
⎟
=
∑
1
1
1
N
d
a
i
a
i
N
EUD =
⎛
⎝
⎜
⎜
⎞
⎠
⎟
⎟
=
∑
1
1
1
N
vd
a
ii
a
i
N
Table 2: Summerized plan information
mean (range)
IMRT 3D-CRT
Monitor Units (MU) 606 (483-845) 482 (256-804)
Beam Number 7 (5-9) 9 (4-12)*
Segments 91 (70-100) -
Wedge Number - 3 (0-5)
Beam energy (MeV) 6-15 6-15
(*summarized beam number for covering PTV1 and PTV2)
Radiation Oncology 2009, 4:57 />Page 5 of 12
(page number not for citation purposes)
IMRT- versus 3D-CRT-plans and also to determine statis-
tical differences between mean doses and EUD's in the
IMRT- and 3D-CRT-plans. Values are expressed as mean ±
standard deviation or as mean value and the range of the
values. All p-values reported are two-sided and p < 0.05 is
considered significant.
Results
Target subvolume number and shape
After the described auto-contouring process, based on
FET-PET data for PTV1 most patients revealed a complex
shape together with multiple subvolumes. Looking on the
number of these subvolumes only in 4 patients a sole sub-
volume was defined, while in 5 and 6 patients 2 and 3
subvolumes appeared, respectively. In one patient a total
of 4 subvolumes resulted from the auto-contouring proc-
ess. In respectively 2, 8 and 6 patients the automatically
generated PTV1 had a convex, concave and complex shape
(table 3).
Based on the described dose prescription of 72 Gy as point
dose to PTV1, patients with a single subvolume (n = 4)
had a mean dose of 70.6 (69.2-71.5) Gy to PTV1. In
patients with 3 (n = 6) or 4 (n = 1) subvolumes the mean
dose decreased to 67.6 (66.0-68.5) Gy. According to the
complexity in the shape of the target volumes an equal
decrease of mean dose for PTV1 was observed. For convex
shaped PTV1 a mean dose of 71.28 (66.11-73.07) Gy
resulted, while in patients with a complex shape the mean
dose decreased to 67.70 (59.72-72.99) Gy (table 4, 5).
Inhomogeneity and conformity
Using the inverse planning technique for IB-IMRT the
dose inhomogeneity within PTV1 (HI: 0.17 vs. 0.24, p =
0.02) and within PTV2 (HI: 0.34 vs. 0.54, p < 0.01)
decreased significantly, compared to 3D-CRT.
The dose conformity for PTV1 (CI: 0.35 vs. 0.14, p <
0.01)and for PTV2 (CI: 0.64 vs. 0.5, p < 0.01) was signifi-
cantly improved with IB-IMRT (table 6).
Mean dose, minimum and maximum dose
The averaged mean dose for PTV2 was slightly, but signif-
icantly lower (60.68 ± 0.63 Gy vs. 61.00 ± 0.78 Gy, p =
0.03) after inverse treatment planning with IB-IMRT. For
PTV1 the mean dose did not differ significantly (68.76 ±
1.88 Gy vs. 64.40 ± 2.79 Gy, p = 0.61). The minimum
dose within PTV1 (61.1 Gy vs. 57.4 Gy, p = 0.02) and
within PTV2 (51.4 Gy vs. 40.9 Gy, p < 0.01) increased
highly significant after inverse treatment planning. Look-
ing on the dose-volume-load to critical organs only the
mean dose to the brain increased significantly (25.6 Gy vs.
22.9 Gy, p < 0.01) (table 7).
EUD
The averaged mean EUD for PTV2 was significantly
improved (59.92 ± 0.95 Gy vs. 55.3 ± 4.33 Gy, p < 0.01)
if planned with IB-IMRT vs. 3D-CRT. In addition the EUD
for PTV1 was slightly improved (68.3 ± 1.93 Gy vs. 67.3 ±
2.85 Gy, p = 0.2) after IB-IMRT. The EUD for the brain was
equal with both two planning techniques (41.7 ± 3.12 Gy
vs. 41.6 ± 2.16 Gy) (s. table 8).
Table 3: Target volume characteristics
Target volumes PTV1 (= CTV1 *) 12.1 ± 18.6 ccm
PTV2 175.2 ± 54.4 ccm
PTV1 subvolume number patient number
14
25
36
41
PTV1 geometry
single form and/or subvolume configuration
convex 2
concave 8
complex 6
Tumor/Brain ratio
(in PTV1)
Mean 2.1 (1.7-2.9)
max 3.3 (2.0-4.9)
(* CTV1 is equal to PTV1, s. Target volume definition)
Radiation Oncology 2009, 4:57 />Page 6 of 12
(page number not for citation purposes)
Discussion
In malignant gliomas distant tumor spread is rare and
more than 80% of recurrences were found within a rim of
2-3 cm around the initial tumor site [34,35]. Therefore, it
seems promising to escalate the radiation dose. In the
past, several authors reported improved survival data
from non-randomized, retrospective dose escalation trials
[10,36,37]. These data should be interpreted cautiously
because of a potential bias from patient selection [38-40].
In a RTOG multicenter phase-I-trial (RTOG 98-03) dose
escalation was conducted using 3D-conformal irradiation
[41]. In this trial a four step dose escalation strategy from
66 to 84 Gy was applied and median survival increased
from 11.6 to 19.3 months in patients with a boost target
volume smaller than 75 ccm. However, with boost target
volumes ≥ 75 ccm the improvement was markedly smaller
(8.2 vs. 13.9 months). No benefit was seen in progression
free survival.
None of the randomized trials could demonstrate an
improvement in median survival after locally restricted
dose escalation. Souhami used a stereotactic boost tech-
nique [11], Laperriere [42] and Selker [43] used brachy-
therapy in addition to external beam radiotherapy with 60
Gy. Souhami addressed, that the results from the RTOG
93-05 trial were not completely surprising, because gliob-
lastomas are inherently infiltrating neoplasms. Consider-
ing that delineation of tumor volumes in treatment
planning was based on morphological imaging, they dis-
cussed, that "biopsy and magnetic resonance spectroscopy
analyses have demonstrated significant microscopic
tumor extension beyond the contrast-enhancing lesion,
thereby limiting the effectiveness of focal radiotherapy".
MRI is highly sensitive in detecting brain tissue abnormal-
ities. In a biopsy-controlled trial Pauleit obtained a 96%
sensitivity to detect glioma tissue [15]. But the specificity
was only 53%. Better tumor brain delineation became
possible with the use of PET (Positron-Emission-Tomog-
raphy) imaging with radio-labeled amino acids, like O-(2-
F-18-Fluorethyl)-L-Tyrosin (FET) [18]. The use of FET-PET
in addition to MRI yields a sensitivity of 93%, similar to
MRI alone, but a markedly improved specificity of 94%
[15].
Therefore, it is straightforward to integrate FET-PET imag-
ing in dose escalation irradiation strategies. Several
authors could already demonstrate the feasibility of this
approach and mentioned the estimated positive impact
[44-46]. The process of automatic delineation of the PET-
positive area as biological target volume, done in our
planning study, prevents the known problem of interob-
server variations [47] but leads to a pronounced irregular-
ity in target volume shape. After auto-contouring the PET-
positive areas in our study with a cut-off value of 1.6,
37.5% of the patients revealed a very complex target
shape, comprising multiple separate sub volumes, half of
them cuttlefish-like shaped and mostly arranged around
the surgical cave.
Irradiation with intensity-modulated dose application led
to an improvement in target coverage compared with 3D-
CRT in different tumor entities, i.e. head and neck [48],
lung [49], breast [50], prostate [32,51,52] or other [53].
For radiotherapy of glioblastomas the feasibility and effi-
cacy of IMRT planning with a simultaneous boost could
be shown by Chan et al. [54]. Narayana et al. found no
Table 4: Mean, min. and max. dose (IMRT) in correlation to the
subvolume-number in PTV1
IMRT
number of subvolumes n dose SD
PTV 1 overall 16 mean 68.76 ± 1.88
min 61.07 ± 3.31
max 73.14 ± 0.98
14mean 70.60 ± 1.01
min 63.61 ± 3.84
max 73.56 ± 0.93
25mean 68.50 ± 1.91
min 60.54 ± 3.47
max 73.72 ± 1.13
3/4 7 mean 67.56 ± 0.94
min 59.99 ± 2.46
max 71.94 ± 1.32
Table 5: Mean, min. and max. (IMRT) in correlation to the PTV1-
configuration
IMRT
PTV1-configuration n dose (SD)
PTV 1 overall 16 mean 68.76 ± 1.88
min 61.07 ± 3.31
max 73.14 ± 0.98
Convex 2 mean 71.28 ± 0.35
min 66.11 ± 3.56
max 73.05 ± 0.72
Concave 8 mean 68.66 ± 1.79
min 60.82 ± 3.31
max 72.81 ± 1.85
complex 6 mean 67.70 ± 0.98
min 59.72 ± 1.58
max 72.99 ± 1.03
Radiation Oncology 2009, 4:57 />Page 7 of 12
(page number not for citation purposes)
improvement in target coverage using IMRT in high-grade
gliomas in comparison with 3D-CRT. Nevertheless, the
normal brain, which received a dose of ≥ 18 and ≥ 24 Gy
as well as the mean dose to the brainstem could be
reduced with IMRT [55]. In contrast, MacDonald demon-
strated in a similar analysis an improved target coverage
and also confirmed reduced radiation dose to the brain,
brainstem and optic chiasm [56]. Also Hermanto showed
an improved target conformity using an IMRT vs. 3D-CRT
planning for high-grade gliomas [57]. A locally restricted
integrated dose escalation was not considered in these
analyses.
In our setting, using an integrated complex boost volume
a significantly better conformity could be achieved with
IMRT for both planning target volumes, PTV1 (0.35 vs.
0.14; p < 0.01) and PTV2 (0.64 vs. 0.5, p < 0.01). The dose
inhomogeneities for PTV1 and PTV2 decreased signifi-
cantly with IMRT (table 6, figure 1a, b).
In addition to the prescribed dose within PTV1 a dose of
60 Gy as mean dose for PTV2 was required as equally
rated first level priority. In contrast to the ICRU 50/62
reports [23,24], which limits the recommended dose
range between 95 and 107% of the prescribed dose to
PTV2, a dose of 120% was accepted as essential default
value to achieve a point dose prescription of 72 Gy within
PTV1. To limit at least the integral dose to PTV2 a mean
dose of 60 Gy with a minimum dose of 95% - as second
level priority - was required for plan acceptance. The
resulting mean doses for PTV2 were acceptable for IB-
IMRT planning (60.68 Gy ± 0.63) and 3D-CRT planning
(61.00 Gy ± 0.78). Using a prescription dose of 72 Gy as
point dose to PTV1, the mean dose to PTV1 was less than
the prescribed dose in all patients. After 3D-CRT planning
a mean dose of 64.4 ± 2.79 Gy could be obtained and after
IMRT planning the mean dose averaged over all patients
was 68.76 ± 1.88 Gy to PTV1 (table 7).
Using an integrated boost technique for patients with
high-grade gliomas, Thilmann could deliver an escalated
mean dose of 75 Gy to the enhancing lesion in MRI
(PTV1) and a mean dose of 60 Gy to the surrounding clin-
ical risk area (PTV2) [58]. The authors allowed a dose
delivery of more than 107% of the prescribed dose to
13.9% of the PTV2 volume. The maximum dose con-
straints for chiasm and optic nerves (52 Gy) were slightly
increased compared to our study. A marked difference to
our study was the MRI based delineation of PTV1, result-
ing in convex shaped singular target volumes. The shape
and number of subvolumes of auto-contoured target vol-
umes in our study was markedly more complex and had
an impact on the mean dose value for PTV1 (tables 4 and
5, figures 2a, b, 3a, b, 4a, b). In patients with a singular
PTV1 (n = 4) a mean dose of 70.6 Gy was achievable. But
in patients with 3 and 4 subvolumes of PTV1 the mean
dose decreased to 67.6 Gy.
Table 6: Inhomogeneity Index and Conformity Index for PTV1 and 2 in IMRT versus 3D-CRT
Inhomogeneity Index Conformity Index
IMRT 3D-CRT p IMRT 3D-CRT p
Mean SD mean SD mean SD mean SD
PTV1 0.17 ± 0.05 0.24 ± 0.12 0.02 0.35 ± 0.12 0.14 ± 0.1 <0.01
PTV2 0.34 ± 0.54 0.54 ± 0.13 <0.01 0.64 ± 0.07 0.50 ± 0.13 <0.01
Table 7: Mean, min., and max. doses for PTV's and OAR's in
IMRT versus 3D-CRT
IMRT 3D-CRT p
Dose SD dose SD
PTV 1 mean 68.76 ± 1.88 64.40 ± 2.79 0.61
min 61.07 ± 3.31 57.39 ± 6.79 0.02
max 73.14 ± 0.98 73.94 ± 1.88 0.1
PTV 2 mean 60.68 ± 0.63 61.00 ± 0.78 0.03
min 51.40 ± 3.44 40.89 ± 7.03 <0.01
max 71.90 ± 1.51 73.68 ± 2.64 0.01
Brain Mean 25.57 ± 3.24 22.90 ± 4.31 <0.01
Brainstem mean 13.76 ± 8.74 13.37 ± 9.25 0.79
max 37.04 ± 20.2 36.56 ± 20.15 0.77
Chiasm mean 18.51 ± 12.56 15.83 ± 13.33 0.14
max 28.16 ± 17.9 23.56 ± 16.84 0.07
Optic nerve rt. mean 8.48 ± 6.49 7.57 ± 8.66 0.64
max 15.2 ± 12.04 12.19 ± 12.43 0.14
Optic nerve lt. mean 13.02 ± 11.94 13.50 ± 14.33 0.79
max 18.99 ± 16.39 18.20 ± 17.69 0.69
Radiation Oncology 2009, 4:57 />Page 8 of 12
(page number not for citation purposes)
Table 8: Mean dose and EUD for PTV's and OAR's in IMRT versus 3D-CRT
Mean Dose EUD
IMRT 3D-CRT p IMRT 3D-CRT p
mean SD mean SD mean SD mean SD
PTV 1 68.76 ± 1.88 64.40 ± 2.79 0.61 68.34 ± 1.93 67.29 ± 2.85 0.2
PTV 2 60.68 ± 0.63 61.00 ± 0.78 0.03 59.92 ± 0.95 55.30 ± 4.33 <0.01
Brain 25.57 ± 3.24 22.90 ± 4.31 <0.01 41.57 ± 2.16 41.73 ± 3.12 0.69
Brainstem 13.76 ± 8.74 13.37 ± 9.25 0.79 21.83 ± 11.91 22.49 ± 12.94 0.48
Chiasm 18.51 ± 12.56 15.83 ± 13.33 0.14 19.64 ± 13.2 16.95 ± 13.71 0.12
Optic nerve rt. 8.48 ± 6.49 7.57 ± 8.66 0.64 10.2 ± 7.76 8.81 ± 9.49 0.41
Optic nerve lt. 13.02 ± 16.94 13.50 ± 14.33 0.79 14.07 ± 12.74 14.57 ± 14.65 0.78
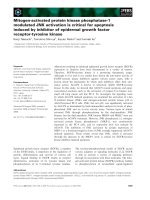
a) Isodose distribution (dose wash) for IMRT and 3D-CRT-planningFigure 1
a) Isodose distribution (dose wash) for IMRT and 3D-
CRT-planning. b) Dose-volume-histograms for IMRT
and 3D-CRT in comparison (IMRT: aligned, 3D- CRT:
dashed).
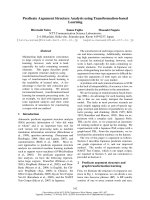
a) Dose wash for IMRTFigure 2
a) Dose wash for IMRT. Explanation of a convex configu-
ration of PTV1 (one FET- subvolume) with a mean dose of
70.5 Gy. b) Dose-volume-histogram (IMRT) for a convex
configuration of PTV1 (one FET-subvolume) with a mean
dose of 70.5 Gy.
Radiation Oncology 2009, 4:57 />Page 9 of 12
(page number not for citation purposes)
The averaged minimum dose to PTV2 after 3D-CRT plan-
ning was 40.9 Gy (68% of the required dose) and thus not
acceptable for most of the patients. After IB-IMRT plan-
ning the mean minimum dose to PTV2 increased to 51.4
Gy (86% of the required dose). The minimum dose was
located 1.5-2 cm distant to the contrast-enhanced area in
MRI and thus acceptable for treatment [41,59]. According
to Tome and Fowler a minimum dose or "cold dose"
lower than the prescribed dose by substantially more than
10% can be detrimental in tumor control [60]. In addi-
tion, Niemierko emphasized, that a "cold spot" cannot be
compensated by any dose delivered to the rest of the target
volume [28]. Unlike the mean dose, the equivalent uni-
form dose (EUD) concept includes the impact of dose
inhomogeneities and volumetric effect [61]. The EUD is
the homogeneous dose inside an organ that has the same
clinical effect as a given, arbitrary dose distribution [62].
The EUD concept allows reducing a complex three-dimen-
sional dose distribution into a single metric value [33,62].
Niemierko pointed out, that for relatively small dose
inhomogeneities the mean dose might be a good approx-
imation to EUD [28]. Furthermore, the authors explained
that the minimum target dose can significantly underesti-
mate the dose actually delivered, if the cold spot is very
small. Considering the EUD concept, marked differences
were evident in our study for PTV2. The EUD for PTV2
after 3D-CRT was significantly lower (55.3 Gy and 59.92
Gy, p < 0.01), while for PTV1 no significant difference was
obtained.
For the OAR's only the EUD values for the brainstem dif-
fered significantly (25.6 Gy IB-IMRT; 22.9 Gy 3D-CRT, p
< 0.01) (table 8). In contrast to the increase in mean dose,
the EUD values for the brain were not significantly differ-
ent (41.6 Gy for IB-IMRT and 41.7 Gy for 3D-CRT (p =
0.7)).
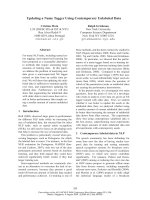
a) Isodose distribution (dose wash) for IMRTFigure 4
a) Isodose distribution (dose wash) for IMRT. Explana-
tion of a complex. configuration of PTV1 (with 2 FET-subvol-
umes) with a mean dose of 67.2 Gy. b) Dose-volume-
histogram (IMRT) for a complex configuration of
PTV1 (with 2 FET-subvolumes) with a mean dose of
67.2 Gy.
a) Isodose distribution (dose wash) for IMRTFigure 3
a) Isodose distribution (dose wash) for IMRT. Explana-
tion of a concave configurationof PTV1 (3 FET-subvolumes)
with a mean dose of 68.0 Gy. b)Dose-volume-histogram
(IMRT) for a concave configuration of PTV1 (3 FET-
subvolumes) with a mean dose of 68.0 Gy.
Radiation Oncology 2009, 4:57 />Page 10 of 12
(page number not for citation purposes)
Conclusion
Auto-contouring of the integrated boost volume resulted
in complex target volume shapes. With the given con-
straints, the dose prescription to PTV1 (72 Gy), combined
with a limited mean dose to PTV2 (60 Gy) could be
achieved. Nevertheless a mean dose of 72 Gy to PTV1
could not be realized, neither with 3D-CRT nor with the
IB-IMRT. Comparing both techniques, IB-IMRT provided
several improvements. IB-IMRT led to a significantly bet-
ter homogeneity and conformity, compared to 3D-CRT.
The mean dose and the EUD values for PTV2 were inac-
ceptable low with 3D-CRT, which would decrease tumor
control. The EUD concept seems to be very useful for
inverse planning, because the complex dose distribution
can be reduced to one single parameter and also volume
parameters and biological effects are taken into account.
Further plan comparisons are simplified. The prognostic
impact of this technique based on MR- and FET-PET imag-
ing for patients with glioblastomas will be evaluated in an
ongoing prospective phase-II trial in our clinic.
Competing interests
The authors declare that they have no competing interests.
Authors' contributions
MDP has made substantial contributions to the concep-
tion, acquisition of data, analysis and interpretation of
data and drafted the manuscript. MP has been involved in
acquisition of data and revised the manuscript. RH has
been involved in acquisition of data and revised the man-
uscript. GS has been involved in acquisition of data and
revised the manuscript. CD has been involved in acquisi-
tion of data and revised the manuscript. CA has been
involved in acquisition of data and revised the manu-
script. HJK has been involved in acquisition of data and
revised the manuscript. KJL has made substantial contri-
butions to the conception, acquisition of data, analysis
and interpretation of data and revised the manuscript.
MJE has made substantial contributions to the concep-
tion, acquisition of data, analysis and interpretation of
data and revised the manuscript.
Acknowledgements
We would like to thank the staff who took care of our patients' needs, and
who were involved in gathering, documenting, verifying, forwarding and
processing the clinical data.
References
1. Stupp R, Mason WP, Bent MJ van den, Weller M, Fisher B, Taphoorn
MJ, et al.: Radiotherapy plus concomitant and adjuvant temo-
zolomide for glioblastoma. N Engl J Med 2005, 352(10):987-996.
2. Stupp R, Hegi ME, Mason WP, Bent MJ van den, Taphoorn MJ, Janzer
RC, et al.: Effects of radiotherapy with concomitant and adju-
vant temozolomide versus radiotherapy alone on survival in
glioblastoma in a randomised phase III study: 5-year analysis
of the EORTC-NCIC trial. Lancet Oncol 2009, 10(5):459-466.
3. Bleehen NM, Stenning SP: A Medical Research Council trial of
two radiotherapy doses in the treatment of grades 3 and 4
astrocytoma. The Medical Research Council Brain Tumour
Working Party. Br J Cancer 1991, 64(4):769-774.
4. Walker MD, Strike TA, Sheline GE: An analysis of dose-effect
relationship in the radiotherapy of malignant gliomas. Int J
Radiat Oncol Biol Phys 1979, 5(10):1725-1731.
5. Taghian A, Ramsay J, Allalunis-Turner J, Budach W, Gioioso D, Pardo
F, et al.: Intrinsic radiation sensitivity may not be the major
determinant of the poor clinical outcome of glioblastoma
multiforme. Int J Radiat Oncol Biol Phys 1993, 25(2):243-249.
6. Taghian A, DuBois W, Budach W, Baumann M, Freeman J, Suit H: In
vivo radiation sensitivity of glioblastoma multiforme. Int J
Radiat Oncol Biol Phys 1995, 32(1):99-104.
7. Taghian A, Suit H, Baumann M: In vitro and in vivo radiation sen-
sitivity of glioblastoma multiforme: correction. Int J Radiat
Oncol Biol Phys 1996, 35(5):1124-1125.
8. Taghian A: In vitro and in vivo radiation sensitivity of glioblas-
toma multiforme: correction. Int J Radiat Oncol Biol Phys 1998,
42(2):464.
9. Loeffler JS, Alexander E III, Shea WM, Wen PY, Fine HA, Kooy HM,
et al.: Radiosurgery as part of the initial management of
patients with malignant gliomas. J Clin Oncol
1992,
10(9):1379-1385.
10. Sarkaria JN, Mehta MP, Loeffler JS, Buatti JM, Chappell RJ, Levin AB,
et al.: Radiosurgery in the initial management of malignant
gliomas: survival comparison with the RTOG recursive par-
titioning analysis. Radiation Therapy Oncology Group. Int J
Radiat Oncol Biol Phys 1995, 32(4):931-941.
11. Souhami L, Seiferheld W, Brachman D, Podgorsak EB, Werner-Wasik
M, Lustig R, et al.: Randomized comparison of stereotactic radi-
osurgery followed by conventional radiotherapy with car-
mustine to conventional radiotherapy with carmustine for
patients with glioblastoma multiforme: report of Radiation
Therapy Oncology Group 93-05 protocol. Int J Radiat Oncol Biol
Phys 2004, 60(3):853-860.
12. Grosu AL, Weber WA, Franz M, Stark S, Piert M, Thamm R, et al.:
Reirradiation of recurrent high-grade gliomas using amino
acid PET (SPECT)/CT/MRI image fusion to determine gross
tumor volume for stereotactic fractionated radiotherapy. Int
J Radiat Oncol Biol Phys 2005, 63(2):511-519.
13. Lee IH, Piert M, Gomez-Hassan D, Junck L, Rogers L, Hayman J, et al.:
Association of 11C-methionine PET uptake with site of fail-
ure after concurrent temozolomide and radiation for pri-
mary glioblastoma multiforme. Int J Radiat Oncol Biol Phys 2009,
73(2):479-485.
14. Ogawa T, Shishido F, Kanno I, Inugami A, Fujita H, Murakami M, et al.:
Cerebral glioma: evaluation with methionine PET. Radiology
1993, 186(1):45-53.
15. Pauleit D, Floeth F, Hamacher K, Riemenschneider MJ, Reifenberger
G, Muller HW, et al.: O-(2-[18F]fluoroethyl)-L-tyrosine PET
combined with MRI improves the diagnostic assessment of
cerebral gliomas. Brain 2005, 128(Pt 3):678-687.
16. Rachinger W, Goetz C, Popperl G, Gildehaus FJ, Kreth FW, Holt-
mannspotter M, et al.: Positron emission tomography with O-
(2-[18F]fluoroethyl)-l-tyrosine versus magnetic resonance
imaging in the diagnosis of recurrent gliomas. Neurosurgery
2005, 57(3):505-511.
17. Fuss M, Salter BJ, Rassiah P, Cheek D, Cavanaugh SX, Herman TS:
Repositioning accuracy of a commercially available double-
vacuum whole body immobilization system for stereotactic
body radiation therapy. Technol Cancer Res Treat 2004,
3(1):59-67.
18. Langen KJ, Hamacher K, Weckesser M, Floeth F, Stoffels G, Bauer D,
et al.: O-(2-[18F]fluoroethyl)-L-tyrosine: uptake mechanisms
and clinical applications. Nucl Med Biol 2006, 33(3):287-294.
19. Roesch P, Netsch T, McNutt T, Shoenbill J, Roost P: Syntegra -
Automated image registration algorithms. Philips White Paper
2003.
20. Weckesser M, Griessmeier M, Schmidt D, Sonnenberg F, Ziemons K,
Kemna L, et al.: Iodine-123 alpha-methyl tyrosine single-pho-
ton emission tomography of cerebral gliomas: standardised
evaluation of tumour uptake and extent. Eur J Nucl Med 1998,
25(2):150-156.
Radiation Oncology 2009, 4:57 />Page 11 of 12
(page number not for citation purposes)
21. Popperl G, Gotz C, Rachinger W, Gildehaus FJ, Tonn JC, Tatsch K:
Value of O-(2-[18F]fluoroethyl)- L-tyrosine PET for the diag-
nosis of recurrent glioma. Eur J Nucl Med Mol Imaging 2004,
31(11):1464-1470.
22. Weckesser M, Langen KJ, Rickert CH, Kloska S, Straeter R,
Hamacher K, et al.: O-(2-[18F]fluorethyl)-L-tyrosine PET in the
clinical evaluation of primary brain tumours. Eur J Nucl Med
Mol Imaging 2005, 32(4):422-429.
23. Prescribing, Recording and Reporting Photon Beam Ther-
apy. Journal of the International Commission on Radiation Units and
Measurements 1993. Report 50
24. Prescribing, Recording and Reporting Photon Beam Ther-
apy (Supplement to ICRU 50 Report). Journal of the International
Commission on Radiation Units and Measurements 1999. Report 62
25. Emami B, Lyman J, Brown A, Coia L, Goitein M, Munzenrider JE, et al.:
Tolerance of normal tissue to therapeutic irradiation. Int J
Radiat Oncol Biol Phys 1991, 21(1):109-122.
26. Tome WA, Meeks SL, Buatti JM, Bova FJ, Friedman WA, Li Z: A high-
precision system for conformal intracranial radiotherapy. Int
J Radiat Oncol Biol Phys 2000, 47(4):1137-1143.
27. Paddick I: A simple scoring ratio to index the conformity of
radiosurgical treatment plans. Technical note. J Neurosurg
2000, 3:219-222.
28. Niemierko A: Reporting and analyzing dose distributions: a
concept of equivalent uniform dose. Med Phys 1997,
24(1):103-110.
29. Niemierko A: Radiobiological models of tissue response to
radiation in treatment planning systems. Tumori 1998,
84(2):140-143.
30. RaySearch Laboratories AB SS: Biological optimization using the
equivalent uniform dose (EUD) in Pinnacle
3
. RaySearch White
Paper 2003. WP-EUD rev.1, 0310
31. Burman C, Kutcher GJ, Emami B, Goitein M: Fitting of normal tis-
sue tolerance data to an analytic function. Int J Radiat Oncol Biol
Phys 1991, 21(1):123-135.
32. Luxton G, Keall PJ, King CR: A new formula for normal tissue
complication probability (NTCP) as a function of equivalent
uniform dose (EUD). Phys Med Biol 2008, 53(1):23-36.
33. Semenenko VA, Reitz B, Day E, Qi XS, Miften M, Li XA: Evaluation
of a commercial biologically based IMRT treatment planning
system. Med Phys 2008, 35(12):5851-5860.
34. Hochberg FH, Pruitt A: Assumptions in the radiotherapy of
glioblastoma. Neurology 1980, 30(9):907-911.
35. Jansen EP, Dewit LG, van HM, Bartelink H: Target volumes in radi-
otherapy for high-grade malignant glioma of the brain. Radi-
other Oncol 2000, 56(2):151-156.
36. Shrieve DC, Alexander E III, Black PM, Wen PY, Fine HA, Kooy HM,
et al.: Treatment of patients with primary glioblastoma mul-
tiforme with standard postoperative radiotherapy and radi-
osurgical boost: prognostic factors and long-term outcome.
J Neurosurg 1999, 90(1):72-77.
37. Tanaka M, Ino Y, Nakagawa K, Tago M, Todo T: High-dose confor-
mal radiotherapy for supratentorial malignant glioma: a his-
torical comparison. Lancet Oncol 2005, 6(12):953-960.
38. Irish WD, Macdonald DR, Cairncross JG: Measuring bias in uncon-
trolled brain tumor trials to randomize or not to rand-
omize? Can J Neurol Sci 1997, 24(4):307-312.
39. Litofsky NS, Bauer AM, Kasper RS, Sullivan CM, Dabbous OH:
Image-guided resection of high-grade glioma: patient selec-
tion factors and outcome. Neurosurg Focus 2006, 20(4):E16.
40. Winger MJ, Macdonald DR, Schold SC Jr, Cairncross JG: Selection
bias in clinical trials of anaplastic glioma.
Ann Neurol 1989,
26(4):531-534.
41. Tsien C, Moughan J, Michalski JM, Gilbert MR, Purdy J, Simpson J, et
al.: Phase I three-dimensional conformal radiation dose esca-
lation study in newly diagnosed glioblastoma: Radiation
Therapy Oncology Group Trial 98-03. Int J Radiat Oncol Biol Phys
2009, 73(3):699-708.
42. Laperriere NJ, Leung PM, McKenzie S, Milosevic M, Wong S, Glen J,
et al.: Randomized study of brachytherapy in the initial man-
agement of patients with malignant astrocytoma. Int J Radiat
Oncol Biol Phys 1998, 41(5):1005-1011.
43. Selker RG, Shapiro WR, Burger P, Blackwood MS, Arena VC, Gilder
JC, et al.: The Brain Tumor Cooperative Group NIH Trial 87-
01: a randomized comparison of surgery, external radiother-
apy, and carmustine versus surgery, interstitial radiotherapy
boost, external radiation therapy, and carmustine. Neurosur-
gery 2002, 51(2):343-355.
44. Rickhey M, Koelbl O, Eilles C, Bogner L: A biologically adapted
dose-escalation approach, demonstrated for 18F-FET-PET
in brain tumors. Strahlenther Onkol 2008, 184(10):536-542.
45. Vees H, Senthamizhchelvan S, Miralbell R, Weber DC, Ratib O, Zaidi
H: Assessment of various strategies for 18F-FET PET-guided
delineation of target volumes in high-grade glioma patients.
Eur J Nucl Med Mol Imaging 2009, 36(2):182-193.
46. Weber DC, Zilli T, Buchegger F, Casanova N, Haller G, Rouzaud M,
et al.: [(18)F]Fluoroethyltyrosine- positron emission tomog-
raphy-guided radiotherapy for high-grade glioma. Radiat
Oncol 2008, 3:44.
47. Weltens C, Menten J, Feron M, Bellon E, Demaerel P, Maes F, et al.:
Interobserver variations in gross tumor volume delineation
of brain tumors on computed tomography and impact of
magnetic resonance imaging. Radiother Oncol 2001, 60(1):49-59.
48. Cozzi L, Fogliata A, Bolsi A, Nicolini G, Bernier J: Three-dimen-
sional conformal vs. intensity-modulated radiotherapy in
head-and-neck cancer patients: comparative analysis of dosi-
metric and technical parameters. Int J Radiat Oncol Biol Phys
2004, 58(2):617-624.
49. Grills IS, Yan D, Martinez AA, Vicini FA, Wong JW, Kestin LL: Poten-
tial for reduced toxicity and dose escalation in the treatment
of inoperable non-small-cell lung cancer: a comparison of
intensity-modulated radiation therapy (IMRT), 3D confor-
mal radiation, and elective nodal irradiation. Int J Radiat Oncol
Biol Phys 2003, 57(3):875-890.
50. Selvaraj RN, Beriwal S, Pourarian RJ, Lalonde RJ, Chen A, Mehta K, et
al.: Clinical implementation of tangential field intensity mod-
ulated radiation therapy (IMRT) using sliding window tech-
nique and dosimetric comparison with 3D conformal
therapy (3DCRT) in breast cancer. Med Dosim 2007,
32(4):299-304.
51. Pinkawa M, Siluschek J, Gagel B, Piroth MD, Demirel C, Asadpour B,
et al.: Postoperative radiotherapy for prostate cancer: evalu-
ation of target motion and treatment techniques (intensity-
modulated versus conformal radiotherapy). Strahlenther Onkol
2007, 183(1):23-29.
52. Pinkawa M, Attieh C, Piroth MD, Holy R, Nussen S, Klotz J, et al.:
Dose-escalation using intensity-modulated radiotherapy for
prostate cancer evaluation of the dose distribution with and
without 18F-choline PET-CT detected simultaneous inte-
grated boost. Radiother Oncol 2009, 93(2):213-219.
53. Pirzkall A, Carol M, Lohr F, Hoss A, Wannenmacher M, Debus J:
Comparison of intensity-modulated radiotherapy with con-
ventional conformal radiotherapy for complex-shaped
tumors. Int J Radiat Oncol Biol Phys 2000, 48(5):1371-1380.
54. Chan MF, Schupak K, Burman C, Chui CS, Ling CC: Comparison of
intensity-modulated radiotherapy with three-dimensional
conformal radiation therapy planning for glioblastoma mul-
tiforme. Med Dosim 2003, 28(4):261-265.
55. Narayana A, Yamada J, Berry S, Shah P, Hunt M, Gutin PH, et al.:
Intensity-modulated radiotherapy in high-grade gliomas:
clinical and dosimetric results. Int J Radiat Oncol Biol Phys 2006,
64(3):892-897.
56. MacDonald SM, Ahmad S, Kachris S, Vogds BJ, DeRouen M, Gittleman
AE, et al.: Intensity modulated radiation therapy versus three-
dimensional conformal radiation therapy for the treatment
of high grade glioma: a dosimetric comparison. J Appl Clin Med
Phys 2007, 8(2):47-60.
57. Hermanto U, Frija EK, Lii MJ, Chang EL, Mahajan A, Woo SY: Inten-
sity-modulated radiotherapy (IMRT) and conventional
three-dimensional conformal radiotherapy for high-grade
gliomas: does IMRT increase the integral dose to normal
brain? Int J Radiat Oncol Biol Phys 2007, 67(4):1135-1144.
58. Thilmann C, Zabel A, Grosser KH, Hoess A, Wannenmacher M,
Debus J: Intensity-modulated radiotherapy with an integrated
boost to the macroscopic tumor volume in the treatment of
high-grade gliomas. Int J Cancer 2001, 96(6):341-349.
59. Chang EL, Akyurek S, Avalos T, Rebueno N, Spicer C, Garcia J, et al.:
Evaluation of peritumoral edema in the delineation of radio-
Publish with BioMed Central and every
scientist can read your work free of charge
"BioMed Central will be the most significant development for
disseminating the results of biomedical research in our lifetime."
Sir Paul Nurse, Cancer Research UK
Your research papers will be:
available free of charge to the entire biomedical community
peer reviewed and published immediately upon acceptance
cited in PubMed and archived on PubMed Central
yours — you keep the copyright
Submit your manuscript here:
/>BioMedcentral
Radiation Oncology 2009, 4:57 />Page 12 of 12
(page number not for citation purposes)
therapy clinical target volumes for glioblastoma. Int J Radiat
Oncol Biol Phys 2007, 68(1):144-150.
60. Tome WA, Fowler JF: On cold spots in tumor subvolumes. Med
Phys 2002, 29(7):1590-1598.
61. Qi XS, Schultz CJ, Li XA: An estimation of radiobiologic param-
eters from clinical outcomes for radiation treatment plan-
ning of brain tumor. Int J Radiat Oncol Biol Phys 2006,
64(5):1570-1580.
62. Thieke C, Bortfeld T, Niemierko A, Nill S: From physical dose
constraints to equivalent uniform dose constraints in inverse
radiotherapy planning. Med Phys 2003, 30(9):2332-2339.