Báo cáo khoa học: " Comparison of T2 and FLAIR imaging for target delineation in high grade gliomas" pptx
Bạn đang xem bản rút gọn của tài liệu. Xem và tải ngay bản đầy đủ của tài liệu tại đây (579.73 KB, 7 trang )
RESEARC H Open Access
Comparison of T2 and FLAIR imaging for target
delineation in high grade gliomas
Bronwyn Stall
†
, Leor Zach
†
, Holly Ning, John Ondos, Barbara Arora, Uma Shankavaram, Robert W Miller,
Deborah Citrin, Kevin Camphausen
*
Abstract
Background: FLAIR and T2 weighted MRIs are used based on institutional preference to delineate high grade
gliomas and surrounding edema for radiation treatment planning. Although these sequences have inhere nt
physical differences there is limited data on the clinical and dosimetric imp act of using eithe r or both
sequences.
Methods: 40 patients with high grade gliomas consecutively treated between 2002 and 2008 of which 32 had
pretreatment MRIs with T1, T2 and FLAIR available for review were selected for this study. These MRIs w ere
fused with the treatment planning CT. Normal structures, cl inical tumor volume (CTV) and planning tumor
volume (PTV) were then defined on the T2 and FLAIR sequences. A Venn diagram analysis was p erformed for
each pair of tumor volumes as well as a fractional component analysis to assess the contribution of each
sequence to the union volume. For each patient the tumor volumes were compared in terms of total volume in
cubic centimeters as well as anatomic location using a discordance index. The overlap of the tumor volumes
with critical structures was calculated as a measure of predicted toxicity. For patients with MRI documented
failures, the tumor volumes obtained using the different sequences were compared with the recurrent gross
tumor volume (rGTV).
Results: The FLAIR CTVs and PTVs were significantly larger than the T2 CTVs and PTVs (p < 0.0001 and p = 0.0001
respectively). Based on the discordance index, the abnormality identified using the different sequences also differed
in location. Fractional component analysis showed that the intersection of the tumor volumes as defined on both
T2 and FLAIR defined the majority of the union volume contributing 63.6% to the CTV union and 82.1% to the PTV
union. T2 alone uniquely identified 12.9% and 5.2% of the CTV and PTV unions respectively while FLAIR alone
uniquely identified 25.7% and 12% of the CTV and PTV unions respectively. There was no difference in predicted
toxicity to normal structures using T2 or FLAIR. At the time of analysis, 26 failures had occurred of which 19
patients had MRIs documenting the recurrence. The rGTV correlated best with the FLAIR CTV but the percentage
overlap was not significantly different from that with T2. There was no statistical difference in the percentage
overlap with the rGTV and the PTVs generated using either T2 or FLAIR.
Conclusions: Although both T2 and FLAIR MRI sequences are used to define high grade glial neoplasm and
surrounding edema, our results show that the volumes generated using these techniques are different and not
interchangeable. These differences have bearing on the use of intensity modulated radiation therapy (IMRT) and
highly conformal treatment as well as on future clinical trials where the bias of using one technique over the other
may influence the study outcome.
* Correspondence:
† Contributed equally
Radiation Oncology Branch, National Cancer Institute, 10 Center Drive,
Building 10, CRC, Rm B2-3561, Bethesda, MD, 20892 USA
Stall et al. Radiation Oncology 2010, 5:5
/>© 2010 Stall et al; licensee BioMed Central Ltd. Th is is an Open Access article distributed under t he terms of the Creative Commons
Attribution License ( which permits unrestricted use, distribution, and reproduction in
any medium, provided the orig inal work is properly cited.
Introduction
According to the Central Brain Tumor Registry of the
United States, more than 20,000 malignant brain tumors
are diagnosed each year. Glioblastoma Multiforme
(GBM) accounts f or 70% of new adult cases of malig-
nant brain tumors. While this represents only 1.4% of
all primary malignant tumors in the US, the poor 5 year
survival rate of less than 4% has commanded extensive
clinical research [1].
Standard primary therapy for high grade gliomas
includes maximal safe resection followed by adjuvant
radiation and chemotherapy. As ima ging techniques
have advanced over the past several decades, targeting
for radiotherapy has evolved to include new modalities
in treatment planning. The use of these complementary
imaging modalities in treatment planning and assess-
ment may allow more accurate targeting of tumor,
improved sparing of normal tissues, and early assess-
ment of disease response to therapy.
The foundation of radiation treatment planning for
GBM is based on landmark studies demonstrating predi-
lection for central recurrence and data correlating
pathologic findings with imaging abnormalities [2-5].
Contemporary radiation therapy planning for high grade
gliomas involves identifying tumor volumes on various
MRI sequences. Institutional preference gene rally dic-
tates whether T2 or FLAIR is used to define tumor
volumes and associated edema. Because there is limited
data comparing the dosimetric and clinical impact of
using these imaging sequences for radiotherapy plan-
ning, we aimed to evaluate the differences in terms of
treatment volumes, changes in dose distribution to criti-
cal structures, and effects on clinical outcome.
Materials and methods
Treatment Planning
We used treatment planning images of all adult patients
with high grade gliomas treated between 2002 and 2008
at the National Cancer Institute in whom a complete
pretreatment MRI with contrast-enhanced T1, T2 and
FLAIR sequences was currently available for review.
Demographic factors were reviewed for prognostic data
including, age, functional status, exten t of resection
prior to treatment and a recursive partitioning analysis
(RPA) score was calculated for all patients based on
these factors [6,7].
All patients were simulated for radiation treatment
planning with immobilization via a custom thermoplas-
tic face mask. CT imaging of the head and upper neck
was performed using a Philips Large Bore CT scanner
and images w ere transferred to a Varian Eclipse plan-
ning system (version 6.5). A 3D volume was created for
each patient from the treatment planning CT. All MRI
sequences were fused to this 3D volume. Match points
were used to align analogous anatomic landmarks on
the CT and MRI. 3D tra nslations and rotations were
then performed and visually verified in axial, sagittal and
coronal views. Each fusion was approved by the physi-
cist and treating physician.
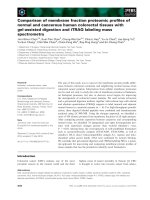
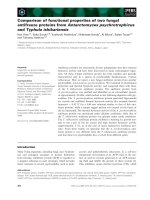
Once a satisfactory fusion was achieved, normal struc-
tures and tumor volumes were contoured on the T2
and FLAIR sequences without comparison to the alter-
native sequence (Figure 1). The clinical tumor volume
(CTV) consisted of the enhancing lesion and surround-
ing edema. A 2 cm volumetric expansion of the CTV
was delineated as the planning tumor volume (PTV).
Using the “ calculate volume” function, the target
volumes in cubic centimeters (cc) for all patients were
recorded. For each patient the difference between the
target volumes were tabulated and a mean percent dif-
ference was then calculated for the target volumes. The
union (the area belonging to one or both of the defined
volumes) and intersection (the area belonging to both
defined volumes) of the CTVs and PTVs were deter-
mined using a Boolean function. These values were then
used to calculate the fractional component contributed
by the imaging techniques as previously described by
Haken and colleagues [8,9].
As a means of incorporating the data from each of the
sequences, a combined PTV was created from the union
of the T2 a nd FLAIR CTVs with a standard 2 cm volu-
metric expansion. The percent difference and absolute
difference between the combined PTV and the T2 and
FLAIR PTV was calculated.
Next we investigated the potential consequences in
respecttonormaltissueexposureusingthePTVsgen-
erated with different MRI se quences. Because of the ret-
rospective design of this study, we evaluated the overlap
ofthePTVswithnormalstructuresasasurrogatefor
toxicity. It is probable that mo st clinicians would trim
target volumes to avoid overdosing normal tissue; how-
ever, this metric provides data on the likelih ood of nor-
maltissuecoveragebythePTV.Thebrainstemand
chiasm were selected as at risk for critical exposure
based on historical tissue tolerance data [10]. Inclusion
of these organs within the PTV was defined as a high
risk of a critical exposure and was determined by using
the Boolean operator function to find the intersection in
cubic centimeters of the T2 and FLAIR PTVs with the
brainstem and chiasm. The number of patients with cri-
tical structure overla ps as well as the percentage over-
laps with the PTV as defined by T2 and FLAIR was
recorded.
For comparison purposes, the tumor volumes were
evaluated in pairs (e.g. CTV as delineated on T2 and
FLAIR). Each pair of target volumes was compared on
Stall et al. Radiation Oncology 2010, 5:5
/>Page 2 of 7
the basis of total volume as well a s anatomic location.
The v olume in cubic centimeters was d etermined using
the “calculate volume” function on the planning soft-
ware. To assess the differences in location, a discordance
index was calculated. This was defined as the union of
the two volumes minus the ratio of the intersection to
the union: (A U B) - (A n B)/(A U B).
Finally, for patients with MRI documented brain fail-
ures we lo oked at the recurrence patterns both in terms
of their relationship t o the tumor volum es delineated
using the different MRI sequence s as well as to the
delivered dose. Specifically, the T1 sequence was fused
to the original treatment planning CT and the recur-
rence volume was delineated as the recurrent gross
tumor volume (rGTV). The overlap of the rGTV with
each of the planning volumes was c alculated using the
intersection Boolean operator function. The centrality of
failure was determined by overlaying the delivered dose
distribution on the planning CT. If the rGTV was
encompassed by the 95% isodose line the failure was
scored as central [11].
Statistics
Becauseofthelargerangeintumorvolumes,theCTV
and PTV for each MRI sequence were normalized to
their respective union volumes. This allowed for com-
parison using a two tailed paired student t-test.
Results
Patient Characteristics
Over the study period, 32 adult patients with high grade
gliomas were treated with definitive radiotherapy at the
NCI that had the required pretreatment contrast-enhanced
MR with T1, T2 and FLAIR sequences. All pathology was
reviewed at the NCI prior to treatment, with the majority
of patients documented to have world health organization
(WHO) grade IV gliomas (26/32). The remaining 6
patients had anaplastic astrocytomas. The remaining clini-
cal demographics are summarized in Table 1.
Nine patients treated prior to the landmark study
published by Stupp et al in 2005 received radiation
treatment alone; following this publication, patients
received conc urrent and adjuvan t temozolomide [12].
Eight patients were enrolled on a phase II study of the
histone deacetylase inhibitor valproic acid in combina-
tion with standard temozolomide therapy. The acute
toxicity results have since been presented [13]. In total,
twenty-three patients received temozolomide. All
patients were treated with 3D conformal plans to a
median dose of 60 Gy.
T2 and FLAIR volumes
There was a large range in the size of CTVs and PTVs
across the patient cohort. The m ean T2 and FLAIR
CTVs were 98.99 cc (range 1.51-383.5 cc) and 113.76 cc
(range 2.77-546 cc), respectively . The mean T2 and
FLAIR PTVs were 486.11 (91.81-1233.82) and 523.38
(101.89-1458.51). The mean percent difference between
the CTV volumes from T2 images was 21% and the
mean percent difference between the PTV volumes
from the same data sets was 9%. To account for the
large range in values, each volume was normalized to
the union and compared using a two tailed paired stu-
dent t-test. The FLAIR volumes were significantly larger
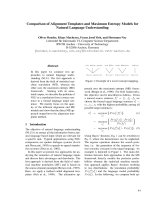
Figure 1 Overlay of tumor volumes as contoured on T2 and FLAIR sequences. The T2 ab normality is contoured in red and the FLAIR
abnormality is contoured in cyan.
Stall et al. Radiation Oncology 2010, 5:5
/>Page 3 of 7
than those obtained with T2 (p < 0.0001 for CTV and p
= 0.0001 for PTV).
The average overlap (intersection) of the T2 and FLAIR
CTVs was 83.84 cc and the average union was 126.34 cc.
The average intersection of the T2 and FLAIR PTVs was
452.32 and the average union was 553.69 cc. There was a
large range of discordance between the CTVs and PTVs.
The CTV discordance ranged from 0.083 - 0.65 with an
average of 0.359 (std dev 0.13). With a volumetric expan-
sion to create the PTV, the average discordance
decreased to 0.20 with a range of 0.079 -1 (std dev 0.15).
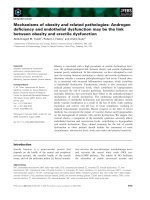
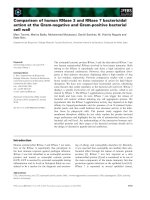
The average fractional component of the CTV Union
was 12.9% for T2 and 25.7% for FLAIR, while the overlap
contributed the majority (63.6%) as shown in figure 2.
For example, the composite CTV for patient 1 was com-
prised of 10% T2 only, 19% FLAIR only and 71% by the
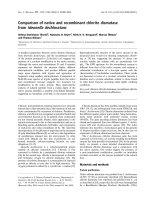
intersection of the T2 and FLAIR volumes. Similarly, the
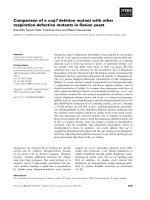
largest component of the PTV Union was the overlap
(82.1%) while T2 and FLAIR contributed 5.2% and 12%,
respectively (figure 3). Thus although the largest compo-
nent of the union volumes was the intersection, each
sequence contributed unique information
Combined Planning Tumor Volumes
The average combined PTV, created from the union of
theT2andFLAIRCTVswitha2cmvolumetric
expansion was 514.20 cc (104.28 - 178.96 cc). The mean
volume difference between the combined PTV and the
T2 and FL AIR PTVs was 46.23 cc and 18.67 cc. Using
the combined PTV would result in an 11.7% variation
from the PTV as defined by T2 and 4.16% as defined by
FLAIR.
Normal Structure Toxicity
Using FLAIR to define the PTV, 19 patients had overlap
with the brainstem as compared to 23 using T2.
Numerically, the average percent overlap with FLAIR
was higher; however this was no t statistically significant.
The overlap was 32% and 26%, respectively, for FLAIR
and T2 (p = 0.81). V olumetrically, the average overlap
with the brain stem was 5.27 cc using FLAIR and 4.88
cc using T2. Similarly, slightly more patients had overlap
with the chiasm on FLAIR, 11 versus 9. This percent
overlap was not statistically significant, 26% vs 34% (p =
0.18) with the T2 overlap being greater. The average
overlap with the brainstem was 0.091 cc using FLAIR
and 0.085 cc using T2. Based on this surrogate analysis,
using FLAIR rather than T2 to delineate tumor volumes
could inherently increase toxicity.
Failure Data
At the time of a nalysis, 26 failures had occurred of
which 19 patients had MR image s available from the
time of failure. Two patients are alive and 4 are lost to
follow-up. As expected based on literature reporting
recurrence patterns, all failures were central as defined
by coverage by the 95% isodose line [2,5,14]. Fourteen
of the 19 failures were entirely encompassed by both the
T2 and FLAIR PTV. The remaining failures were par-
tially encompassed with three failures corresponding
better with FLAIR and two failures with T2 images. An
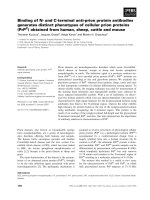
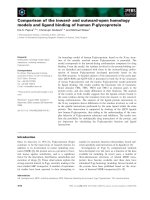
exampleofthisanalysisisshowninfigure4.Numeri-
cally, the percent overlap of the failure GTV was greater
with the FLAIR CTV than with the T2 CTV, however
this was not statistically significant p = 0.1. This was
also true of the PTV overlap with failure GTV, p = 0.6.
As suggested by the fractional component analysis,
both sequences provide unique information about the
diseased tissue and therefore provide different but valid
information regarding the site of future recurrences.
Discussion
Imaging of malignant brain tumors has played an
important role in radiation treatment planning. Within
years of the landmark discovery by Roentgen [15], the
use of radiographs to diagnose cerebral tumors became
routine[16].However,therelativelimitedresolution
and accuracy of plain radiographs and other early ima-
ging modalities such as ventriculography and angiogra-
phy supported the use of whole brain treatment [17-22].
Table 1 Summary of Patient Characteristics
Characteristic
Age (median) 54 (30-73)
Sex
Women 12
Men 20
WHO Grade
III 7
IV 26
RPA Class
I3
II 0
III 7
IV 12
V8
VI 2
Concurrent therapy
None 9
TMZ 15
TMZ/valproic acid 8
Abbreviations: WHO-World Health
Organization, RPA-Recursive Partitioning
Analysis, TMZ-temozolamide
Stall et al. Radiation Oncology 2010, 5:5
/>Page 4 of 7
Figure 2 Fractional component of the CTV Union. The contributio n from T2 alone is in blue, the contribution from FLAIR alone is in yellow
and the intersection is in maroon.
Figure 3 Fractional component of the PTV Union. The contribution from T2 alone is in blue, the contri bution from FLAIR alone is in yellow
and the intersection is in maroon.
Stall et al. Radiation Oncology 2010, 5:5
/>Page 5 of 7
It was not until the early 1970’s that partial brain treat-
ment became a viable option with the introduction of
CT which heralded a dramatic change in the diagnostic
evaluation and treatment principles of gliomas. The cor-
relation of CT imaging and histological data in conjunc-
tion with clinical d ata demonstrating 80% of local
recurrence arising within 2 c m of the original tumor as
defined by CT, paved the foundation for successful par-
tial brain treatment [2,3,5,14,23-28].
Nearly concurrent with introduction of CT imaging,
MRI was developed and quickly became an important
tool for radiation treatment planning. Biopsy evaluation
identified tumor cells in the area of MRI T2 abnormality
outside the contrast enhancing CT abnormality [4] and
was subsequentl y incorporated into the target volume
for radiation treatment planning [8,9]. While T2 MRI
improved delineation of the extent of microscopic dis-
ease, several limitations became apparent. Specifically,
T2 weighting causes CSF to be brighter than the brain
and can be degraded by volume averaging and fluid
motion artifacts secondary to normal cardiopulmonary
cycles. These disadvantages led to the development of
the FLAIR sequence [29]. By nullifying the CSF signal
and decreasing the contrast between gray and white
matter, the conspicuity of lesions in the periventricular
and peripheral subcortical areas was improved [30].
Current Radiation Therapy Oncology Group protocols
advise using CT and either FLAIR or T2 images to iden-
tify tumor volumes [31]. However, the differences in T2
and FLAIR MRI sequences to delineate clinically signifi-
cant tumor burden have n ot been clearly defined in
radiation treatment planning for high grade gliomas.
The results of this study demonstrate both a qualita-
tive and quantitative difference between the tumor tar-
get volumes as defined by T2 and FLAIR. The volumes
of both the CTV and PTV delineated using FLAIR were
significantly larger than those obtained using T2.
Despite t his increase in size, there was not a significant
difference in the overlap with critical structures suggest-
ing that incorporating the FLAIR abnormality does not
necessarily increase toxicity. The discordance index
between these techniques was substantial, indicating
geographic differences in the visualized abnormality.
The majority of the target composite volumes were seen
on both the T2 and FLAIR images. However, bot h
sequences contributed unique and equally valid data to
the composite volume. With regar ds to th e patterns of
failure, most lesions were encompassed by both T2 and
FLAIR but several patients’ lesions only correlated with
one sequence. It is known from the underlying physics
that the FLAIR technique nullifies CSF, but it is unclear
if other factors may account for the differences between
FLAIR and T2.
Other investigators have evaluated the utility of incor-
porating additional imaging techniques into glioma
planning but to our knowledge there is no data regard-
ing the differences using T2 versus FLAIR to delineate
high grade gliomas for radiation treatment. Functional
imaging such as IMP -SPECT, MRSI, and PET have
shown promise in guiding treatment planning as well as
predicting response. Similar to our results, studies of
these techniques have shown e xtension beyond the T2
abnormality suggesting that traditional targeting may be
inade quate [32-34]. However, the incorporation of these
novel advances may be limited by availability and cost
while FLAIR is readily accessible.
We recognize several limitations in our study. This a
retrospective review of a small cohort. As such, the time
between diagnostic MRI and simulation CT as well as
the use or dosing of steroids was not controlled and
may have influ enced our results. In assessing differences
between the FLAIR and T2 volumes we did not correct
for image registration errors. However, based on our
comparison of T2 and FLAIR i maging for radiation
treatment planning, both techniques are important and
Figure 4 Planning T2 MRI fused with FLAIR images from same
date and T1 MRI obtained at time of failure. The failure volume
(rGTV) is contoured in light green. The T2 and FLAIR CTVs are
outlined in red and cyan respectively. The T2 and FLAIR PTVs are
outlined in orange and dark blue respectively. The FLAIR PTV
encompasses a greater portion of the failure volume than T2 PTV.
Overlay of the 95% dose color wash shows that the failure is
central.
Stall et al. Radiation Oncology 2010, 5:5
/>Page 6 of 7
not interchangeable. Each technique can help distinguish
normal parenchyma from edema and abnormal tissue.
FLAIR is inherently more complex as it includes some
T1 weig hted effects. Our results do not show one tech-
nique to be superior but suggest such differences should
not be ignored in high grade treatment conformal or
IMRT planning, e specially within a clinical trial where
the results may be biased by the preference of one
sequence over the other.
Acknowledgements
This research was supported in part by the Intramural Research Program of
the National Institutes of Health, National Cancer Institute.
Authors’ contributions
BS participated in the image fusion, performed the contouring, participated
in the data analysis and wrote the manuscript. LZ participated in contouring
and helped revise the draft manuscript. HN checked image fusion and
participated in treatment planning. JO carried out MRI fusions and
participated in treatment planning. BA participated in treatment planning
and checked image fusion. US participated in the statistical analysis of the
results. RWM participated in treatment planning. DC participated in study
design, data analysis and helped revise the draft manuscript. KC conceived
of the study, and participated in its design and coordination and helped to
draft the manuscript. All authors read and approved the final manuscript.
Competing interests
The authors declare that they have no competing interests.
Received: 6 October 2009
Accepted: 28 January 2010 Published: 28 January 2010
References
1. CBTRUS (2008): Statistical Report: Primary Brain Tumors in the United
States, 2000-2004. Central Brain Tumor Registry of the United States 2008.
2. Garden AS, Maor MH, Yung WK: Outcome and patterns of failure
following limited-volume irradiation for malignant astrocytomas.
Radiother Oncol 1991, 20:99-110.
3. Halperin EC, Bentel G, Heinz ER: Radiation therapy treatment planning in
supratentorial glioblastoma multiforme: an analysis based on post
mortem topographic anatomy with CT correlations. Int J Radiat Oncol Biol
Phys 1989, 17:1347-1350.
4. Kelly PJ, Daumas-Duport C, Kispert DB: Imaging-based stereotaxic serial
biopsies in untreated intracranial glial neoplasms. J Neurosurg 1987,
66:865-874.
5. Wallner KE, Galicich JH, Krol G: Patterns of failure following treatment for
glioblastoma multiforme and anaplastic astrocytoma. Int J Radiat Oncol
Biol Phys 1989, 16:1405-1409.
6. Curran WJ Jr, Scott CB, Horton J: Recursive partitioning analysis of
prognostic factors in three Radiation Therapy Oncology Group
malignant glioma trials. J Natl Cancer Inst 1993, 85:704-710.
7. Mirimanoff RO, Gorlia T, Mason W: Radiotherapy and temozolomide for
newly diagnosed glioblastoma: recursive partitioning analysis of the
EORTC 26981/22981-NCIC CE3 phase III randomized trial. J Clin Oncol
2006, 24:2563-2569.
8. Ten Haken RK, Thornton AF Jr, Sandler HM: A quantitative assessment of
the addition of MRI to CT-based, 3-D treatment planning of brain
tumors. Radiother Oncol 1992, 25:121-133.
9. Thornton AF Jr, Sandler HM, Ten Haken RK: The clinical utility of magnetic
resonance imaging in 3-dimensional treatment planning of brain
neoplasms. Int J Radiat Oncol Biol Phys 1992, 24:767-775.
10. Emami B, Lyman J, Brown A: Tolerance of normal tissue to therapeutic
irradiation. Int J Radiat Oncol Biol Phys 1991, 21:109-122.
11. Chan JL, Lee SW, Fraass BA: Survival and failure patterns of high-grade
Gliomas after three-dimensional conformal radiotherapy. J Clin Oncol
2002, 20:1635-1642.
12. Stupp R, Mason WP, Bent van den MJ: Radiotherapy plus concomitant
and adjuvant temozolomide for glioblastoma. N Engl J Med 2005,
352:987-996.
13. Kamrava M: Acute Toxicity in a Phase II Clinical Trial of Valproic Acid in
Combination with Temodar and Radiation Therapy in Patients with
Glioblastoma Multiforme. Int J Radiat Oncol Biol Phys 2008, 72(Suppl
1):211.
14. Massey V, Wallner KE: Patterns of second recurrence of malignant
astrocytomas. Int J Radiat Oncol Biol Phys 1990, 18:395-398.
15. Rontgen WC: On a New Kind of Rays. Science 1896, 3:227-231.
16. Leeds NE, Kieffer SA: Evolution of diagnostic neuroradiology from 1904 to
1999. Radiology 2000, 217:309-318.
17. Aristizibal SA, Caldwell WL: Time-dose-volume relationships in the
treatment of glioblastoma multiforme. Radiology 1971, 101:201-202.
18. Concannon JP, Kramer S, Berry R: The extent of intracranial gliomata at
autopsy and its relationship to techniques used in radiation therapy of
brain tumors. Am J Roentgenol Radium Ther Nucl Med 1960, 84:99-107.
19. Kilgore EJ, Elster AD: Walter Dandy and the history of ventriculography.
Radiology 1995, 194:657-660.
20. Kramer S: Radiation therapy in the management of malignant gliomas.
Proc Natl Cancer Conf 1972, 7:823-826.
21. Salazar OM, Rubin P: The spread of glioblastoma multiforme as a
determining factor in the radiation treated volume. Int J Radiat Oncol Biol
Phys 1976, 1:627-637.
22. Todd DH: Choice of Volume in the X-Ray Treatment of Supratentorial
Gliomas. Br J Radiol 1963, 36:645-649.
23. Hess CF, Schaaf JC, Kortmann RD: Malignant glioma: patterns of failure
following individually tailored limited volume irradiation. Radiother Oncol
1994, 30:146-149.
24. Hochberg FH, Pruitt A: Assumptions in the radiotherapy of glioblastoma.
Neurology 1980, 30:907-911.
25. Salazar OM, Rubin P, McDonald JV: Patterns of failure in intracranial
astrocytomas after irradiation: analysis of dose and field factors. AJR Am
J Roentgenol 1976, 126:279-292.
26. Shapiro WR, Green SB, Burger PC: Randomized trial of three
chemotherapy regimens and two radiotherapy regimens and two
radiotherapy regimens in postoperative treatment of malignant glioma.
Brain Tumor Cooperative Group Trial 8001. J Neurosurg 1989, 71:1-9.
27. Sharma RR, Singh DP, Pathak A: Local control of high-grade gliomas with
limited volume irradiation versus whole brain irradiation. Neurol India
2003, 51:512-517.
28. Walker MD, Alexander E Jr, Hunt WE: Evaluation of BCNU and/or
radiotherapy in the treatment of anaplastic gliomas. A cooperative
clinical trial. J Neurosurg 1978, 49:333-343.
29. De Coene B, Hajnal JV, Gatehouse P: MR of the brain using fluid-
attenuated inversion recovery (FLAIR) pulse sequences.
AJNR Am J
Neuroradiol 1992, 13:1555-1564.
30. Bydder GM, Young IR: MR imaging: clinical use of the inversion recovery
sequence. J Comput Assist Tomogr 1985, 9:659-675.
31. Radiation Therapy Oncology Group : Active Brain Protocols. />members/active.html#brain.
32. Grosu AL, Weber W, Feldman HJ: First experience with I-123-alpha-methyl
tyrosine spect in the 3-D radiation treatment planning of brain gliomas.
Int J Radiat Oncol Biol Phys 2000, 47:517-526.
33. Mosskin M, Erickson K, Hindmarsh T: Positron emission tomography
compared with magnetic resonance imaging and computed
tomography in supratentorial gliomas using multiple stereotactic
biopsies as reference. Acta Radiol 1989, 30:225-232.
34. Pirzkall A, McKnight TR, Graves EE: MR-spectroscopy guided target
delineation for high-grade gliomas. Int J Radiat Oncol Biol Phys 2001,
50:915-928.
doi:10.1186/1748-717X-5-5
Cite this article as: Stall et al.: Comparison of T2 and FLAIR imaging for
target delineation in high grade gliomas. Radiation Oncology 2010 5:5.
Stall et al. Radiation Oncology 2010, 5:5
/>Page 7 of 7