Combining global genome and transcriptome approaches to identify the candidate genes of small-effect quantitative trait loci in collagen-induced arthritis pptx
Bạn đang xem bản rút gọn của tài liệu. Xem và tải ngay bản đầy đủ của tài liệu tại đây (533.73 KB, 9 trang )
Open Access
Available online />Page 1 of 9
(page number not for citation purposes)
Vol 9 No 1
Research article
Combining global genome and transcriptome approaches to
identify the candidate genes of small-effect quantitative trait loci
in collagen-induced arthritis
Xinhua Yu
1
, Kristin Bauer
1
, Dirk Koczan
2
, Hans-Jürgen Thiesen
2
and Saleh M Ibrahim
1
1
Immunogenetics Group, University of Rostock, Schillingallee, 18055 Rostock, Germany
2
Institute for Immunology, University of Rostock, Schillingallee, 18055 Rostock, Germany
Corresponding author: Saleh M Ibrahim,
Received: 19 Sep 2006 Revisions requested: 16 Oct 2006 Revisions received: 5 Dec 2006 Accepted: 23 Jan 2007 Published: 23 Jan 2007
Arthritis Research & Therapy 2007, 9:R3 (doi:10.1186/ar2108)
This article is online at: />© 2007 Yu et al.; licensee BioMed Central Ltd.
This is an open access article distributed under the terms of the Creative Commons Attribution License ( />),
which permits unrestricted use, distribution, and reproduction in any medium, provided the original work is properly cited.
Abstract
Quantitative traits such as complex diseases are controlled by
many small-effect genes that are difficult to identify. Here we
present a novel strategy to identify the candidate genes for
small-effect quantitative trait loci (QTL) in collagen induced
arthritis (CIA) using global genome and transcriptome
approaches. First, we performed genome linkage analysis in F2
progeny of the CIA susceptible and resistant strains to search
for small-effect QTL. Second, we detected gene expression
patterns of both strains during CIA. The candidate genes were
identified using three criteria: they are located in a genomic
region linked to CIA; they are disease-specific differentially
expressed during CIA; and they are strain-specific differentially
expressed regarding the two parental strains. Eight small-effect
QTL controlling CIA severity were identified. Of 22,000
screened genes, 117 were both strain-specific and disease-
specific differentially expressed during CIA. Of these 117
genes, 21 were located inside the support intervals of the 8
small-effect QTL and thus were considered as candidate genes.
Introduction
Susceptibility to most complex diseases is controlled by many
genes, each having a small effect on the disease. One example
is rheumatoid arthritis (RA), a common complex multifactorial
autoimmune disease. Several studies have been carried out to
detect the genetic basis of RA, and more than 30 genomic
regions have shown evidence of linkage to the disease. Most
of these genomic regions did not reach a genome-wide signif-
icant threshold value of linkage, with P values between 0.05
and 0.001 [1-5]. Thus, these loci only have a small effect on
RA. Small genetic contributions could also be seen from the
susceptibility genes of RA identified so far, including HLA-
DR4, PADI4, PTPN22 and FCRL3 [6-9]. Except for HLA-
DR4, which is strongly associated with RA, all the other sus-
ceptibility genes have only a small effect on the disease. In the
mouse model of RA, small genetic contributions are also often
observed. For example, in a previous study, we carried out a
genome screen to identify the quantitative trait loci (QTL) in
collagen-induced arthritis (CIA), which is a widely used animal
model of RA. Only one QTL, Cia2, was identified for the phe-
notype of CIA severity, but this QTL contributes to only 16%
of the phenotype variations for CIA susceptibility in F2 prog-
eny [10]. This suggests that there must be other susceptibility
genes whose contributions were not big enough to reach the
stringent significance threshold value of linkage analysis.
One aim of using animal models for complex diseases is to
detect the genetic basis of these diseases. With controllable
environmental factors as well as the known genetic back-
ground, animal models are powerful tools to search for sus-
ceptibility genes for complex diseases, and have been
intensively employed for that purpose. More than 27,000 QTL
have been identified in the mouse genome since the first QTL
was identified at the beginning of the 1990s [11]. By 2005,
approximately 20 quantitative trait genes (QTGs) in the mouse
genome had been identified [12,13]. Interestingly, most QTGs
identified in animal models have the causal polymorphisms in
the protein-coding region [14], which provoke protein
CA = chronic arthritis; CIA = collagen-induced arthritis; CV = coefficiant of variation; GO = Gene Ontology; LN = lymph node; LOD = logarithm of
the odds; MAPK = mitogen-activated protein kinase; NC = naive control; OA = onset of arthritis; PI = post-immunisation; QTG = quantitative trait
gene; QTL = quantitative trait loci; RA = rheumatoid arthritis.
Arthritis Research & Therapy Vol 9 No 1 Yu et al.
Page 2 of 9
(page number not for citation purposes)
structure changes or protein deficiency. This suggests, on the
one hand, that small-effect QTL are difficult to identify with tra-
ditional strategies and, on the other hand, that the polymor-
phisms regulating gene expression might only slightly affect
the quantitative traits, and thus are more difficult to identify.
Microarray-based global gene expression is a powerful tech-
nique for investigating complex diseases. During disease
development, genes involved in the disease are likely to be dif-
ferentially regulated. Therefore, signature genes of the dis-
eases could be identified by detecting the expression patterns
of the disease-related cells/tissues and their ideal controls. In
the past decade, many studies applied this technique to study
both RA and its animal models [15-22]. Indeed, genes
involved in arthritis show distinct expression patterns in certain
tissues and pathological stages of the disease. Genes
involved in immunoinflammatory responses were differentially
expressed in the blood cells in RA patients [18]. Chemokines
and adhesion molecules were upregulated in the joint at the
initiation phase of arthritis in animal models [21,22], while
genes involved in cartilage destruction and bone erosion were
differentially expressed at the late phase of arthritis in animal
models of RA [15,16]. Besides detecting genes involved in
complex diseases, microarrays could also be used to detect
the genetic polymorphisms regulating gene expression
because differential expressions between two strains might be
the result of a polymorphism located in regulatory elements.
To identify the small-effect QTL of CIA as well as the potential
candidate genes inside them, we investigated CIA genetically
susceptible and resistant strains at both the genome and tran-
scriptome levels. At the genome level, F2 progeny of the CIA
susceptible (DBA/1) and resistant (FVB/N) strains were gen-
erated and a genome-wide linkage analysis was performed to
identify small-effect QTL. At the transcriptome level, we
detected the gene expression patterns of both the DBA/1 and
FVB/N strains at four different phases of CIA. The potential
candidate genes were identified based on three criteria: they
are located within the genomic region linked to CIA; they are
disease-specific differentially expressed during CIA; and they
are strain-specific differentially expressed between the two
parental strains during CIA.
Materials and methods
Animals, immunisation and assessment of arthritis
Both DBA/1 and FVB/N mice used in this study were obtained
from the Jackson Laboratory and kept in a climate-controlled
environment with 12 hour light/dark cycles in the animal facility
at the University of Rostock. All animal experiments were pre-
approved by the State Animal Care Committee. CIA was
induced in control and experimental animals according to
established protocols described previously [10]. In brief,
DBA/1J, FVB/N and (DBA/1J × FVB/N)F2 progeny were
immunised at 8 to 12 weeks at the base of the tail with 125 μg
of bovine Collagen II (Chondrex, Redmond, WA, USA) emulsi-
fied in CFA (DIFCO, Detroit, MI, USA). The clinical scoring of
arthritis commenced 18 days after immunisation, and animals
were monitored three times weekly for signs of CIA. Arthritis
development was monitored in all four limbs using a three-
score system per limb as described previously [10].
Eight-week old FVB/N and DBA/1J mice were used for the
detection of gene expression. They were divided into four
experimental groups according to the different phases of CIA,
namely naive control (NC), post-immunisation (PI), onset of
arthritis (OA) and chronic arthritis (CA) (Table 1). The NC
group contained non-immunised mice that were sacrificed at
the age of 8 weeks. The mice in the PI group were sacrificed
on day 10 after immunisation. The mice in the OA group were
sacrificed on day 35 after immunisation. Three FVB/N non-
arthritic mice and three DBA/1 mice that showed signs of
arthritis on day 33 or 34 after immunisation were sacrificed on
day 35 after immunisation. The mice in the CA group were
sacrificed on day 95 after immunisation. Three non-arthritic
FVB/N mice and three DBA/1 mice that had developed arthri-
tis for at least two months were sacrificed on day 95 after
immunisation.
Linkage analysis
Detailed information on genotyping of the genome screen has
been described previously [10]. In short, we genotyped 290
F2 mice using 126 informative microsatellite markers covering
the genome with an average inter-marker distance of 11.5 cM
for 290 F2 progeny. All linkage analyses were performed with
QTX Map manager software [23]. The main clinical phenotype
of CIA, arthritis severity, was taken as phenotype. To detect
the small-effect QTL, the threshold value of linkage was set as
P = 0.05 (Chi-square test).
Sample preparation and microarray hybridisation
Lymph nodes (LNs) draining the immunisation site were used
for total RNA preparation. The total RNA was extracted from
the tissue homogenates using a commercial kit in accordance
with the provided protocol (QIGEN, Hilden, Germany). Analy-
sis of gene expression was conducted using a U430A array
(Affymetrix, Santa Clara, CA, USA) interrogating more than
22,000 genes. RNA probes were labelled in accordance with
the manufacturer's instructions. Samples from individual mice
were hybridised onto individual arrays. Hybridisation and
washing of gene chips were done as previously described
[16]. Fluorescent signals were collected by laser scan
(Hewlett-Packard Gene Scanner).
Microarray analysis
Normalisation of the expression level was done using Affyme-
trix software MAS 5, which is based on global scaling of total
gene expression level per microarray. The normalised expres-
sion values were imported to and analysed by dCHIP [24]. Dif-
ferentially expressed genes were identified by defining the
appropriate filtering criteria in the dCHIP software as: lower
Available online />Page 3 of 9
(page number not for citation purposes)
90% confidence boundary of fold change between the group
means exceeded twofold; the absolute difference between the
two groups exceeded 100; the P value threshold of the
unpaired t-test was 0.05. The false discovery rate was estab-
lished with a permutation test for each pairwise comparison to
estimate the proportion of false-positive genes.
Hierarchical gene clustering was performed with dCHIP to
characterise the gene expression patterns during CIA. The
default clustering algorithm of genes was as follows: the dis-
tance between two genes is defined as 1 – r, where r is the
Pearson correlation coefficient between the standardised
expression values of the two genes across the samples used.
To characterise the functional relationship between differen-
tially expressed genes, Gene Ontology (GO) term classifica-
tion incorporated in DNA-Chip Analyzer was performed. The
significant level for a function cluster was set at P < 0.005, and
the minimum size of a cluster was three genes.
Results
Small-effect QTL of CIA in (DBA/1 × FVB/N) F2 progeny
In a previous study, we carried out a genome screen to identify
QTL controlling CIA susceptibility in (DBA/1 × FVB/N) F2
progeny. For the phenotype of arthritis severity, only one QTL,
Cia2, was identified, with a highly significant logarithm of the
odds (LOD) score of 12 [10]. However, Cia2 contributed to
only 16% of the phenotype variations, indicating that there
should be some small-effect QTL whose contributions to CIA
were not big enough to reach the significant threshold value of
linkage. To identify these potential small-effect QTL, we rean-
alyzed the data using a lower threshold value of linkage (P =
0.05). We reasoned that since the main candidate gene of
Cia2, complement component C5 (Hc), was proven to be
essential for CIA development and because the FVB/N strain
is C5 deficient [10,25], some small-effect QTL might be
Table 1
Experimental groups used for gene expression profiling
Group Treatment RNA source No. of mice CV (percentage)
DBA/1_NC None LN from naive control DBA/1 3 22.8
DBA/1_PI CFA + collagen II LN from DBA/1 at day 10 after immunisation 3 20.4
DBA/1_OA CFA + collagen II LN from DBA/1 mice at day 35 after immunisation 3 21.7
DBA/1_CA CFA + collagen II LN from DBA/1 mice at day 95 after immunisation 3 25.8
FVB/N_NC None LN from naive control FVB/N 3 21.1
FVB/N_PI CFA + collagen II LN from FVB/N at day 10 after immunisation 3 22.6
FVB/N_OA CFA + collagen II LN from FVB/N mice at day 35 after immunisation 3 18.4
FVB/N_CA CFA + collagen II LN from FVB/N mice at day 95 after immunisation 3 21.1
CA, chronic arthritis; CFA; complete Freund's adjuvant; CV, coefficient of variation; LN, lymph node; NC, naive control; OA, onset of arthritis; PI,
post-immunisation.
Table 2
Summary of the small-effect QTL identified in this study
Loci Chromosome Peak marker Position (Mb) P value Susceptibility
allele
Overlapping QTL in
mouse models of RA
Snyternic region linked to RA
(linked marker)
1
a,b,c
5 D5Mit348 23,9 0.00691 DBA/1 Cia13
2
b
5 D5Mit425 119,1 0.04397 DBA/1 Cia14 22q11 (D22S264), 12p13-q24
(D12S95)
3
a,b,c
6 D6Mit14 145,7 0.00315 FVB/N 12p13-pter (D12S99)
4
a,b,c
7 D7Mit248 59,3 0.03250 DBA/1
5
a,c
10 D10Mit261 85,1 0.00647 DBA/1 Cia8 21q22-qter (D21S268), 10q22-23
(D10S2327)
6
b,c
11 D11Mit214 115,2 0.00521 DBA/1 Pgia7 17q21-q25 (D17S1301)
7
c
16 D16Mit138 45,4 0.01499 FVB/N 3q29-qter (D3S1311)
8
c
17 D17Mit197 18,3 0.02994 FVB/N
a
Identified in all F2 290 progeny.
b
Identified in 76 C5+/+ F2 progeny.
c
Identified in 133 C5+/- F2 progeny. QTL, quantitative trait loci; RA,
rheumatoid arthritis.
Arthritis Research & Therapy Vol 9 No 1 Yu et al.
Page 4 of 9
(page number not for citation purposes)
masked by Cia2. To exclude the masking effect of C5, we per-
formed linkage analysis with 3 datasets, the first containing all
290 F2 progeny, the second 77 C5
+/+
F2 progeny and the
third 133 C5
+/-
F2 progeny. Eight genomic regions were linked
to the phenotype of CIA severity (loci 1 to 8, Table 2), with P
values varying between 0.043 and 0.003. These eight small-
effect QTL were located on chromosomes 5, 6, 7, 10, 11, 16,
and 17. Five loci were identified in at least two datasets. Of the
eight loci, five had DBA/1 as the susceptibility allele, and three
had FVB/N as the susceptibility allele.
Lander and Botstein [26] suggested a LOD score of between
2 and 3 to ensure an overall false positive rate of 5%, which
means that using a lower threshold value will prevent false
negative QTL at the expense of increasing false positive QTL.
Being aware of this, we examined these genomic regions to
search whether they, or their syntenic genomic regions on the
human genome, have been previously linked to arthritis. Four
small-effect QTL overlapped with arthritis QTL on the mouse
genome identified previously. Locus 1 and 2 overlap with
Cia13 and Cia14, which control severity of CIA in (DBA/1 ×
BALB/C) F2 progeny [27]. Locus 5 located on chromosome
10 overlaps with Cia8, which was identified in (DBA/1 ×
B10.Q) F2 progeny [28]. Locus 6 overlaps with Pgia7, which
controls susceptibility to proteoglycan-induced arthritis
(PGIA) and was identified in (BALB/C × DBA/2) F2 progeny
[29]. The syntenic genomic regions of five small-effect QTL on
the human genome have been reported to be linked to RA.
These are genomic regions 22q11 and 12p13-q24 on chro-
mosome 22 and 12 (the counterparts of locus 2), 12p13-pter
on chromosome 12 (the counterpart of locus 3), 21q22-qter
and 10q22-23 on chromosome 21 and 10 (the counterparts
of locus 5), 17q21-25 on chromosome 17 (the counterpart of
locus 6) and 3q29-qter on chromosome 3 (the counterpart of
locus 7) [2,4].
Strain-specific differentially expressed genes
We detected the gene expression profiles using three mice
per group, which is a small number. Being aware of the impor-
tance of data reproducibility, we determined the coefficient of
variation (CV) to measure data variability. The CV for each
gene on the chip and the mean CV for the entire probe set
were calculated. The mean CV ranged between 18.4% and
25.8% for all experimental groups, and this relatively low CV
indicated that these data could be used for further analysis
(Table 1).
To search for strain-specific differentially expressed genes, we
performed comparisons of gene expression between the
DBA/1 and FVB/N strains at all four phases of CIA, including
NC, PI, OA and CA. For the naive mice without immunisation,
361 genes were differentially expressed between the two
strains. On day 10 after immunisation, when both strains did
not show any sign of the disease, 141 genes were differen-
tially expressed. After DBA/1 mice developed CIA, 184 and
85 differentially expressed genes were identified between
these two strains at the onset and chronic phases, respec-
tively. When the lists of the differentially expressed genes at
the four phases were merged and overlapping genes were
excluded, 509 genes were identified (Additional file 1).
Twenty-one genes consistently showed differential expression
between the two strains at all phases. Besides these 21
genes, only 3 additional genes were strain-specific differen-
tially expressed during the 3 phases after CIA induction (PI,
OA and CA; Figure 1).
Disease-specific differentially expressed genes
To identify the disease-specific differentially expressed genes
in CIA, we detected the genes that were differentially
expressed in LNs during CIA in the susceptible strain. Three
experimental conditions, PI, OA and CA, were compared with
the NC group. On day 10 after immunisation, 102 genes were
differentially expressed – most of them were upregulated (78
out of 102) – while at the onset phase of the disease, only 26
genes were differentially expressed. At the chronic phase of
the disease, 184 differentially expressed genes were identi-
fied, with 156 downregulated genes. Only one gene was dif-
ferentially expressed at all three phases of CIA. Besides this
gene, five, one and six differentially expressed genes were
shared by PI with OA, PI with CA and OA with CA, respec-
tively (Figure 2a). Taken together, 310 disease-specific
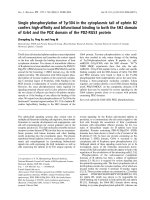
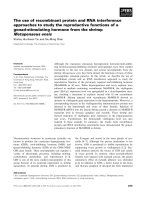
Figure 1
Differentially expressed genes between collagen-induced arthritis (CIA) susceptible and resistant strainsDifferentially expressed genes between collagen-induced arthritis (CIA)
susceptible and resistant strains. Comparison of the gene expression
between the DBA/1 and FVB/N strains was performed at four phases
of CIA. Of the 22,000 screened genes, 509 were differentially
expressed between both strains at one or more phases of CIA, includ-
ing 361 genes at the naive control (NC) phase, 141 genes at post-
immunisation (PI) phase, 184 genes at the onset of arthritis (OA) phase
and 85 genes at the chronic arthritis (CA) phase. The Venn diagram
indicates the number of overlapping genes differentially expressed at
different phases of CIA.
Available online />Page 5 of 9
(page number not for citation purposes)
differentially expressed genes were differentially regulated
during CIA in DBA/1 mice (Additional file 2).
To further characterise the gene expression pattern during
CIA, we performed hierarchical cluster analysis for these 310
genes. Six gene clusters were identified (clusters I to VI, Figure
2b), each with a distinct gene expression pattern during CIA.
Cluster I contains 16 genes, representing genes that were
upregulated after induction of CIA. The expression of these
genes reached a peak at the onset phase of the disease and
functional clustering results revealed that they are related to
the immune response. Cluster II contains 12 genes whose
expression was gradually upregulated and reached a peak at
the chronic phase of CIA. These genes are mainly related to
the immune response, organelle membrane and extracellular
region and space. Cluster III contains 78 genes that were only
upregulated at the PI phase. These genes are related to the
intercellular junction. More than half of the genes (156 of 310)
belong to cluster IV and represent genes specifically downreg-
ultaed at the chronic phase. These genes are functionally
related to lymphocyte proliferation, T cell activation, protein
binding as well as the notch signal pathway. Cluster V con-
tains eight genes downregulated at the PI phase. Cluster VI
contains 18 genes downregulated at the OA phase. The GO
term classification showed no functional cluster that was sig-
nificantly enriched in these two gene clusters.
Candidate genes for the small-effect QTL of CIA
To identify candidate susceptibility genes for the CIA small-
effect QTL, we compared the list of strain-specific differentially
expressed genes with the list of disease-specific differentially
expressed genes; 117 genes were shared by both lists (Addi-
tional file 3). Figure 3 visualises positions of the 117 genes
retrieved from Ensembl [30] in relation to the 8 small-effect
QTL. The eight loci were located on 7 chromosomes, 5, 6, 7,
10, 11, 16 and 17. Since the confidence intervals of QTL in F2
progeny are around 20 cM [26], we used 40 Mb as the confi-
dence intervals for all loci. Twenty-one genes were located in
the confidence intervals of six of the eight QTL. We located 5,
4, 2, 1, 3 and 6 potential candidate genes within the confi-
dence intervals of loci 1, 2, 3, 5, 6 and 8, respectively, while no
candidate gene was identified for loci 4 and 7. Table 3 sum-
marises the 21 candidate genes identified in this study. Two
genes, hspa1a and Oas1a, were upregulated at the OA phase
of CIA and Oas1a was also upregulated at the PI phase.
Except for these two genes, all other 19 genes were downreg-
ulated at the chronic phase of CIA. All genes, except hspa1a,
showed expression differences between the two strains at the
NC phase. Five genes were differentially expressed at all
phases of CIA, including H2-Q10, Mapk14, Pscd1, Kpnb1
and Wdr1. Among these five genes, H2-Q10 had a consist-
ently higher expression in the DBA/1 than the FVB/N strain in
all CIA phases, while the other four genes had a higher expres-
sion in the DBA/1 strain at the early stages, including NC, PI
and OA, but a lower expression at the chronic phase. GO term
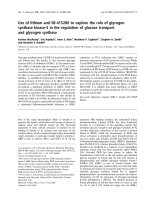
Figure 2
Differentially expressed genes in the DBA/1 strain during collagen-induced arthritis (CIA)Differentially expressed genes in the DBA/1 strain during collagen-
induced arthritis (CIA). Three experimental conditions, post-immunisa-
tion (PI), onset of arthritis (OA) and chronic arthritis (CA), were com-
pared with naïve control (NC) to search for differentially expressed
genes. (a) Venn diagram indicating the number of overlapping genes
differentially expressed at three phases of CIA. (b) Hierarchical cluster-
ing of the 310 differentially expressed genes. The left panel shows the
distribution of relative gene expression across the hierarchical tree
structure. Rows represent individual genes; columns represent individ-
ual value of triplicate samples for each experimental group. Each cell in
the matrix represents the expression level of a gene, with red and green
indicating transcription levels above and below the normal values for
that gene, respectively. Four sample groups are indicated above the
expression matrix. Six basic gene clusters (clusters I to VI) were yielded
by the analysis according to the gene expression pattern during CIA.
The expression patterns of the gene cluster are graphed and the major
biological activities for each cluster that were examined by functional
clustering analysis are indicated on the right.
Arthritis Research & Therapy Vol 9 No 1 Yu et al.
Page 6 of 9
(page number not for citation purposes)
classification analysis revealed that the functional cluster of
protein kinase cascade was significantly enriched in the 21
candidate genes. This functional cluster contained four genes,
including Mapk14, Mapk8ip3, Stat5a and Gna12.
Discussion
In this study, we attempted for the first time to identify small-
effect QTL in an F2 progeny. Small-effect QTL are defined as
those reaching the threshold value of P = 0.05 but that did not
reach the significant threshold value suggested by Lander and
Botstein [26]. Although not significant, there is evidence that
most of the eight small-effect QTL likely contain susceptibility
genes for CIA. First, we performed the linkage analysis in three
datasets, including all 290 F progeny, 76 C5+/+ F2 progeny
and 133 C5+/- F2 progeny. Five of the eight small-effect QTL
were identified in at least two datasets, suggesting that these
QTL are reproducible. Second, many QTL identified in the
present study overlap with arthritis QTL previously identified,
Table 3
Summary of the small-effect QTL candidate genes
Gene Chr. Position (Mb) Description Difference between DBA/1 and FVB/N strains Difference during CIA in DBA/1 strain
Phase Fold change
a
Phase Fold change
b
Steap4 5 7.9 STEAP family member 4 NC/PI/CA 12.9/7.1/-5.9 CA -8.3
Add1 5 33.6 Adducin 1 (alpha) NC/PI 5.1/3.3 CA -4.6
Wdr1 5 37.8 WD repeat domain 1 NC/PI/OA/CA 4.9/3.5/2.4/-3.2 CA -7.1
Cd38 5 43.1 CD38 antigen NC/PI 5.7/4.0 CA -3.6
Tgfbr3 5 106.2 Transforming growth factor,
beta receptor III
NC/PI/CA 8.7/6.9/-3.2 CA -3.9
Oas1a 5 120.1 2'-5' Oligoadenylate synthetase
1A
NC -2.5 OA 2.7
Baz1b 5 134.1 Bromodomain adjacent to zinc
finger domain, 1B
NC/PI 5.9/5.7 CA -6.7
Lfng 5 139.5 Lunatic fringe gene NC/PI/OA 8.8/4.6/2.5 CA -7.7
Gna12 5 139.7 Guanine nucleotide binding
protein, alpha 12
NC/PI/OA 4.1/3.7/3.3 CA -3.5
8430419L09Rik 6 135.2 RIKEN cDNA 8430419L09
gene
NC/PI/OA 17.8/12.8/3.3 CA -4.2
Etnk1 6 143.2 Ethanolamine kinase 1 NC/PI/OA 4.6/3.9/2.6 CA -5.6
Nnp1 10 78.05 Novel nuclear protein 1 NC 3.0 CA -3.5
Kpnb1 11 97.2 Karyopherin (importin) beta 1 NC/PI/OA/CA 12.1/7.3/3.2/-20 CA -50
Stat5a 11 100.9 Signal transducer and activator
of transcription 5A
NC/PI 5.3/3.0 CA -4.6
Pscd1 11 118.2 Pleckstrin homology, Sec7 and
coiled-coil domains 1
NC/PI/OA/CA 4.7/3.6/2.4/-4 CA -11
Mapk8ip3 17 23.07 Mitogen-activated protein
kinase 8 interacting protein 3
NC/PI 3.9/2.5 CA -3.1
Mapk14 17 26.8 Mitogen activated protein
kinase 14
NC/PI/OA/CA 9.1/4.7/3.1/-14 CA -33.3
A430107D22Rik 17 30.5 RIKEN cDNA A430107D22
gene
NC 3.7 CA -5
Hspa1a 17 33 Heat shock protein 1A PI/CA -3.8/-4.6 PI/OA 3.8/5.4
H2-Q10 17 33.5 Histocompatibility 2, Q region
locus 10
NC/PI/OA/CA 3.3/4.2/2.5/5.3 CA -3
Gabbr1 17 35.1 Gamma-aminobutyric acid
receptor 1
NC/PI 4.9/2.5 CA -6.3
a
Fold change calculated by comparing DBA/1 with FVB/N.
b
Fold change calculated by comparing post-immunisation (PI), onset of arthritis (OA)
and chronic arthritis (CA) with naive control (NC), respectively. Chr., chromosome; CIA, collagen-induced arthritis.
Available online />Page 7 of 9
(page number not for citation purposes)
including loci 1, 2, 5 and 6. In addition, syntenic analysis
revealed that the counterpart genomic regions on the human
genome of many of these eight QTL are linked to RA.
For five of the eight small-effect QTL the DBA/1 alleles are the
arthritis-enhancing alleles, while the FVBN alleles are the
arthritis-enhancing alleles in the other three QTL, indicating
that some susceptibility genes could come from the resistant
strain. Interestingly, loci 2 and 7 partially overlap with two
arthritis-related QTL identified by us in the same F2 progeny
[10]. Locus 2 was located at the same genomic region as
Cia27, a QTL controlling IgG2a antibody levels to collagen II.
Recently, we have refined this QTL into a 4.1 Mb genomic
region and showed that a gene within this region regulates
CIA severity by controlling the IgG2a antibody levels to colla-
gen II [31]. Locus 7 on chromosome 16 overlaps with Lp1,
which controls lymphocyte proliferation. Furthermore, accord-
ing to our unpublished data, loci 8 on chromosome 17
controls lymphocyte adherence during development of CIA.
Therefore, the gene within the small-effect QTL could affect
CIA severity through controlling arthritis-related phenotypes.
Several studies have been carried out to detect gene expres-
sion during CIA, all of which used joints as the target tissue
[15,16,21,22]. This study, for the first time, detected gene
expression in LNs during CIA. We present an extensive study
of gene expression patterns in LNs of both genetically suscep-
tible and resistant strains at four different phases of CIA. In
both strains, differentially regulated genes were highly concen-
trated at the PI and CA phases, and only a small number of
genes were differentially expressed in two or three phases.
This indicates that biological responses in LNs were stronger
in the PI and CA phases than in the OA phase, and the
responses at different phases were different. When compar-
ing the susceptible to the resistant strain, the biggest differ-
ence was found in one cluster of genes (cluster IV, Figure 2).
These genes had a higher expression in DBA/1 than in FVB/N
at the early phases of CIA (NC, PI and OA) and the opposite
expression pattern in the CA phase. GO term classification
revealed that these genes were related to lymphocyte prolifer-
ation and activation, suggesting that lymphocytes in the DBA/
1 strain are more activated than those in the FVB/N strain.
However, this difference is not CIA specific because the
expression difference between the two strains existed in mice
without immunisation. Additionally, some genes related to the
immune response were upregulated in the DBA/1 strain but
not in the FVB/N strain during CIA. These differences could
explain why a higher antibody response to collagen II occurred
in the DBA/1 strain compared to the FVB/N strain, and might
partially explain the difference of the susceptibility to CIA
between both strains.
Twenty-one genes were identified as potential candidate
genes for six of the eight small-effect QTL according to their
gene expression patterns during CIA and their genomic loca-
tions. No candidate genes were located in QTL 4 and 7, sug-
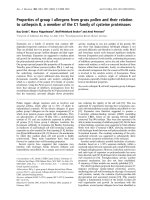
Figure 3
Visualisation of all the chromosomal locations of the small-effect QTL identified in this study (blue bar) as well as 120 genes of interest from gene expression profiling (black letters)Visualisation of all the chromosomal locations of the small-effect QTL identified in this study (blue bar) as well as 120 genes of interest from gene
expression profiling (black letters). The positions of the 120 genes and the peak markers of the QTL were retrieved from Ensembl [30]. Confidence
intervals of all the QTL were set as 40 Mb.
Arthritis Research & Therapy Vol 9 No 1 Yu et al.
Page 8 of 9
(page number not for citation purposes)
gesting that QTG polymorphisms of the susceptibility genes
inside these two QTL might not affect the phenotype by regu-
lating gene expression. Two of the 21 candidate genes were
reported to be involved in arthritis. Mapk14, a candidate gene
for locus 8 and also called p38 mitogen-activated protein
kinase (MAPK) alpha, regulates the production of arthritis-
essential cytokines, such as tumour necrosis factor and inter-
leukin-1 [32]. Moreover, inhibitors of p38 MAPK could attenu-
ate CIA in rats [33], and p38 MAPK is becoming a potential
therapeutic target in RA [32]. Stat5a, a candidate gene for loci
6, is an essential molecule for lymphoid development and dif-
ferentiation [34]. Stat5a-deficient mice were reported to lose
tolerance, resulting in the development of autoimmune dis-
eases. Stat5a is suggested to contribute to tolerance through
maintenance of the CD4+CD25+ regulatory T cell population
[35].
Therefore, we have presented a strategy to identify small-
effect QTL and search for potential candidate genes within
them. However, it is noteworthy that the low statistical
threshold and small number of animals per group could lead to
some false positive results. On the genome level, some of the
eight small-effect QTL identified using a very low threshold
value (P < 0.05) could be false positives. For example, locus
4 was identified with a low P value and does not overlap with
any previously identified arthritis QTL. On the transcriptome
level, the small number of animals per group and the low
threshold used to detect gene expression could also result in
false positives in the differentially expressed genes. Further-
more, the differential expression of a gene could result not only
from allele difference between two strains, but also from other
factors. Therefore, our findings should be confirmed in future
studies.
Conclusion
We present a strategy to search candidate genes for small-
effect QTL. With this strategy, we identified 21 candidate
genes for 8 small-effect QTL regulating CIA susceptibility. Our
future studies will be carried out using two approaches. The
first is generating congenic animals for promising small-effect
QTL that have relatively high P values and overlap with previ-
ously-identified arthritis QTL. The second approach is investi-
gating candidate genes using both mouse and human studies.
Candidate genes will be selected according to their function
and polymorphism between the two strains. Thereafter, we will
generate knock-out mice to investigate the role of the genes in
CIA. For the loci whose counterparts on the human genome
are linked to RA, we will investigate the candidate genes using
case-control association studies in RA cohorts.
Competing interests
The authors declare that they have no competing interests.
Authors' contributions
XY and KB performed the animal experiments. DK and HJT
performed gene expression profiling experiments. XY and DK
performed the bioinformatic analysis. SI conceived and
designed the experiment. XY and SI drafted the manuscript.
All authors read and approved the final manuscript.
Additional files
Acknowledgements
The authors wish to thank Ilona Klamfuss for animal care. This work was
supported by a grant from the EU FP6 (MRTN-CT-2004-005693,
EURO-RA).
References
1. Amos CI, Chen WV, Lee A, Li W, Kern M, Lundsten R, Batliwalla
F, Wener M, Remmers E, Kastner DA, et al.: High-density SNP
The following Additional files are available online:
Additional file 1
Summary information on the 509 genes differentially
expressed between DBA/1 and FVB/N strains.
Comparison was performed between two strains at four
stages of CIA, NA, PI, OA and CA. Three criteria were
applied for selecting the differentially expressed genes:
the lower 90% confidence bound of fold change
between the group means exceeded twofold; the
absolute difference between the two groups exceeded
100; the P value threshold of the unpaired t-test was
0.05
See />supplementary/ar2108-S1.xls
Additional file 2
Summary information on the 311 genes differentially
expressed in joints in the DBA/1 strain during CIA.
Pairwise comparisons were performed by comparing PI,
OA and CA with NA. Three criteria were applied for
selecting the differentially expressed genes: the lower
90% confidence bound of fold change between the
group means exceeded twofold; the absolute difference
between the two groups exceeded 100; the P value
threshold of the unpaired t-test was 0.05
See />supplementary/ar2108-S2.xls
Additional file 3
Summary information on the 117 genes that were strain-
specific differentially expressed and were dysregulated
in the DBA/1 strain during CIA. The physical positions of
the genes were retrieved from Ensembl [30]
See />supplementary/ar2108-S3.xls
Available online />Page 9 of 9
(page number not for citation purposes)
analysis of 642 Caucasian families with rheumatoid arthritis
identifies two new linkage regions on 11p12 and 2q33. Genes
Immun 2006, 7:277-286.
2. Cornelis F, Faure S, Martinez M, Prud'homme JF, Fritz P, Dib C,
Alves H, Barrera P, de Vries N, Balsa A, et al.: New susceptibility
locus for rheumatoid arthritis suggested by a genome-wide
linkage study. Proc Natl Acad Sci USA 1998, 95:10746-10750.
3. Jawaheer D, Seldin MF, Amos CI, Chen WV, Shigeta R, Monteiro
J, Kern M, Criswell LA, Albani S, Nelson JL, et al.: A genomewide
screen in multiplex rheumatoid arthritis families suggests
genetic overlap with other autoimmune diseases. Am J Hum
Genet 2001, 68:927-936.
4. Jawaheer D, Seldin MF, Amos CI, Chen WV, Shigeta R, Etzel C,
Damle A, Xiao X, Chen D, Lum RF, et al.: Screening the genome
for rheumatoid arthritis susceptibility genes: a replication
study and combined analysis of 512 multicase families. Arthri-
tis Rheum 2003, 48:906-916.
5. Choi SJ, Rho YH, Ji JD, Song GG, Lee YH: Genome scan meta-
analysis of rheumatoid arthritis. Rheumatology (Oxford) 2006,
45:166-170.
6. Gregersen PK, Silver J, Winchester RJ: Genetic susceptibility to
rheumatoid arthritis and human leukocyte antigen class II pol-
ymorphism. The role of shared conformational determinants.
Am J Med 1988, 85:17-19.
7. Suzuki A, Yamada R, Chang X, Tokuhiro S, Sawada T, Suzuki M,
Nagasaki M, Nakayama-Hamada M, Kawaida R, Ono M, et al.:
Functional haplotypes of PADI4, encoding citrullinating
enzyme peptidylarginine deiminase 4, are associated with
rheumatoid arthritis. Nat Genet 2003, 34:395-402.
8. Kochi Y, Yamada R, Suzuki A, Harley JB, Shirasawa S, Sawada T,
Bae SC, Tokuhiro S, Chang X, Sekine A, et al.: A functional vari-
ant in FCRL3, encoding Fc receptor-like 3, is associated with
rheumatoid arthritis and several autoimmunities [erratum
appears in Nat Genet 2005, 37:652]. Nat Genet 2005,
37:478-485.
9. Begovich AB, Carlton VE, Honigberg LA, Schrodi SJ, Chokkalin-
gam AP, Alexander HC, Ardlie KG, Huang Q, Smith AM, Spoerke
JM, et al.: A missense single-nucleotide polymorphism in a
gene encoding a protein tyrosine phosphatase (PTPN22) is
associated with rheumatoid arthritis. Am J Hum Genet 2004,
75:330-337.
10. Bauer K, Yu X, Wernhoff P, Koczan D, Thiesen HJ, Ibrahim SM:
Identification of new quantitative trait loci in mice with colla-
gen-induced arthritis. Arthritis Rheum 2004, 50:3721-3728.
11. Todd JA, Aitman TJ, Cornall RJ, Ghosh S, Hall JR, Hearne CM,
Knight AM, Love JM, McAleer MA, Prins JB, et al.: Genetic analy-
sis of autoimmune type 1 diabetes mellitus in mice. Nature
1991, 351:542-547.
12. Korstanje R, Paigen B: From QTL to gene: the harvest begins.
Nat Genet 2002, 31:235-236.
13. Flint J, Valdar W, Shifman S, Mott R: Strategies for mapping and
cloning quantitative trait genes in rodents. Nat Rev Genet
2005, 6:271-286.
14. Glazier AM, Nadeau JH, Aitman TJ: Finding genes that underlie
complex traits. Science 2002, 298:2345-2349.
15. Thornton S, Sowders D, Aronow B, Witte DP, Brunner HI, Giannini
EH, Hirsch R: DNA microarray analysis reveals novel gene
expression profiles in collagen-induced arthritis. Clin Immunol
2002, 105:155-168.
16. Ibrahim SM, Koczan D, Thiesen HJ: Gene-expression profile of
collagen-induced arthritis. J Autoimmun 2002, 18:159-167.
17. Heller RA, Schena M, Chai A, Shalon D, Bedilion T, Gilmore J,
Woolley DE, Davis RW: Discovery and analysis of inflammatory
disease-related genes using cDNA microarrays. Proc Natl
Acad Sci USA 1997, 94:2150-2155.
18. Bovin LF, Rieneck K, Workman C, Nielsen H, Sorensen SF, Skjodt
H, Florescu A, Brunak S, Bendtzen K: Blood cell gene expres-
sion profiling in rheumatoid arthritis. Discriminative genes and
effect of rheumatoid factor. Immunol Lett 2004, 93:217-226.
19. Devauchelle V, Marion S, Cagnard N, Mistou S, Falgarone G,
Breban M, Letourneur F, Pitaval A, Alibert O, Lucchesi C, et al.:
DNA microarray allows molecular profiling of rheumatoid
arthritis and identification of pathophysiological targets.
Genes Immunity 2004, 5:597-608.
20. Batliwalla FM, Baechler EC, Xiao X, Li W, Balasubramanian S,
Khalili H, Damle A, Ortmann WA, Perrone A, Kantor AB, et al.:
Peripheral blood gene expression profiling in rheumatoid
arthritis. Genes Immunity 2005, 6:388-397.
21. Gierer P, Ibrahim S, Mittlmeier T, Koczan D, Moeller S, Landes J,
Gradl G, Vollmar B: Gene expression profile and synovial
microcirculation at early stages of collagen-induced arthritis.
Arthritis Res Ther 2005, 7:R868-R876.
22. Adarichev VA, Vermes C, Hanyecz A, Mikecz K, Bremer EG, Glant
TT: Gene expression profiling in murine autoimmune arthritis
during the initiation and progression of joint inflammation.
Arthritis Res Ther 2005, 7:R196-R207.
23. Manly KF, Cudmore RH Jr, Meer JM: Map Manager QTX, cross-
platform software for genetic mapping. Mamm Genome 2001,
12:930-932.
24. Li C, Wong WH: Model-based analysis of oligonucleotide
arrays: expression index computation and outlier detection.
Proc Natl Acad Sci USA 2001, 98:31-36.
25. Wang Y, Kristan J, Hao L, Lenkoski CS, Shen Y, Matis LA: A role
for complement in antibody-mediated inflammation: C5-defi-
cient DBA/1 mice are resistant to collagen-induced arthritis. J
Immunol 2000, 164:4340-4347.
26. Lander ES, Botstein D: Mapping mendelian factors underlying
quantitative traits using RFLP linkage maps. Genetics 1989,
121:185-199.
27. Adarichev VA, Valdez JC, Bardos T, Finnegan A, Mikecz K, Glant
TT: Combined autoimmune models of arthritis reveal shared
and independent qualitative (binary) and quantitative trait loci.
J Immunol 2003, 170:2283-2292.
28. Yang HT, Jirholt J, Svensson L, Sundvall M, Jansson L, Pettersson
U, Holmdahl R: Identification of genes controlling collagen-
induced arthritis in mice: striking homology with susceptibility
loci previously identified in the rat. J Immunol 1999,
163:2916-2921.
29. Otto JM, Chandrasekeran R, Vermes C, Mikecz K, Finnegan A,
Rickert SE, Enders JT, Glant TT: A genome scan using a novel
genetic cross identifies new susceptibility loci and traits in a
mouse model of rheumatoid arthritis. J Immunol
2000,
165:5278-5286.
30. Ensembl [
]
31. Yu X, Bauer K, Wernhoff P, Koczan D, Moller S, Thiesen HJ, Ibra-
him SM: Fine mapping of collagen-induced arthritis quantita-
tive trait loci in an advanced intercross line. J Immunol 2006,
177:7042-7049.
32. Kumar S, Boehm J, Lee JC: p38 MAP kinases: key signalling
molecules as therapeutic targets for inflammatory diseases.
Nat Rev Drug Discov 2003, 2:717-726.
33. Nishikawa M, Myoui A, Tomita T, Takahi K, Nampei A, Yoshikawa
H: Prevention of the onset and progression of collagen-
induced arthritis in rats by the potent p38 mitogen-activated
protein kinase inhibitor FR167653. Arthritis Rheum 2003,
48:2670-2681.
34. Yao Z, Cui Y, Watford WT, Bream JH, Yamaoka K, Hissong BD, Li
D, Durum SK, Jiang Q, Bhandoola A, et al.: Stat5a/b are essential
for normal lymphoid development and differentiation. Proc
Natl Acad Sci USA 2006, 103:1000-1005.
35. Snow JW, Abraham N, Ma MC, Herndier BG, Pastuszak AW,
Goldsmith MA: Loss of tolerance and autoimmunity affecting
multiple organs in STAT5A/5B-deficient mice. J Immunol
2003, 171:5042-5050.