Báo cáo y học: "Knee meniscal extrusion in a largely non-osteoarthritic cohort: association with greater loss of cartilage volume" pps
Bạn đang xem bản rút gọn của tài liệu. Xem và tải ngay bản đầy đủ của tài liệu tại đây (242.34 KB, 8 trang )
Open Access
Available online />Page 1 of 8
(page number not for citation purposes)
Vol 9 No 2
Research article
Knee meniscal extrusion in a largely non-osteoarthritic cohort:
association with greater loss of cartilage volume
Changhai Ding
1
, Johanne Martel-Pelletier
2
, Jean-Pierre Pelletier
2
, François Abram
3
, Jean-
Pierre Raynauld
2
, Flavia Cicuttini
4
and Graeme Jones
1
1
Menzies Research Institute, University of Tasmania, 199 Macquarie Street, Hobart 7000, Australia
2
Osteoarthritis Research Unit, University of Montreal Hospital Centre, Notre-Dame Hospital, 1560 Sherbrooke St East, Montreal H2L 4M1, Canada
3
ArthroVision Inc., 1871 rue Sherbrooke Est, Montreal H2K 1B6, Canada
4
Department of Epidemiology and Preventive Medicine, Monash University Medical School, Commercial Road, Melbourne 3181, Australia
Corresponding author: Changhai Ding,
Received: 31 Oct 2006 Revisions requested: 12 Jan 2007 Revisions received: 30 Jan 2007 Accepted: 2 Mar 2007 Published: 2 Mar 2007
Arthritis Research & Therapy 2007, 9:R21 (doi:10.1186/ar2132)
This article is online at: />© 2007 Ding et al.; licensee BioMed Central Ltd.
This is an open access article distributed under the terms of the Creative Commons Attribution License ( />),
which permits unrestricted use, distribution, and reproduction in any medium, provided the original work is properly cited.
Abstract
We conducted a longitudinal study (duration 2 years), including
294 individuals (mean age 45 years, 58% female), in order to
examine associations between meniscal extrusion, knee
structure, radiographic changes and risk factors for
osteoarthritis (OA) in a largely non-osteoarthritic cohort.
Meniscal extrusion, tibiofemoral cartilage defect score and
cartilage volume, and tibial plateau bone area were determined
using T1-weighted fat-saturated magnetic resonance imaging.
At baseline the presence of medial meniscal extrusion was
significantly associated with body mass index (odds ratio [OR]
per kg/m
2
= 1.13, 95% confidence interval [CI] = 1.02–1.25),
past knee injury (positive versus negative history: OR = 3.73,
95% CI = 1.16–11.97), medial tibial bone area (OR per cm
2
=
1.37, 95% CI = 1.02–1.85), and osteophytes (OR per grade =
4.89, 95% CI = 1.59–15.02). Two-year longitudinal data
revealed that medial meniscal extrusion at baseline was
associated with a greater rate of loss of medial tibiofemoral
cartilage volume (extrusion versus no extrusion: -1.4%/year; P <
0.05) and greater risk for increased medial femoral cartilage
defects (OR = 2.59, 95% CI = 1.14–5.86) and lateral tibial
cartilage defects (OR = 2.64, 95% CI = 1.03–6.76). However,
the latter two associations became nonsignificant after
adjustment for tibial bone area and osteophytes. This study
suggests that increasing body mass index and bone size, past
knee injury, and osteophytes may be causally related to meniscal
extrusion. Most importantly, meniscal extrusion at baseline is
associated with greater loss of knee cartilage over 2 years, and
this seems to be mediated mostly by subchondral bone
changes, suggesting extrusion represents one pathway
between bone expansion and cartilage loss.
Introduction
Knee osteoarthritis (OA) is a common chronic disease that is
characterized by whole-organ abnormalities [1], including car-
tilage lesion and loss, osteophytes, synovial and subchondral
bone alterations, and meniscal tears and extrusion. Meniscal
extrusion is where the meniscus is partially or totally displaced
away from or uncovers the tibial articular cartilage [2]. It has
been suggested that significant meniscal extrusion, as seen on
magnetic resonance imaging (MRI), occurs more often in
patients with knee OA than in normal control individuals, either
because it causes the OA or because laxity of supporting
meniscal structures associated with OA predisposes these
patients to meniscal extrusion [2]. Meniscal extrusion has been
found to be associated with joint space narrowing [2,3], oste-
ophytosis [4,5], the presence of a chondral lesion [6] and
meniscal tear [5,7,8] in cross-sectional studies. Longitudinal
studies have confirmed that meniscal extrusion is associated
with loss of cartilage volume [7,9] and knee cartilage focal loss
[10], as determined by MRI. However, most of these studies
were conducted in patients with OA, and there are few reports
about the relationship between meniscal extrusion and knee
structural change in persons without OA. Furthermore, associ-
ations between OA risk factors including age, body mass
index (BMI), female sex, knee injury, and genetics and menis-
cal extrusion are unclear, although a cross-sectional study [2]
BMI = body mass index; MRI = magnetic resonance imaging; OA = osteoarthritis.
Arthritis Research & Therapy Vol 9 No 2 Ding et al.
Page 2 of 8
(page number not for citation purposes)
suggested that meniscal extrusion did not correlate with age
and/or weight.
The aim of the present longitudinal study was to describe
associations between baseline meniscal extrusion and knee
structure, radiographic changes, and OA risk factors in a
largely non-OA cohort.
Materials and methods
Patients
The study was conducted in Tasmania, Australia, primarily in
the capital city of Hobart, from June 2000 until December
2001. Participants were selected from two sources. Approxi-
mately half were the adult children of patients who had under-
gone knee replacement for primary knee OA at any Hobart
hospital during the years from 1996 to 2000 (offspring: n =
186, age 45 years, 59% female). The parents' diagnosis was
confirmed by reference to medical records of the orthopaedic
surgeon and the original radiograph where possible. The other
participants were control individuals (n = 186; age 45 years,
57% female) selected at random from the electoral roll. Those
selected were eligible to participate if they had no parent with
either a history of symptomatic knee OA or a knee replacement
for OA. Individuals from either group were excluded on the
basis of contraindication to MRI (including metal sutures, pres-
ence of shrapnel, iron filings in the eye and claustrophobia).
This study was approved by the Southern Tasmanian Health
and Medical Human Research Ethics Committee, and all par-
ticipants provided informed written consent.
The characteristics of the participants were reported previ-
ously [11]. The follow-up study was conducted about 2 years
later (mean 2.3 years).
Anthropometrics
Weight was measured to the nearest 0.1 kg (with shoes,
socks and bulky clothing removed) using a set of electronic
scales (a single unit; Seca Delta, Model 707; Seca, Hamburg,
Germany) calibrated using a known weight at the beginning of
each clinic session. Height was measured to the nearest 0.1
cm (with shoes and socks removed) using a stadiometer.
Body mass index (BMI; kg/m
2
) was calculated.
Past knee injury
Our definition of past knee injury was documented in the ques-
tionnaire as follows: 'Have you had a previous knee injury
requiring non-weight-bearing treatment for more than 24
hours or surgery?'
Radiography
A standing anteroposterior semiflexed view of the right knee
(at 15° flexion) was performed in all participants at baseline
and scored individually for osteophytes and joint space nar-
rowing, as described previously [12]. Each of the following
four features was scored on a scale from 0 to 3 (0 = normal
and 3 = severe): medial joint space narrowing, lateral joint
space narrowing, medial osteophytes (femoral and tibial com-
bined) and lateral osteophytes (femoral and tibial combined).
Magnetic resonance imaging
Magnetic resonance imaging (MRI) of the right knee was per-
formed as described previously [13-15]. Knees were imaged
in the sagittal plane on a 1.5 T whole-body magnetic reso-
nance unit (Picker International, Cleveland, OH, USA) using a
commercial transmit-receive extremity coil. The following
image sequence was used: a T1-weighted fat saturation three-
dimensional gradient recall acquisition in the steady state; flip
angle 55°; repetition time 58 ms; echo time 12 ms; field of
view 16 cm; 60 partitions; 512 × 512 matrix; acquisition time
11 min 56 s; and one acquisition. Sagittal images were
obtained at a partition thickness of 1.5 mm and an in-plane res-
olution of 0.31 × 0.31 mm (512 × 512 pixels). The coronal and
axial views were then reformatted.
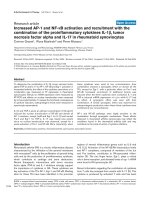
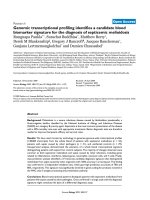
Meniscal extrusion assessment
The extent of meniscal extrusion (Figure 1) on the medial or lat-
eral edges of the tibial femoral joint space, not including the
osteophytes, was evaluated at baseline and at 2 years by two
observers for the anterior, body, and posterior horns of the
menisci. A score from 0 to 2 was employed, in which 0 = no
extrusion, 1 = partial meniscal extrusion, and 2 = complete
meniscal extrusion with no contact with the joint space. The
intra-reader and inter-reader correlation coefficient ranged
from 0.85 to 0.92 for the meniscal extrusion, as reported pre-
viously [7,9].
Knee cartilage volume, defects and bone area measurement
Knee cartilage volume, defects and bone area were evaluated
at baseline and 2 years by one observer (CD) who was blinded
to the meniscal assessment. Knee cartilage volume was deter-
mined by means of image processing on an independent
workstation at baseline and follow up. The volumes of individ-
ual cartilage plates (medial tibia and femora, and lateral tibia
and femora) were isolated from the total volume by manually
drawing dis-articulation contours around the cartilage bound-
aries on a section by section basis. These data were then resa-
mpled by means of bilinear and cubic interpolation (area of
312 × 312 μm by 1.5 mm thickness, continuous sections) for
the final three-dimensional rendering. The coefficients of varia-
tion were 2.1% to 2.2% [13] for tibial cartilage volume meas-
ures and were 1.2% to 2.6% [16] for femoral cartilage
measures. The percentage change in cartilage volume per
year was calculated as follows: (100 × [(cartilage volume at
follow up – cartilage volume at baseline)/cartilage volume at
baseline]/time between scans in years).
The cartilage defects (scale from 0 to 4) were graded by two
observers at medial tibial and femoral, and lateral tibial and
femoral sites, as previously described, with excellent repro-
ducibility [17]: grade 0 = normal cartilage; grade 1 = focal
Available online />Page 3 of 8
(page number not for citation purposes)
blistering and intracartilaginous low-signal intensity area with
an intact surface and bottom; grade 2 = irregularities on the
surface or bottom and loss of thickness of less than 50%;
grade 3 = deep ulceration with loss of thickness of more than
50%; and grade 4 = full-thickness chondral wear with expo-
sure of subchondral bone. Intraobserver reliability (expressed
as intraclass correlation coefficient) was 0.89 to 0.94 and
interobserver reliability was 0.85 to 0.93 [15,17]. Changes in
tibial and/or femoral cartilage defects were calculated by sub-
tracting tibial and/or femoral cartilage defect scores (0 to 4 or
0 to 8 scale) at baseline from tibial and/or femoral cartilage
defect scores (0 to 4 or 0 to 8 scale) at follow up.
The area of medial and lateral tibial plateau bone was meas-
ured manually on the three reformatted images closest to tibial
cartilage. An average of these three areas was used as an esti-
mate of the tibial plateau bone area [12,15]. The coefficients
of variation for these measures range from 2.2% to 2.6% [13].
Data analysis
Unpaired t-test or χ
2
test was utilized for comparison of means
or frequencies. Multiple logistic regression analysis was used
to examine the associations between the presence or absence
of medial meniscal extrusion at baseline and age, sex, family
history of OA, past knee injury, BMI, tibial cartilage volume,
cartilage defect scores, tibial bone area, radiographic assess-
ment, and change in cartilage defect score before and after
adjustment for confounders. Linear regression was utilized to
examine the associations between change in cartilage volume
and presence of medial meniscal extrusion at baseline before
and after adjustment for confounders. A P value less than 0.05
(two-tailed) was considered statistically significant. All statisti-
cal analyses were performed on SPSS version 12.0 for Win-
dows (SPSS Inc., Chicago, IL, USA).
Results
A total of 325 individuals (58% female) completed the study,
with a response rate of 87%. The reasons for loss to follow up
(and number of individuals) were as follows: deceased (two);
moved interstate (five); claustrophobic (three); and illness
(four) and others (no reason). Meniscal extrusion was meas-
ured in the first 294 participants (58% female; offspring n =
135, control individuals n = 159) at both baseline (79% of all
participants) and follow up (90% of all participants). There
were no significant differences in demographic or structural
factors between the whole cohort and the individuals who
were not included (data not shown).
Meniscal extrusion was found at baseline in 23 participants,
with 21 (7% of the total population) at the medial compartment
(17 partial at the body site, one partial at body and anterior
horn site, and three complete at body site) and two (0.7%) at
the lateral compartment (one partial body site and one com-
plete body site). Medial meniscal extrusion was present in 4%
of individuals without any radiographic changes (n = 242) but
in 21% of those with radiographic changes (n = 52; P <
0.001). There was no difference in presence of medical menis-
cal extrusion between control individuals without a family his-
tory of OA (6%) and offspring with a family history of OA (9%;
P = 0.28).
Over 2 years, meniscal extrusion developed in only four partic-
ipants (1.4%; all at the body site in the medial compartment);
their mean age was 47 years (range 41 to 54 years) and mean
BMI was 32 kg/m
2
(range 26 to 45 kg/m
2
). Three of these four
individuals were women; three were offspring of patients with
severe knee OA, and one had a past knee injury. Because of
the small sample size (n = 4), the precise reasons for the
occurrence of a new meniscal extrusion could not be
determined.
The characteristics of the participants are presented in Table
1. The data show that the participants with and those without
medial meniscal extrusion were similar in terms of age, sex,
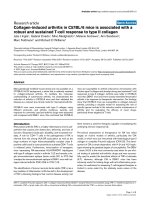
Figure 1
Representations of meniscal extrusion as seen using magnetic reso-nance imagingRepresentations of meniscal extrusion as seen using magnetic reso-
nance imaging. Human knee medial compartment: (a) and (b) sagittal
views, and (c) reconstructed coronal view. Partial and total meniscal
extrusion at the anterior horn are shown in panels a and b, respectively.
Panel c shows a partial (> 50%) meniscal extrusion at the body site.
Arthritis Research & Therapy Vol 9 No 2 Ding et al.
Page 4 of 8
(page number not for citation purposes)
family history of OA, height, prevalence of knee pain, baseline
cartilage volume, and change in tibial bone area. However,
compared with participants with no medial meniscal extrusion,
the following parameters were greater in those with meniscal
extrusion: BMI, weight, proportion of past knee injury, tibial
bone area at baseline, medial tibiofemoral cartilage defect
score, prevalence of radiographic OA, medial joint space nar-
rowing and osteophytes at baseline, loss of medial tibial carti-
lage volume, and progression of tibiofemoral cartilage defect
score.
Age, sex and family history of OA were not significantly asso-
ciated with baseline medial meniscal extrusion in both univari-
able and multivariable analyses (Table 2). However, BMI,
weight, obesity and our definition of past knee injury were sig-
nificantly associated with baseline medial meniscal extrusion,
Table 1
Characteristics of subjects with and without baseline medial meniscal extrusion
Characteristic Meniscal extrusion at baseline P value
Negative (n = 273) Positive (n = 21)
Age (years) 45.0 (6.6) 47.2 (5.4) 0.148
Sex (female [%]) 59 43 0.150*
Family history of OA (positive [%]) 45 57 0.284*
Height (cm) 169.0 (8.5) 172.1 (8.2) 0.102
Weight (kg) 76.6 (14.6) 92.7 (21.5) < 0.001
BMI (kg/m
2
) 26.8 (4.5) 31.3 (7.0) < 0.001
Knee pain (%) 33 38 0.665*
Obese (%) 18 52 < 0.001*
Past knee injury (%) 19 38 0.037*
Medial tibial cartilage volume (ml) 2.2 (0.5) 2.4 (0.5) 0.051
Lateral tibial cartilage volume (ml) 2.6 (0.7) 2.7 (0.6) 0.408
Medial femoral cartilage volume (ml) 4.6 (1.3) 4.7 (1.0) 0.632
Lateral femoral cartilage volume (ml) 4.7 (1.3) 5.1 (1.0) 0.280
Medial tibial bone area (cm
2
) 17.3 (2.6) 19.8 (3.8) < 0.001
Lateral tibial bone area (cm
2
) 11.9 (2.0) 13.5 (2.5) 0.001
Medial tibiofemoral cartilage defect (0–8) 2.0 (0.6) 3.1 (1.4) < 0.001
Lateral tibiofemoral cartilage defect (0–8) 2.0 (0.7) 2.1 (0.7) 0.550
Any radiographic osteoarthritis (%) 15 52 < 0.001*
Medial joint space narrowing (%) 13 38 0.001*
Medial osteophytes (%) 4 43 < 0.001*
Lateral joint space narrowing (%) 3 5 0.737*
Lateral osteophytes (%) 3 14 < 0.001*
Change in medial tibial cartilage volume (%) -2.4 (4.1) -4.7 (4.4) 0.015
Change in lateral tibial cartilage volume (%) -1.5 (3.4) -1.6 (3.8) 0.860
Change in medial femoral cartilage volume (%) -3.3 (2.6) -4.1 (3.9) 0.278
Change in lateral femoral cartilage volume (%) -3.3 (2.5) -3.5 (3.1) 0.662
Change in medial tibial bone area (%) +0.7 (1.8) +0.2 (1.7) 0.258
Change in lateral tibial bone area (%) +0.3 (2.8) +0.5 (2.4) 0.781
Change in medial tibiofemoral cartilage defect -0.07 (0.86) 0.29 (1.06) 0.074
Change in lateral tibiofemoral cartilage defect -0.02 (0.81) 0.50 (1.20) 0.007
Values are expressed as mean (standard deviation), except for percentage. *χ
2
test; all others t-test. BMI, body mass index; OA, osteoarthritis.
Available online />Page 5 of 8
(page number not for citation purposes)
even after adjustment for confounders (Table 2). Specifically,
medial meniscal extrusion occurred in 18% of obese partici-
pants (BMI = 30 kg/m
2
; n = 61) versus 4% of nonobese par-
ticipants (BMI < 30 kg/m
2
; n = 233), and 13% of those with
past knee injury (n = 60) versus 6% of those without past knee
injury (n = 234). Moreover, baseline medial meniscal extrusion
was significantly associated with medial tibial bone area and
medial osteophytes, but was not associated with medial tibial
cartilage volume both in univariable and multivariable analyses.
It was associated with medial joint space narrowing (19% ver-
sus 5% medial meniscal extrusion in participants with and
without medial joint space narrowing) before (Table 2) and
after adjustment for age, sex, family history of OA, BMI, our
definition of past knee injury and baseline medial tibial carti-
lage volume (odds ratio = 3.86; P = 0.021), but this associa-
tion became nonsignificant after further adjustment for tibial
bone area and osteophytes (Table 2).
Data from Table 3 show that baseline medial meniscal extru-
sion was significantly associated with baseline medial tibial,
femoral and tibiofemoral cartilage defect scores after adjust-
ment for age, sex, family history of OA, BMI, past knee injury
and change in cartilage defect scores, and with change in
medial femoral and lateral tibial cartilage defect scores after
adjustment for age, sex, OA family history, BMI, past knee
injury, and baseline cartilage defect scores (Table 3).
However, these associations again became nonsignificant
after further adjustment for baseline tibial bone area and oste-
ophytes (Table 3).
Prevalent medial meniscal extrusion at baseline was signifi-
cantly associated with subsequent rate of change in medial
femoral and tibiofemoral cartilage volume after adjustment for
the confounders (Table 4). In contrast, medial meniscal
extrusion at baseline was significantly associated with change
in medial tibial cartilage volume in univariable analysis (Table
4), but this association became nonsignificant after adjust-
ment for other factors, mostly contributed by BMI and baseline
cartilage volume (β = -1.41%; P = 0.128).
Discussion
To our knowledge, this is the first time that associations of
meniscal extrusion with knee structural changes and risk fac-
tors in a largely non-OA cohort have been documented. As
may be expected for such individuals, the prevalence of menis-
cal extrusion was low, predominantly involving partial extru-
sion. Medial meniscal extrusion was significantly associated
with BMI, past knee injury and tibial bone area, as well as with
osteophytes and medial tibiofemoral cartilage defect scores.
Over 2 years, those with medial meniscal extrusion exhibited
greater loss of medial tibiofemoral cartilage volume and
greater increase in medial femoral and lateral tibial cartilage
defect score than did those without medial meniscal extrusion.
The association between meniscal extrusion and knee carti-
lage defects became nonsignificant after adjustment for bone
area and/or osteophytes, suggesting that extrusion may repre-
sent one pathway between bone expansion and cartilage loss.
In this largely non-OA cohort, medial and lateral meniscal
extrusion occurred in 7% and 0.7% of individuals, respec-
tively, and medial meniscal extrusion developed in 1.4% over
2 years. These prevalence rates are similar to those observed
in normal individuals [4] and those with knee pain [18], but far
less than those observed in patients with either symptomatic
Table 2
Factors associated with baseline medial meniscus extrusion
Factor Univariable (OR [95% CI]) Multivariable
a
(OR [95% CI]) P value
Age (per year) 1.06 (0.98–1.13) 1.03 (0.94–1.13) 0.579
Sex (female versus male) 0.52 (0.21–1.28) 3.67 (0.65–20.80) 0.141
OA family history (+ versus -) 1.63 (0.66–3.99) 0.65 (0.21–2.02) 0.452
BMI (per unit) 1.16 (1.07–1.25)* 1.13(1.02–1.25)* 0.019
Weight (per kg) 1.06 (1.03–1.09)* 1.04 (1.00–1.08)*
b
0.029
Obese (+ versus -) 4.90 (1.98–12.18)* 4.87 (1.59–14.92)*
c
0.006
Past knee injury (+ versus -) 2.62 (1.03–6.64)* 3.73 (1.16–11.97)* 0.027
Medial tibial cartilage volume (per ml) 2.06 (0.99–4.31) 1.52 (0.42–5.54) 0.527
Medial tibial bone area (per cm
2
) 1.35 (1.15–1.59)* 1.37 (1.02–1.85)* 0.038
Medial radiographic osteoarthritis (+ versus -) 6.88 (2.57–18.40)* 4.21 (1.25–14.21)* 0.021
Medial joint space narrowing (per grade) 4.27 (1.65–11.06)* 1.97 (0.56–6.87) 0.288
Medial osteophytes (per grade) 9.52 (3.49–25.97)* 4.89 (1.59–15.02)* 0.006
The dependent variable was medial meniscal extrusion.
a
Adjusted by factors listed in the table.
b
Adjusted for height and factors listed except for
body mass index (BMI).
c
Adjusted for factors listed except for BMI and weight. *Statistically significant associations. CI, confidence interval; OA,
osteoarthritis; OR, odds ratio.
Arthritis Research & Therapy Vol 9 No 2 Ding et al.
Page 6 of 8
(page number not for citation purposes)
or asymptomatic knee OA [2] and in nonadvanced arthritic
patients who underwent arthroscopy for other disorders [6].
The difference is most likely due to different disease status and
age group in the different cohorts. In the present study, individ-
uals with early radiographic changes had a greater prevalence
of medial meniscal extrusion than did those with no radio-
graphic changes.
Any factors that affect meniscal stability and structure may
cause meniscal extrusion. In this longitudinal study only four
participants developed partial meniscal extrusion over 2 years,
so we could not document any predictors of meniscal extru-
sion. However, cross-sectional data from this study show that
although age and family history of OA were not associated
with medial meniscal extrusion, our definition of past knee
injury and weight (body weight, BMI and obesity) were signifi-
cantly associated with prevalent medial meniscal extrusion.
Obese individuals had nearly a fivefold increased risk for hav-
ing meniscal extrusion than did nonobese individuals, and
those satisfying our definition of past knee injury had a nearly
fourfold increase in risk for having meniscal extrusion com-
Table 3
Associations between baseline medial meniscal extrusion and baseline cartilage defect score and change in cartilage defect score
over 2 years
Factor Multivariable
a
(OR [95% CI]) Multivariable
b
(OR [95% CI]) Multivariable
c
(OR [95% CI])
Baseline cartilage defect score
Medial tibial (0–4) 5.91 (2.53–13.77)* 3.41 (1.36–8.57)* 0.63 (0.17–2.32)
Medial femoral (0–4) 6.71 (2.65–16.99)* 4.62 (1.74–12.30)* 2.39 (0.71–8.02)
Medial tibiofemoral (0–8) 3.42 (1.92–6.10)* 2.45 (1.36–4.40)* 1.23 (0.59–2.53)
Lateral tibial (0–4) 1.52 (0.59–3.98) 0.97 (0.29–3.22) 0.20 (0.03–1.37)
Lateral femoral (0–4) 1.84 (0.78–4.34) 1.30 (0.45–3.74) 0.49 (0.12–2.05)
Lateral tibiofemoral (0–8) 1.33 (0.82–2.17) 1.13 (0.63–2.05) 0.55 (0.22–1.39)
Change in cartilage defect score
Medial tibial (0–4) 1.54 (0.57–4.13) 1.24 (0.45–3.44) 0.31 (0.07–1.42)
Medial femoral (0–4) 3.12 (1.50–6.49)* 2.59 (1.14–5.86)* 1.30 (0.51–3.35)
Medial tibiofemoral (0–8) 1.79 (1.06–3.03)* 1.56 (0.88–2.77) 0.85 (0.40–1.81)
Lateral tibial (0–4) 2.92 (1.25–6.79)* 2.64 (1.03–6.76)* 1.54 (0.48–4.95)
Lateral femoral (0–4) 2.30 (1.10–4.81)* 1.68 (0.74–3.79) 1.01 (0.39–2.67)
Lateral tibiofemoral (0–8) 2.01 (1.22–3.31)* 1.80 (1.05–3.08)* 1.21 (0.61–2.42)
The dependent variable was medial meniscal extrusion.
a
Adjusted for change in cartilage defect score if associations between baseline cartilage
defect scores and baseline meniscal extrusion were determined, or baseline cartilage defect score if associations between changes in cartilage
defect score and baseline meniscal extrusion were determined.
b
Further adjusted for age, sex, offspring/control status, body mass index and past
knee injury.
c
Further adjusted for baseline tibial bone area and osteophytes. *Statistically significant associations. CI, confidence interval; OR,
odds ratio.
Table 4
Associations between medial meniscal extrusion at baseline and change in cartilage volume over 2 years
Factor Univariable β (95% CI) Multivariable
a
β (95% CI) Multivariable
b
β (95% CI)
Medial tibial (%) -2.29 (-0.41 to -0.45)* -1.26 (-2.95 to +0.43) -1.01 (-2.88 to +0.86)
Medial femoral (%) -0.73 (-2.06 to +0.59) -0.87 (-2.23 to +0.49) -1.56 (-2.99 to -0.14)*
Medial tibiofemoral (%) -1.42 (-2.66 to -0.17)* -1.18 (-2.41 to +0.05) -1.44 (-2.76 to -0.12)*
Lateral tibial (%) -0.14 (-1.69 to +1.41) +0.43 (-1.09 to +1.94) +0.64 (-0.94 to +2.23)
Lateral femoral (%) -0.28 (-1.54 to +0.98) -0.34 (-1.62 to +0.94) -0.27 (-1.61 to +1.07)
Lateral tibiofemoral (%) -0.28 (-1.45 to +0.88) -0.07 (-1.22 to +1.09) +0.15 (-1.05 to +1.35)
The dependent variable was change in cartilage volume.
a
Adjusted for age, sex, offspring-control status, body mass index, past knee injury and
baseline cartilage volume.
b
Further adjusted for baseline tibial bone area and osteophytes. *Statistically significant associations. CI, confidence
interval.
Available online />Page 7 of 8
(page number not for citation purposes)
pared with those with no such history. These suggest that
obesity and past knee injury are major risk factors for meniscal
extrusion. It is possible that knee injury was in part caused by
chronic knee instability resulting from an overuse of secondary
stabilizers such as cruciate and collateral ligaments [19].
Moreover, women tended to be at greater risk for having
medial meniscal extrusion than did men in multivariable analy-
sis, although this did not reach statistical significance.
We have reported that tibial bone area and osteophytes are
strongly associated with prevalent knee cartilage defects [17]
and incident knee cartilage defects [15]. We found in this
study that medial tibial bone area and osteophytes were also
significantly associated with the prevalence of medial meniscal
extrusion, suggesting that subchondral bone expansion may
play an important role in the initiation not only of cartilage dam-
age [15,17] but also of meniscal extrusion. It is also possible
that meniscal extrusion can induce subchondral bone expan-
sion and osteophytes, because without the meniscus, which
functions as an energy absorber, the increased contact
between tibia and femur may contribute to remodelling of
bone. However, we found that baseline medial meniscal extru-
sion was not associated with change in tibial bone area (Table
1), suggesting that tibial bone area is not affected during the
early stages of meniscal extrusion.
With increasing meniscal extrusion, there may be increasing
contact stress on the tibial and femoral articular cartilage,
which theoretically might accelerate the development of carti-
lage damage. Berthiaume and coworkers [7] reported that OA
patients with severe medial meniscal tear had greater loss of
medial compartment cartilage volume than did those with no
medial meniscal tear over 2 years. Raynauld and coworkers [9]
further reported that severe meniscal extrusion was more prev-
alent (73%) in OA patients who experienced more rapid loss
of global knee cartilage volume, and severe medial meniscal
extrusion was found to be an independent predictor of loss of
medial compartment cartilage volume over 2 years. Hunter and
coworkers [10] reported that meniscal malposition was signif-
icantly associated with increased risk for focal cartilage loss
over 30 months in patients with symptomatic OA. Consistent
with these findings in patients with disease, in the present
study – conducted largely in individuals without OA – we
found medial meniscal extrusion to be significantly associated
with change in medial femoral and lateral tibial cartilage
defects over 2 years after adjustment for age, sex, BMI, family
history of OA and past knee injury. Furthermore, we found that
medial meniscal extrusion was significantly associated with
loss of medial tibiofemoral cartilage volume over 2 years after
adjustment for the above factors as well as bone changes.
Our data suggest that tibial bone area and osteophytes may
lead to meniscal extrusion, which in turn leads to joint space
narrowing on radiography and knee cartilage defects and tibial
cartilage loss. We found that meniscal extrusion was
significantly associated with joint space narrowing in the unad-
justed analysis and after adjustment for age, sex, OA family
history and BMI. This is consistent with previous findings
showing that meniscal extrusion (rather than meniscal com-
pression) contributes to joint space narrowing [2,3,9]. How-
ever, the association between meniscal extrusion and joint
space narrowing became nonsignificant after adjustment for
tibial bone area and osteophytes. This suggests that subchon-
dral bone changes leads to meniscal extrusion and joint space
narrowing. Consistent with this, after adjustment for tibial bone
area and osteophytes, the associations between meniscal
extrusion and prevalent and incident defects in knee cartilage
disappeared, and the association between meniscal extrusion
and tibial cartilage loss decreased in magnitude. This sug-
gests that meniscal extrusion is an intermediate variable on the
pathway between bone change and cartilage damage.
The study has a number of potential limitations. It was primarily
designed to examine genetic mechanisms of knee OA and uti-
lized a matched design. The matching protocol was not
adhered to in the present study, but adjustment for family his-
tory did not alter the results. Although the sample is a conven-
ience sample, Miettinen [20] stated that for associations to be
generalized to other populations, three key criteria including
selection (inclusion/exclusion criteria for both offspring and
controls are explicitly defined), sample size and adequate dis-
tribution of study factors need to be met, all of which are met
by this study. Second, we cannot confirm the cross-sectional
results in the longitudinal component of our study because of
the low incidence rate; hence, studies of longer term will be
required. Third, the amount of meniscal extrusion may be
underestimated on MRI scans because of non-weight bearing
knees and may have been more prevalent if the study had been
carried out under load conditions. Pathological patterns such
as joint laxity, axial deviation or varus-valgus deformity may also
influence the measured values under non-weight-bearing con-
ditions. Fourth, we asked all participants to wait for 15 min in
the waiting room before MRI scan, but we did not record the
intensity of load force and recovery time after running, walking,
or sitting. This may influence the measurement of cartilage vol-
ume. However, a recent study [21] showed that these moder-
ate activities had little impact on tibial and femoral cartilage
deformation in vivo in healthy individuals. A fifth limitation is
that our definition of past knee injury can be considered impre-
cise. However, we found in this study that it was significantly
associated with meniscal extrusion, suggesting that the defini-
tion has predictive validity. Finally, measurement error may
influence the results. However, scoring of meniscal extrusion,
knee cartilage defects, volume, bone size and tibiofemoral
radiographic score measurement was highly reproducible,
suggesting this is unlikely.
Conclusion
This study suggests that increasing BMI and bone size, past
knee injury, and osteophytes may be causally related to menis-
Arthritis Research & Therapy Vol 9 No 2 Ding et al.
Page 8 of 8
(page number not for citation purposes)
cal extrusion. Most importantly, meniscal extrusion at baseline
is associated with greater loss of knee cartilage over 2 years
and this association is mostly mediated by subchondral bone
changes, suggesting that extrusion represents one pathway
between bone expansion and cartilage loss.
Competing interests
The authors declare that they have no competing interests.
Authors' contributions
CD, GJ, JM-P, J-PP, J-PR and FC participated in the design of
the study. CD and FA carried out the measurement of cartilage
volume, cartilage defects, bone size and/or meniscal extrusion.
CD performed the statistical analysis and drafted the
manuscript. All authors reviewed the manuscript, and read and
approved the final manuscript.
Acknowledgements
We offer special thanks to the participants and orthopaedic surgeons
who made this study possible. The role of Catrina Boon in coordinating
the study is gratefully acknowledged. We should like to thank Martin
Rush, who performed the MRI scans; Kevin Morris, for technical sup-
port; and Josée Thériault and André Pelletier, for meniscal reading. Sup-
port for the present study was provided by the National Health and
Medical Research Council of Australia, Masonic Centenary Medical
Research Foundation, and ArthroVision, Montreal, Canada.
References
1. Martel-Pelletier J, Lajeunesse D, Pelletier J-P: Etiopathogenesis
of osteoarthritis. In Arthritis and Allied Conditions: A Textbook
of Rheumatology 15th edition. Edited by: Koopman WJ. Baltimore,
MA: Lippincott, Williams & Wilkins; 2005:2199-2226.
2. Gale DR, Chaisson CE, Totterman SM, Schwartz RK, Gale ME,
Felson D: Meniscal subluxation: association with osteoarthritis
and joint space narrowing. Osteoarthritis Cartilage 1999,
7:526-532.
3. Adams JG, McAlindon T, Dimasi M, Carey J, Eustace S: Contribu-
tion of meniscal extrusion and cartilage loss to joint space nar-
rowing in osteoarthritis. Clin Radiol 1999, 54:502-506.
4. Miller TT, Staron RB, Feldman F, Cepel E: Meniscal position on
routine MR imaging of the knee. Skeletal Radiol 1997,
26:424-427.
5. Lerer DB, Umans HR, Hu MX, Jones MH: The role of meniscal
root pathology and radial meniscal tear in medial meniscal
extrusion. Skeletal Radiol 2004, 33:569-574.
6. Puig L, Monllau JC, Corrales M, Pelfort X, Melendo E, Caceres E:
Factors affecting meniscal extrusion: correlation with MRI,
clinical, and arthroscopic findings. Knee Surg Sports Traumatol
Arthrosc 2006, 14:394-398.
7. Berthiaume MJ, Raynauld JP, Martel-Pelletier J, Labonte F, Beau-
doin G, Bloch DA, Choquette D, Haraoui B, Altman RD, Hochberg
M, et al.: Meniscal tear and extrusion are strongly associated
with progression of symptomatic knee osteoarthritis as
assessed by quantitative magnetic resonance imaging. Ann
Rheum Dis 2005, 64:556-563.
8. Costa CR, Morrison WB, Carrino JA: Medial meniscus extrusion
on knee MRI: is extent associated with severity of degenera-
tion or type of tear? AJR Am J Roentgenol 2004, 183:17-23.
9. Raynauld JP, Martel-Pelletier J, Berthiaume MJ, Beaudoin G, Cho-
quette D, Haraoui B, Tannenbaum H, Meyer JM, Beary JF, Cline
GA, et al.: Long term evaluation of disease progression
through the quantitative magnetic resonance imaging of
symptomatic knee osteoarthritis patients: correlation with
clinical symptoms and radiographic changes. Arthritis Res
Ther 2006, 8:R21.
10. Hunter DJ, Zhang YQ, Niu JB, Tu X, Amin S, Clancy M, Guermazi
A, Grigorian M, Gale D, Felson DT: The association of meniscal
pathologic changes with cartilage loss in symptomatic knee
osteoarthritis. Arthritis Rheum 2006, 54:795-801.
11. Jones G, Ding C, Scott F, Cicuttini F: Genetic mechanisms of
knee osteoarthritis: a population based case-control study.
Ann Rheum Dis 2004, 63:1255-1259.
12. Jones G, Ding C, Scott F, Glisson M, Cicuttini F: Early radio-
graphic osteoarthritis is associated with substantial changes
in cartilage volume and tibial bone surface area in both males
and females. Osteoarthritis Cartilage 2004, 12:169-174.
13. Jones G, Glisson M, Hynes K, Cicuttini F: Sex and site differ-
ences in cartilage development: a possible explanation for
variations in knee osteoarthritis in later life. Arthritis Rheum
2000, 43:2543-2549.
14. Ding C, Cicuttini F, Scott F, Boon C, Jones G: Association of
prevalent and incident knee cartilage defects with loss of tibial
and patellar cartilage: a longitudinal study. Arthritis Rheum
2005, 52:3918-3927.
15. Ding C, Cicuttini F, Scott F, Cooley H, Boon C, Jones G: Natural
history of knee cartilage defects and factors affecting change.
Arch Intern Med 2006, 166:651-658.
16. Raynauld JP, Martel-Pelletier J, Berthiaume MJ, Labonte F, Beau-
doin G, de Guise JA, Bloch DA, Choquette D, Haraoui B, Altman
RD, et al.: Quantitative magnetic resonance imaging evaluation
of knee osteoarthritis progression over two years and correla-
tion with clinical symptoms and radiologic changes. Arthritis
Rheum 2004, 50:476-487.
17. Ding C, Garnero P, Cicuttini F, Scott F, Cooley H, Jones G: Knee
cartilage defects: association with early radiographic osteoar-
thritis, decreased cartilage volume, increased joint surface
area and type II collagen breakdown. Osteoarthritis Cartilage
2005, 13:198-205.
18. Breitenseher MJ, Trattnig S, Dobrocky I, Kukla C, Nehrer S, Steiner
E, Imhof H: MR imaging of meniscal subluxation in the knee.
Acta Radiol 1997, 38:876-879.
19. Mohana-Borges AV, Resnick D, Chung CB: Magnetic resonance
imaging of knee instability. Semin Musculoskelet Radiol 2005,
9:17-33.
20. Miettinen OS: Theoretical Epidemiology: Principles of Occurrence
Research in Medicine
Hoboken, NJ: John Wiley and Sons, Inc;
1985.
21. Eckstein F, Lemberger B, Gratzke C, Hudelmaier M, Glaser C,
Englmeier KH, Reiser M: In vivo cartilage deformation after dif-
ferent types of activity and its dependence on physical training
status. Ann Rheum Dis 2005, 64:291-295.