Báo cáo y học: "The association between patellar alignment on magnetic resonance imaging and radiographic manifestations of knee osteoarthritis" ppsx
Bạn đang xem bản rút gọn của tài liệu. Xem và tải ngay bản đầy đủ của tài liệu tại đây (313.47 KB, 8 trang )
Open Access
Available online />Page 1 of 8
(page number not for citation purposes)
Vol 9 No 2
Research article
The association between patellar alignment on magnetic
resonance imaging and radiographic manifestations of knee
osteoarthritis
Leonid Kalichman, Yuqing Zhang, Jingbo Niu, Joyce Goggins, Daniel Gale, Yanyan Zhu,
David T Felson and David J Hunter
Boston University School of Medicine, Clinical Epidemiology Research and Training Unit, 650 Albany Street Suite X200, Boston, MA 02118, USA
Corresponding author: David J Hunter,
Received: 1 Nov 2006 Revisions requested: 31 Jan 2007 Revisions received: 2 Feb 2007 Accepted: 7 Mar 2007 Published: 7 Mar 2007
Arthritis Research & Therapy 2007, 9:R26 (doi:10.1186/ar2138)
This article is online at: />© 2007 Kalichman et al.; licensee BioMed Central Ltd.
This is an open access article distributed under the terms of the Creative Commons Attribution License ( />),
which permits unrestricted use, distribution, and reproduction in any medium, provided the original work is properly cited.
Abstract
The aim of our study was to evaluate the association between
patellar alignment by using magnetic resonance imaging images
and radiographic manifestations of patello-femoral osteoarthritis
(OA). Subjects were recruited to participate in a natural history
study of symptomatic knee OA. We examined the relation of
patellar alignment in the sagittal plane (patellar length ratio
(PLR)) and the transverse plane (sulcus angle (SA), lateral
patellar tilt angle (LPTA), and bisect offset (BO)) to radiographic
features of patello-femoral OA, namely joint space narrowing
and patellar osteophytes, using a proportional odds logistic
regression model while adjusting for age, sex, and bone mass
index (BMI). The study sample consisted of 126 males (average
age 68.0 years, BMI 31.2) and 87 females (average age 64.7
years, BMI 31.6), 75% of whom had tibiofemoral OA (a
Kellgren-Lawrence score of 2 or more). PLR showed a
statistically significant association with joint space narrowing
and osteophytosis in the lateral compartment. SA showed
significant association with medial joint space narrowing and
with lateral and medial patellar osteophytosis. LPTA and BO
showed significant association with both radiographic indices of
the lateral compartment. Clear linear trends were found in
association between PLR, LPTA and BO, and with outcomes
associated with lateral patello-femoral OA. SA, LPTA, and BO
showed linear trends of association with medial joint space
narrowing. Results of our study clearly suggest the association
between indices of patellar alignment and such features of
patello-femoral OA as osteophytosis and joint space narrowing.
Additional studies will be required to establish the normal and
abnormal ranges of patellar alignment indices and their
longitudinal relation to patello-femoral OA.
Introduction
Osteoarthritis (OA) is a major public health problem because
of its high prevalence, costs, and levels of pain and disability.
The prevalence of knee OA makes this disease the single
greatest cause of chronic disability in community-dwelling
adults in the United States [1,2]. Patellae that are located cen-
trally in the trochlear groove and not malaligned are thought to
be less likely to develop OA [3-5]. Patellar malalignment can
cause excess stress on the articular surfaces of the patello-
femoral (PF) joints and can potentially be a reason for degen-
erative changes in the knee [6-8].
Most studies of patellar malalignment use plain X-ray evalua-
tions of the knee in the lateral plane and skyline view [6,9-12].
Various methods have been proposed to evaluate patellar
malalignment using radiographs: first, in the lateral plane, by
evaluation of the relationship between patellar height and
patellar ligament length [13,14]; and second, on the skyline
view, by evaluation of the trochlear sulcus angle (SA) and
depth [15], by evaluation of the lateral PF angle [6,16], the lat-
eral patellar tilt angle (LPTA) [17], and the bisect offset (BO)
of the patella [18], and by evaluation of congruence angle
[17].
BMI = bone mass index; BO = bisect offset; BOKS = Boston Osteoarthritis of the Knee Study; LPTA = lateral patellar tilt angle; MRI = magnetic
resonance imaging; OA = osteoarthritis; PF = patello-femoral; PLR = patellar length ratio; SA = sulcus angle.
Arthritis Research & Therapy Vol 9 No 2 Kalichman et al.
Page 2 of 8
(page number not for citation purposes)
Very few studies have evaluated PF alignment by magnetic
resonance imaging (MRI) [19-21]. Muellner and colleagues
[19] performed measurements analogous to those used in X-
ray evaluation with MRI images obtained with knees flexed to
20° and 45°. Knee flexion allows the evaluation of PF relations
when the patella is located in opposition to the femoral tro-
chanteric sulcus. However, in common clinical practice MRI of
the knees is usually obtained in the supine position, with fully
extended knees. Multiplanar MRI acquisitions permit the
assessment of alignment in both the axial and sagittal planes.
Therefore in the present study we evaluated patellar alignment
on MRI images of extended knees.
Radiography is currently the most widely used method to
assess damage in OA [22]. This technique permits the meas-
urement of joint space narrowing and osteophytes, among
other features. Regulatory requirements for the development
of disease-modifying drugs in OA still consider the measure-
ment of joint space narrowing on plain X-rays to be the appro-
priate primary endpoint for demonstration of efficacy [23,24].
In this study we used X-ray-evaluated indices of knee OA in
medial and lateral PF joints that evaluate such features as joint
space narrowing and patellar osteophyte development.
The aim of our study was to evaluate the association between
PF alignment (using standard MRI images of extended knees)
and radiographic manifestations of PF OA. Our hypothesis
was that increasing patellar malalignment on MRI would be
positively associated with PF radiographic changes (the pres-
ence of joint space narrowing and osteophytes). Factors asso-
ciated with structural alteration in the PF joint are not as well
characterized as in the tibiofemoral joint. This study sought to
assess patellar alignment indices that may be selectively asso-
ciated with the PF joint structural changes.
Materials and methods
Study design
The study was designed as a cross-sectional observational
study.
Sample
Subjects were recruited to participate in a natural history study
of symptomatic knee OA, called the Boston Osteoarthritis of
the Knee Study (BOKS). Subjects in this study are a subset of
subjects whose recruitment has been described in detail else-
where [25]. In brief, subjects were recruited from two prospec-
tive studies of the quality of life of veterans (one of men and
one of women), from clinics at the Veterans Administration
Boston Health Care System and from advertisements in local
newspapers. Potential participants were asked two questions:
'Do you have pain, aching or stiffness in one or both knees on
most days?' and 'Has a doctor ever told you that you have
knee arthritis?' For subjects who answered positively to both
questions, we conducted a follow-up interview in which we
asked about other types of arthritis that could cause knee
symptoms. If no other forms of arthritis were identified, the indi-
vidual was eligible for recruitment. To determine whether sub-
jects had radiographic OA, they underwent a series of knee
radiographs (see below under 'Radiographic evaluation'). If
the subject had a definite osteophyte on any view in the symp-
tomatic knee, they were eligible for the study. By having fre-
quent knee symptoms and radiographic OA, all subjects met
American College of Rheumatology criteria for symptomatic
knee OA [26]. For the natural history study, we enrolled sub-
jects who were interested in participating and who could walk
with or without a cane. The examinations were approved by the
Boston University Medical Center and the Veterans Adminis-
tration Boston Healthcare System Institutional Review Boards.
Each subject's written consent was obtained in accordance
with the Declaration of Helsinki.
MRI evaluations
All studies were performed with a Signa 1.5T MRI system
(General Electric Corp., Milwaukee, WI, USA) using a phased-
array knee coil. A positioning device was used to ensure uni-
formity between patients. The imaging protocol included sag-
ittal spin-echo proton density-weighted and T2-weighted
images (repetition time (TR) 2,200 ms; time to echo (TE) 20/
80 ms) with a slice thickness of 3 mm, a 1 mm interslice gap,
one excitation, a field of view (FOV) of 11 to 12 cm, and a
matrix of 256 pixels × 192 pixels; and coronal and axial spin-
echo fat-suppressed proton density-weighted and T2-
weighted images (TR 2,200 ms; TE 20/80 ms) with a slice
thickness of 3 mm, a 1 mm interslice gap, one excitation, and
with the same FOV and matrix. The 213 MRIs from BOKS
were digitally archived.
Patellar alignment evaluation
In the present study we evaluated MRIs that had previously
been acquired for BOKS. The patellar alignment evaluation for
MRI in this study was performed with eFilm Workstation (ver-
sion 2.0.0) software. We measured patellar alignment in two
planes: sagittal and transverse (axial). In the sagittal plane we
measured the patellar length ratio (PLR) by the Insall and Sal-
vati method [13]. For these measurements we found the slice
with clearly recognizable patellar margins and where the patel-
lar bone volume seemed to be maximal. To measure patellar
length and patellar ligament length by the Insall and Salvati
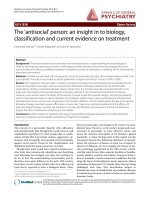
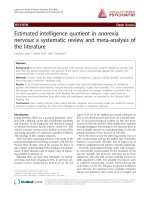
method we constructed two lines (Figure 1a): patellar length,
from the upper to the lower point of the inner (articulating) sur-
face of the patella excluding osteophytes amd patellar liga-
ment length, from the lower inner point of the patella to the
highest point of tibial tuberosity. PLR was calculated as (Patel-
lar length)/(Patellar ligament length).
In the transverse (axial) plane we measured two groups of indi-
ces: first, the index that describes the trochlear depth, namely
SA [6,27,28], and second, indices that describe patellar posi-
tion:, namely LPTA and BO [27,29,30]. For the measurements
of SA we found the axial slice that referred to the proximal one-
Available online />Page 3 of 8
(page number not for citation purposes)
third of the femoral trochlear curve by using the three-dimen-
sional cursor on the sagittal image. SA is the angle between
two lines: from the lowest point of the trochlear sulcus, one on
a lateral bony margin and the second on a medial bony margin
(Figure 1b). For the measurements of patellar alignment we
found the axial slice that refers to the middle of the patella by
using the three-dimensional cursor on the sagittal image.
LPTA is the angle between the posterior condylar line and a
line drawn through the lateral interior bony margin of the
patella (Figure 1c). For BO measurements we drew the poste-
rior condylar line and perpendicular line up though the lowest
point of the femoral sulcus and through the patella, and meas-
ured the distance between the lateral border of the patella and
this vertical line (a) and between the medial border of the
patella and this vertical line (b) (Figure 1d). BO was calculated
from the formula BO = 100a/(a + b).
Reliability of MRI readings
First, we (LK and DH) read a batch of MRIs and decided on an
exact protocol of evaluation of patellar alignment. Using this
protocol, 10 MRIs were read and re-read by these two investi-
gators separately to estimate the intra-rater and inter-rater reli-
ability of the readings of each of the patellar alignment
features. One investigator (LK) read the remainder of the MRIs,
blinded to patient identifiers. To evaluate for reader drift, we re-
assessed intra-rater reliability by inserting one original reliabil-
ity scan for every 10 new scans. Before reading each batch of
MRIs, LK re-read five previously read MRIs to 'calibrate' his
readings against a standard. The intra-observer reliability intra-
class correlation coefficient for reading for different patellar
alignment indices varied between 0.86 and 0.96.
Radiographic evaluation of PF OA
Patients underwent weight-bearing skyline radiography with
the protocol of Buckland-Wright [31]. The skyline view radio-
graphs were read by an academically based rheumatologist
(DTF). The presence of osteophytes in the medial and lateral
parts of the patella and femur as well as joint space narrowing
in the medial and lateral parts of the PF joint were each graded
on a four-point scale (range 0 to 3).
Statistical analysis
The goal of our analysis was to evaluate the association
between MRI measures of alignment and radiographic PF OA.
We first categorized each of the four patellar alignment meas-
urements into quartiles. Medial PF osteophytes took on whole-
number values from 0 to 3, and were analyzed as ordered cat-
egories. We examined the relation between quartiles of each
patellar alignment measure and medial PF osteophytes with
the use of the proportional odds logistic regression model. A
generalized estimating equation correction was applied to
account for the correlation in the osteophytes outcome
between the femur and patella within a knee. We then tested
for linear trend between patellar alignment evaluation and
medial PF cartilage by using patellar alignment evaluation as a
continuous variable in the model. If there was potential U-
shapes or J-shaped relation between a patellar alignment eval-
uation and medial PF cartilage, we tested the U-shaped trend
by including both patellar alignment evaluation and its square.
We used the same approach to examine the relation between
each patellar alignment measure and lateral PF osteophytes.
All models were adjusted for age, sex, and bone mass index
(BMI). We also examined the relation between quartiles of
each patellar alignment evaluation and medial PF joint space
narrowing with the use of the proportional odds logistic
regression model while adjusting for age, sex, and BMI. We
then tested for linear trend and U-shaped trend. The same
approach was used to examine the relation between each
patellar alignment evaluation and lateral PF joint space narrow-
ing. Statistical analyses were performed with SAS software
(release 9.1; SAS Institute Inc, Cary, NC, USA).
Results
Of the 324 patients entering BOKS, 311 obtained an MRI of
their more symptomatic knee at baseline. Table 1 shows the
characteristics of the 213 study participants selected at ran-
dom from the larger study sample. We compared the group of
individuals who were included in the present study (n = 213)
with the group of individuals who were not (n = 111). There
were no statistically significant differences between groups in
terms of age (66.6 ± 9.3 versus 67.8 ± 9.1 respectively, p =
0.28) and BMI (31.4 ± 5.5 versus 31.5 ± 6.1 respectively, p =
0.87). This study sample was composed of 126 males (aver-
Figure 1
Diagram of measured patellar alignment indicesDiagram of measured patellar alignment indices. (a) In the sagittal
plane, PL is the inner patellar length and TL is the patellar tendon length
(PLR, the patellar length ratio, was computed as PL/TL). (b-d) In a
transverse (axial) plane, SA is the sulcus angle (b) and LPTA is the lat-
eral patellar tilt angle (c); (d) diagram of bisect offset (BO)
measurement.
Arthritis Research & Therapy Vol 9 No 2 Kalichman et al.
Page 4 of 8
(page number not for citation purposes)
age age 68.0 years) and 87 females (average age 64.7 years).
On average, the subjects were obese, with a mean BMI of
31.2 for males and 31.6 for females, and had radiographic
knee OA (a Kellgren-Lawrence score of 2 or more in 65.9% of
males and 87.4% of females).
Tables 2 to 5 show the relation between patellar alignment
measures and radiographic indices of PF OA. Each table
presents the number of measured knees in each quartile, the
range of patellar alignment measures in each quartile, odds
ratios and the p for trend of the model.
PLR showed a statistically significant association with individ-
ual radiographic features, namely osteophytes and joint space
narrowing of PF OA in the lateral compartment. The lowest fre-
quency of lateral joint space narrowing was found in PLR
ranges 0.66 to 0.87 (lowest PLR, referent quartile). With
increasing PLR there was an increased risk of lateral joint
space narrowing; odds ratios for quartiles were 1.00 (lowest
PLR, referent quartile), 1.56, 1.36, and 2.77 (highest quartile)
(p for linear trend = 0.01). A similar trend was found between
increasing PLR and increasing lateral patellar osteophytosis;
odds ratios were 1.00, 1.70, 1.23, and 1.67 (p for linear trend
= 0.01). There was no statistically significant association
between PLR and indices of radiographic PF OA in the medial
PF compartment.
SA showed a statistically significant association with medial
joint space narrowing and lateral and medial patellar osteophy-
tosis. With increasing SA there was increased risk of medial
joint space narrowing; odds ratios were 1.00 (referent quartile,
SA range 98 to 113°), 1.37, 1.66, and 3.16 (the highest quar-
tile, SA range 125 to 155°) (p for linear trend = 0.01). For lat-
eral patellar osteophytosis the odds ratios were 1,.00 1.62,
1.83, and 1.52 (p for linear trend = 0.08). For medial patellar
osteophytosis the odds ratios were 1.00, 1.45, 1.73, and 1.69
(p for linear trend = 0.05).
Table 1
Characteristics of the study sample
Characteristics n Mean Frequency (percentage) Range
Age (years) 213 66.6 - 47–93
Sex (women) 213 - 40.8 -
Bone mass index 213 31.4 - 21.5–55.9
K-L ≥ 2 212 - 75.0 0–4
K-L, Kellgren-Lawrence score.
Table 2
Association between patellar alignment (fore groups) and adjusted means of lateral PF joint space narrowing
Measure Lateral joint space narrowing p for trend
Quartile 1 2 3 4
PLR No. of knees 50 50 50 52
Range of PLR 0.66–0.87 0.88–0.98 0.98–1.12 1.13–1.71
OR (95% CI) 1.00 1.56 (0.66–3.67) 1.36 (0.57–3.23) 2.77 (1.20–6.39) Linear, 0.0136; U-shaped, 0.1630
SA No. of knees 51 52 49 50
Range of SA 98–113 114–119 120–124 125–155
OR (95% CI) 1.00 1.48 (0.66–3.33) 1.58 (0.71–3.56) 1.43 (0.63–3.24) Linear, 0.1206; U-shaped, 0.6204
LPTA No. of knees 52 51 44 54
Range of LPTA -25 to 13 14–17 18–21 22–35
OR (95% CI) 1.00 0.46 (0.21–0.97) 0.32 (0.14–0.73) 0.10 (0.04–0.27) Linear, <0.0001; U-shaped, 0.9073
BO No. of knees 49 49 51 50
Range of BO 38.46–54.55 54.76–60.42 60.47–66.67 66.67–100
OR (95% CI) 1.00 2.16 (0.78–5.96) 4.22 (1.58–11.25) 8.26 (3.06–22.30) Linear, <0.0001; U-shaped, 0.2468
Results are adjusted for age, sex and bone mass index. PLR, patellar length ratio; SA, sulcus angle; LPTA, lateral patellar tilt angle; BO, bisect
offset; OR, odds ratio; CI, confidence interval.
Available online />Page 5 of 8
(page number not for citation purposes)
LPTA showed a statistically significant association with joint
space narrowing and osteophytosis of the lateral PF compart-
ment. The lowest range (referent quartile) of LPTA values
spanning -25 to 13° was associated with the greatest lateral
joint space narrowing; odds ratios were 1.00, 0.46, 0.32, and
0.10 (p for linear trend < 0.0001). A similar association was
found between LPTA and lateral patellar osteophytosis, with
odds ratios being 1.00, 0.35, 0.51, and 0.29, respectively (p
for linear trend < 0.0001).
BO showed statistically significant associations with lateral
and medial joint space narrowing and lateral PF osteophytosis.
A more laterally displaced patella was associated with
increased lateral joint space narrowing; odds ratios were 1.00,
2.16, 4.22, and 8.26 (p for linear trend < 0.0001). It was also
positively associated with lateral patellar osteophytosis; odds
ratios were 100, 0.92, 1.33, and 3.07 (p for linear trend <
0.0001). However, laterally displaced patella was negatively
associated with medial joint space narrowing; odds ratios
were 1.00, 0.89, 0.71, and 0.19 (p for linear trend < 0.0026).
Thus, increasing medial displacement of the patella was asso-
ciated with medial joint space narrowing.
Discussion
In the present cross-sectional study we found significant asso-
ciations between patellar alignment evaluated with standard
knee MRI and indices of radiographic PF OA, such as joint
space narrowing and patellar osteophytes.
PLR is a measure of the vertical position of the patella meas-
ured on the lateral view and was originally proposed by Insall
and Salvati [13]. Shabshin and colleagues [32] used MRIs of
extended knees to measure the PLR, and suggested that
PLRs of more than 1.50 or less than 0.74 define patella alta
and patella baja, respectively. Previous studies suggested that
a high-riding patella (patella alta) can be associated with lat-
eral patellar dislocation and subluxation, chondromalacia
patellae, patellar ligament rupture, and Sinding-Larsen-
Johansson disease, patellar and quadriceps tendonitis, and
Osgood-Schlatter disease [13,14,28,33-36]. Our study dem-
onstrated that increasing PLR is significantly associated with
increasing joint space narrowing and osteophytoses in the
lateral compartment of the PF joint. These results are similar to
previously published data [35] investigating the close associ-
ation of idiopathic retropatellar pain with patella alta.
The patella increases the mechanical advantage of extensor
muscles by transmitting forces across the knee at a greater
distance (moment) from the axis of rotation, thus increasing
the functional lever arm of the quadriceps as well as changing
the direction of pull of the quadriceps mechanism. A longer
patellar tendon decreases the patellar advantage as a
functional lever arm of the quadriceps in commonly used
angles of knee flexion (30 to 60°), which can increase com-
pression in the PF joint and can therefore lead to excessive
cartilage attrition and joint space narrowing. Another potential
explanation is that a high-riding patella placed against a much
shallower femoral sulcus can lead to instability (the evidence
for this is that a higher rate of patellar dislocation is associated
with patella alta) that can lead to the degeneration of cartilage
and osteophyte formation.
In our study SA was significantly associated with lateral and
medial patellar osteophytosis and also with medial joint space
Table 3
Association between patella alignment (fore groups) and adjusted means of medial PF joint space narrowing
Measure Medial joint space narrowing p for trend
Quartile 1 2 3 4
PLR No. of knees 50 50 50 52
Range of PLR 0.66–0.87 0.88–0.98 0.98–1.12 1.13–1.71
OR (95% CI) 1.00 1.97 (0.65–5.99) 2.09 (0.70–6.19) 2.47 (0.86–7.14) Linear, 0.1253
SA No. of knees 51 52 49 50
Range of SA 98–113 114–119 120–124 125–155
OR (95% CI) 1.00 1.37 (0.47–3.98) 1.66 (0.57–4.87) 3.17 (1.15–8.72) Linear, 0.0162
LPTA No. of knees 52 52 44 54
Range of LPTA -25 to 13 14–17 18–21 22–35
OR (95% CI) 1.00 1.532 (0.546–4.302) 1.697 (0.603–4.773) 2.185 (0.822–5.809) Linear, 0.0259
BO No. of knees 49 49 51 50
Range of BO 38.46–54.55 54.76–60.42 60.47–66.67 66.67–100
OR (95% CI) 1.00 0.887 (0.346–2.272) 0.711 (0.272–1.857) 0.189 (0.057–0.638) Linear, 0.0026
Results are adjusted for age, sex and bone mass index. PLR, patellar length ratio; SA, sulcus angle; LPTA, lateral patellar tilt angle; BO, bisect
offset; OR, odds ratio; CI, confidence interval.
Arthritis Research & Therapy Vol 9 No 2 Kalichman et al.
Page 6 of 8
(page number not for citation purposes)
narrowing. SA is an indicator of femoral trochlear dysplasia,
one of the anomalies associated with PF OA and with patellar
instability [37]. Patellar instability can cause excessive traction
and compression forces on both sides of the patella itself and
both the patellar and femoral articular cartilages, and can
potentially aggravate osteophyte formation and also facilitate
joint space narrowing.
In the present study we used two indices of PF relationship:
LPTA and BO. Both measures showed statistically significant
positive associations with PF OA in the lateral compartment.
BO demonstrated a negative association with medial joint
space narrowing. There are several possible explanations for
our findings, although it should be recognized that this is a
cross-sectional study and any causal inference is not possible
with such a design. BO indicates the lateral displacement of
the patella in relation to deepest part of the femoral sulcus.
LPTA shows the angle of patellar inclination, which indicates
the tightness or looseness of the lateral stabilizing mechanism
of the patella. MRIs in our study were taken in a supine position
and with fully extended knees with the quadriceps relaxed. If
we found a laterally displaced patella and/or lateral border of
patella too close to the lateral femoral condyle (decreased
LPTA) on those images it could mean that the structures that
hold it in the lateral position (lateral retinaculum, vastus latera-
lis) were shortened. In this situation, during knee movement
the patella would be compressed against the lateral femoral
condyle, rather than distributing load evenly between the lat-
eral and medial PF compartments. Excessive compressive
forces primarily located on the lateral PF compartment in com-
bination with movement could lead to wear on the cartilage
and, as a result, to its degeneration. An alternative explanation
could be that OA changes caused the alteration in patellar
alignment; that is, with increased narrowing of the radio-
graphic joint space in the lateral compartment this allowed lat-
eral displacement of the patella with reference to the femur.
There were numerous limitations of the present study that
need to be recognized. First, the MRI images were performed
in a supine position rather than a weight-bearing one. This lim-
itation is likely to have reduced our opportunity to measure
dynamic changes in patella position with weight bearing and
thus underscore the fact that our findings are likely to be con-
servative for measures that could potentially change with
weight bearing such as BO and the LPTA. Second, the MRI
was obtained in a fully extended knee. This position, as men-
tioned above, is common in clinical practice, but in the
extended knee the patella is not positioned against the troch-
lear sulcus and it makes the measurement of their congruence
less precise. Third, our study was cross-sectional, and any evi-
dence of causality needs to be explored further in longitudinal
studies. Although the study may be internally valid it is not
necessarily generalizable to other persons with symptomatic
knee OA.
Table 4
Association between patella alignment (fore groups) and adjusted means of lateral patellar osteophytes
Measure Lateral patellar osteophytes p for trend
Quartile 1234
PLR No. of knees 100 100 100 104
Range of PLR 0.66–0.87 0.88–0.98 0.98–1.12 1.13–1.71
OR (95% CI) 1.00 1.70 (1.01–2.86) 1.23 (0.73–2.08) 1.67 (0.98–2.84) Linear, 0.0138; U-
shaped, 0.0943
SA No. of knees 102 104 98 100
Range of SA 98–113 114–119 120–124 125–155
OR (95% CI) 1.00 1.62 (0.97–2.71) 1.83 (1.09–3.08) 1.52 (0.91–2.55) Linear, 0.0804; U-
shaped, 0.8875
LPTA No. of knees 104 102 88 108
Range of LPTA -25 to 13 14–17 18–21 22–35
OR (95% CI) 1.00 0.35 (0.21–0.60) 0.51 (0.30–0.88) 0.29 (0.17–0.49) Linear, <0.0001;
U-shaped, 0.1076
BO No. of knees 98 98 102 100
Range of BO 38.46–54.55 54.76–60.42 60.47–66.67 66.67–100
OR (95% CI) 1.00 0.92 (0.54–1.54) 1.33 (0.79–2.25) 3.07 (1.77–5.34) Linear, <0.0001;
U-shaped, 0.2038
Results are adjusted for age, sex and bone mass index. PLR, patellar length ratio; SA, sulcus angle; LPTA, lateral patellar tilt angle; BO, bisect
offset; OR, odds ratio; CI, confidence interval.
Available online />Page 7 of 8
(page number not for citation purposes)
Conclusion
A full understanding of the risk factors for OA in the PF joint
requires the consideration of a range of different risk factors.
The alignment of the patella may be an important factor influ-
encing PF joint degeneration due to the aberrant distribution
of forces with activity. On the basis of the results of this study
it does seem that non-weight-bearing, full-extension assess-
ment of patellar alignment does increase our understanding of
the reasons for PF OA. The results of our study suggest that
indices of patellar alignment can be measured easily on a
standard knee MRI. Statistically significant associations were
found between indices of patellar alignment and such features
of PF OA as osteophytosis and joint space narrowing. Further
consideration needs to be given to the importance of PF align-
ment, preferably in more functional positions than supine and
non-weight-bearing, and in longitudinal evaluations.
Competing interests
The authors declare that they have no competing interests.
Authors' contributions
LK participated in the design and coordination of the study,
read the MRIs, and prepared the manuscript. YZ participated
in the design of the study. JN performed the statistical analy-
ses. JG participated in the sequence alignment. DG read
MRIs. DTF read the X-rays and made substantial contributions
to the design concept. DJH conceived of the study, partici-
pated in the design and coordination of the study, and helped
to draft the manuscript. All authors read and approved the final
manuscript.
Acknowledgements
We thank the participants and staff of BOKS. This study was supported
by NIH AR47785, by an Osteoarthritis Biomarkers Grant from the Arthri-
tis Foundation, and by an Arthritis Foundation Clinical Sciences Grant.
The study sponsor was not involved in study design, in the collection,
analysis, and interpretation of data, in the writing of the report, or in the
decision to submit the paper for publication.
References
1. Guccione AA, Felson DT, Anderson JJ, Anthony JM, Zhang Y, Wil-
son PW, Kelly-Hayes M, Wolf PA, Kreger BE, Kannel WB: The
effects of specific medical conditions on the functional limita-
tions of elders in the Framingham study. Am J Public Health
1994, 84:351-358.
2. Felson DT, McAlindon TE, Anderson JJ, Naimark A, Weissman
BW, Aliabadi P, Evans S, Levy D, LaValley MP: Defining radio-
graphic osteoarthritis for the whole knee. Osteoarthritis
Cartilage 1997, 5:241-250.
3. Harrison MM, Cooke TD, Fisher SB, Griffin MP: Patterns of knee
arthrosis and patellar subluxation. Clin Orthop Relat Res 1994,
309:56-63.
4. Iwano T, Kurosawa H, Tokuyama H, Hoshikawa Y: Roentgeno-
graphic and clinical findings of patellofemoral osteoarthrosis.
With special reference to its relationship to femorotibial oste-
oarthrosis and etiologic factors. Clin Orthop Relat Res 1990,
252:190-197.
5. Fujikawa K, Seedhom BB, Wright V: Biomechanics of the
patello-femoral joint. Part II: A study of the effect of simulated
femoro-tibial varus deformity on the congruity of the patello-
femoral compartment and movement of the patella. Eng Med
1983, 12:13-21.
6. Davies AP, Costa ML, Shepstone L, Glasgow MM, Donnell S: The
sulcus angle and malalignment of the extensor mechanism of
the knee. J Bone Joint Surg Br 2000, 82:1162-1166.
7. Cahue S, Dunlop D, Hayes K, Song J, Torres L, Sharma L: Varus-
valgus alignment in the progression of patellofemoral
osteoarthritis. Arthritis Rheum 2004, 50:2184-2190.
8. Wittstein JR, Bartlett EC, Easterbrook J, Byrd JC: Magnetic reso-
nance imaging evaluation of patellofemoral malalignment.
Arthroscopy 2006, 22:643-649.
Table 5
Association between patella alignment (fore groups) and adjusted means of medial patellar osteophytes
Measure Medial patellar osteophytes p for trend
Quartile 1 2 3 4
PLR No. of knees 100 100 100 104
Range of PLR 0.66–0.87 0.88–0.98 0.98–1.12 1.13–1.71
OR (95% CI) 1.00 1.27 (0.75–2.15) 1.16 (0.68–1.96) 1.12 (0.66–1.90) Linear, 0.5996
SA No. of knees 102 104 98 100
Range of SA 98–113 114–119 120–124 125–155
OR (95% CI) 1.00 1.465 (0.87–2.43) 1.73 (1.03–2.93) 1.69 (1.01–2.83) Linear, 0.0514
LPTA No. of knees 104 102 88 108
Range of LPTA -25 to 13 14–17 18–21 22–35
OR (95% CI) 1.00 0.80 (0.48–1.35) 0.93 (0.55–1.60) 1.43 (0.85–2.39) Linear, 0.1080
BO No. of knees 98 98 102 100
Range of BO 38.46–54.55 54.76–60.42 60.47–66.67 66.67–100
OR (95% CI) 1.00 0.887 (0.346–2.272) 0.711 (0.272–1.857) 0.189 (0.057–0.638) Linear, 0.888
Results are adjusted for age, sex and bone mass index. PLR, patellar length ratio; SA, sulcus angle; LPTA, lateral patellar tilt angle; BO, bisect
offset; OR, odds ratio; CI, confidence interval.
Arthritis Research & Therapy Vol 9 No 2 Kalichman et al.
Page 8 of 8
(page number not for citation purposes)
9. Laurin CA, Dussault R, Levesque HP: The tangential x-ray inves-
tigation of the patellofemoral joint: x-ray technique, diagnostic
criteria and their interpretation. Clin Orthop Relat Res 1979,
144:16-26.
10. Aglietti P, Insall JN, Cerulli G: Patellar pain and incongruence. I:
Measurements of incongruence. Clin Orthop Relat Res 1983,
176:217-224.
11. Insall JN, Aglietti P, Tria AJ Jr: Patellar pain and incongruence. II:
Clinical application. Clin Orthop Relat Res 1983, 176:225-232.
12. Murray TF, Dupont JY, Fulkerson JP: Axial and lateral radio-
graphs in evaluating patellofemoral malalignment. Am J
Sports Med 1999, 27:580-584.
13. Insall J, Salvati E: Patella position in the normal knee joint. Radi-
ology 1971, 101:101-104.
14. Grelsamer RP, Meadows S: The modified Insall-Salvati ratio for
assessment of patellar height. Clin Orthop Relat Res 1992,
282:170-176.
15. Ficat RP, Hungerford DS: Disorders of the Patello-femoral Joint
Baltimore: The Williams and Wilkins Co; 1977.
16. Bull AMJ, Katchburian MV, Shih YF, Amis AA: Standardisation of
the description of patellofemoral motion and comparison
between different techniques. Knee Surg Sports Traumatol
Arthrosc 2002, 10:184-193.
17. Merchant AC, Mercer RL, Jacobsen RH, Cool CR: Roentgeno-
graphic analysis of patellofemoral congruence. J Bone Joint
Surg Am 1974, 56:1391-1396.
18. Beaconsfield T, Pintore E, Maffulli N, Petri J: Radiological meas-
urements in patellofemoral disorders. A review. Clin Orthop
Relat Res 1994, 308:18-28.
19. Muellner T, Funovics M, Nikolic A, Metz V, Schabus R, Vecsei V:
Patellar alignment evaluated by MRI. Acta Orthop Scand 1998,
69:489-492.
20. Carrillon Y, Abidi H, Dejour D, Fantino O, Moyen B, Tran-Minh VA:
Patellar instability: assessment on MR images by measuring
the lateral trochlear inclination – initial experience. Radiology
2000, 216:582-585.
21. Kobayashi T, Fujikawa K, Nemoto K, Yamazaki M, Obara M, Sato
S: Evaluation of patello-femoral alignment using MRI. Knee
2005, 12:447-453.
22. Felson DT, Zhang Y, Hannan MT, Naimark A, Weissman BN, Alia-
badi P, Levy D: The incidence and natural history of knee oste-
oarthritis in the elderly. The Framingham Osteoarthritis Study.
Arthritis Rheum 1995, 38:1500-1505.
23. Abadie E, Ethgen D, Avouac B, Bouvenot G, Branco J, Bruyere O,
Calvo G, Devogelaer JP, Dreiser RL, Herrero-Beaumont G, et al.:
Recommendations for the use of new methods to assess the
efficacy of disease-modifying drugs in the treatment of
osteoarthritis. Osteoarthritis Cartilage 2004, 12:263-268.
24. Altman RD, Abadie E, Avouac B, Bouvenot G, Branco J, Bruyere
O, Calvo G, Devogelaer JP, Dreiser RL, Herrero-Beaumont G, et
al.: Total joint replacement of hip or knee as an outcome
measure for structure modifying trials in osteoarthritis. Oste-
oarthritis Cartilage 2005, 13:13-19.
25. Wolfe F, Lane NE: The longterm outcome of osteoarthritis:
rates and predictors of joint space narrowing in symptomatic
patients with knee osteoarthritis. J Rheumatol 2002,
29:139-146.
26. Altman R, Asch E, Bloch D, Bole G, Borenstein D, Brandt K,
Christy W, Cooke TD, Greenwald R, Hochberg M, et al.: Develop-
ment of criteria for the classification and reporting of osteoar-
thritis. Classification of osteoarthritis of the knee. Diagnostic
and Therapeutic Criteria Committee of the American Rheuma-
tism Association. Arthritis Rheum 1986, 29:1039-1049.
27. Powers CM, Shellock FG, Pfaff M: Quantification of patellar
tracking using kinematic MRI. J Magn Reson Imaging 1998,
8:724-732.
28. Miller TT, Staron RB, Feldman F: Patellar height on sagittal MR
imaging of the knee. AJR Am J Roentgenol 1996, 167:339-341.
29. Brossmann J, Muhle C, Schroder C, Melchert UH, Bull CC, Spiel-
mann RP, Heller M: Patellar tracking patterns during active and
passive knee extension: evaluation with motion-triggered cine
MR imaging. Radiology 1993, 187:205-212.
30. Sasaki T, Yagi T: Subluxation of the patella. Investigation by
computerized tomography. Int Orthop
1986, 10:115-120.
31. Buckland-Wright C: Protocols for precise radio-anatomical
positioning of the tibiofemoral and patellofemoral compart-
ments of the knee. Osteoarthritis Cartilage 1995, 3(Suppl
A):71-80.
32. Shabshin N, Schweitzer ME, Morrison WB, Parker L: MRI criteria
for patella alta and baja. Skeletal Radiol 2004, 33:445-450.
33. Von Gumppenberg S, Jacob RP, Engelhardt P: [Does Osgood-
Schlatter disease modify the position of the patella?]. Z
Orthop Ihre Grenzgeb 1984, 122:798-802.
34. Grana WA, Krieghauser LA: Scientific basis of extensor mecha-
nism disorders. Clin Sports Med 1985, 4:247-257.
35. Kannus PA: Long patellar tendon: radiographic sign of patel-
lofemoral pain syndrome. Radiology 1992, 185:859-863.
36. Aparicio G, Abril JC, Calvo E, Alvarez L: Radiographic study of
patellar height in Osgood-Schlatter disease. J Pediatr Orthop
1997, 17:63-66.
37. Brattström H: Shape of the intercondylar groove normally and
in recurrent dislocation of the patella. Acta Orthop Scand Suppl
1964, 68(Suppl 68):1-148.