Báo cáo khoa học: " On the performances of different IMRT treatment planning systems for selected paediatric cases" pot
Bạn đang xem bản rút gọn của tài liệu. Xem và tải ngay bản đầy đủ của tài liệu tại đây (1.28 MB, 21 trang )
BioMed Central
Page 1 of 21
(page number not for citation purposes)
Radiation Oncology
Open Access
Methodology
On the performances of different IMRT treatment planning systems
for selected paediatric cases
Antonella Fogliata
1
, Giorgia Nicolini
1
, Markus Alber
3
, Mats Åsell
4
,
Alessandro Clivio
1
, Barbara Dobler
2
, Malin Larsson
5
, Frank Lohr
2
,
Friedlieb Lorenz
2
, Jan Muzik
3
, Martin Polednik
2
, Eugenio Vanetti
1
,
Dirk Wolff
2
, Rolf Wyttenbach
6
and Luca Cozzi*
1
Address:
1
Oncology Institute of Southern Switzerland, Medical Physics Unit, Bellinzona, Switzerland,
2
Universitätsklinikum Mannheim, Klinik für
Strahlentherapie und Radioonkologie, Mannheim, Germany,
3
Biomedical Physics, Radiooncology Dept, Uniklinik für Radioonkologie Tübingen,
Tübingen, Germany,
4
Nucletron Scandinavia AB, Uppsala, Sweden,
5
RaySearch Laboratories, Stockholm, Sweden and
6
Ospedale Regionale
Bellinzona e Valli, Radiology Dept, Bellinzona, Switzerland
Email: Antonella Fogliata - ; Giorgia Nicolini - ; Markus Alber - ;
Mats Åsell - ; Alessandro Clivio - ; Barbara Dobler - ;
Malin Larsson - ; Frank Lohr - ;
Friedlieb Lorenz - ; Jan Muzik - ;
Martin Polednik - ; Eugenio Vanetti - ; Dirk Wolff -
heidelberg.de; Rolf Wyttenbach - ; Luca Cozzi* -
* Corresponding author
Abstract
Background: To evaluate the performance of seven different TPS (Treatment Planning Systems: Corvus, Eclipse,
Hyperion, KonRad, Oncentra Masterplan, Pinnacle and PrecisePLAN) when intensity modulated (IMRT) plans are
designed for paediatric tumours.
Methods: Datasets (CT images and volumes of interest) of four patients were used to design IMRT plans. The tumour
types were: one extraosseous, intrathoracic Ewing Sarcoma; one mediastinal Rhabdomyosarcoma; one metastatic
Rhabdomyosarcoma of the anus; one Wilm's tumour of the left kidney with multiple liver metastases. Prescribed doses
ranged from 18 to 54.4 Gy. To minimise variability, the same beam geometry and clinical goals were imposed on all
systems for every patient. Results were analysed in terms of dose distributions and dose volume histograms.
Results: For all patients, IMRT plans lead to acceptable treatments in terms of conformal avoidance since most of the
dose objectives for Organs At Risk (OARs) were met, and the Conformity Index (averaged over all TPS and patients)
ranged from 1.14 to 1.58 on primary target volumes and from 1.07 to 1.37 on boost volumes. The healthy tissue
involvement was measured in terms of several parameters, and the average mean dose ranged from 4.6 to 13.7 Gy. A
global scoring method was developed to evaluate plans according to their degree of success in meeting dose objectives
(lower scores are better than higher ones). For OARs the range of scores was between 0.75 ± 0.15 (Eclipse) to 0.92 ±
0.18 (Pinnacle
3
with physical optimisation). For target volumes, the score ranged from 0.05 ± 0.05 (Pinnacle
3
with physical
optimisation) to 0.16 ± 0.07 (Corvus).
Conclusion: A set of complex paediatric cases presented a variety of individual treatment planning challenges. Despite
the large spread of results, inverse planning systems offer promising results for IMRT delivery, hence widening the
treatment strategies for this very sensitive class of patients.
Published: 15 February 2007
Radiation Oncology 2007, 2:7 doi:10.1186/1748-717X-2-7
Received: 29 November 2006
Accepted: 15 February 2007
This article is available from: />© 2007 Fogliata et al; licensee BioMed Central Ltd.
This is an Open Access article distributed under the terms of the Creative Commons Attribution License ( />),
which permits unrestricted use, distribution, and reproduction in any medium, provided the original work is properly cited.
Radiation Oncology 2007, 2:7 />Page 2 of 21
(page number not for citation purposes)
Background
Radiation Therapy is administered to approximately one-
half of the children affected by oncological pathologies to
manage their disease [1]. The choice of available radiation
treatments includes intensity-modulated radiotherapy
(IMRT) that should therefore be investigated in the chal-
lenging field of paediatric radio-oncology.
IMRT has been proven, at least in planning studies, to
improve conformal avoidance when compared to 3D con-
formal techniques (3DCRT) [2-7]. Improved dose distri-
butions are generally expected to correlate with
(significant) reduction of acute and late toxicity as already
documented in paediatric radiation oncology by some
authors, who reported low morbidity in children treated
with IMRT [8-11]. As an example, in a cohort of 26
patients treated for medulloblastoma, the mean dose
delivered to the auditory apparatus was 36.7 Gy for IMRT
and 54.2 Gy for 3DCRT; 64% of the 3DCRT treated
patients developed grade 3 to 4 hearing loss, compared to
only 13% in the IMRT group [8].
Despite its potential, IMRT is not widely used in the pae-
diatric field, and its introduction is significantly slower
than for adults. Consequently, there is a substantial lack
of knowledge on the late side effects of IMRT as pointed
out in the review article of Rembielak [12]. The main lim-
itation observed in this review is the publication of data of
small series and short-term follow-up. In addition, the
majority of studies investigated tumours located in the
brain and CNS, with few other sites [8-10,13-15].
One of the major factors limiting the use of IMRT in pae-
diatric oncology lies in the possible increase of radiation-
induced secondary malignancies, caused mostly by the
increased volume of patient receiving low dose levels. This
effect derives from the generally increased number of
fields entering from various angles and from a higher
number of monitor units (MU) compared with 3DCRT,
delivering higher leakage radiation estimated to be from 2
to 12 times higher than 3DCRT. However, this issue is
controversial. Followill [16] showed that for 6 MV treat-
ments the estimated likelihood of a fatal secondary cancer
due to a 70 Gy treatment increased from 0.6% for wedged
conventional treatment to 1.0% for IMRT, showing that
3DCRT is not significantly different from IMRT. Also
Koshy [17] have found (in children treated for head-and-
neck, brain, trunk, abdomen and pelvis) no significant
differences in dose received by thyroid and breast glands
when IMRT or 3DCRT were administered. Paediatric treat-
ments are anyway delicate since enhanced radiation sensi-
tivity is expected. Hall [18,19] showed that children are
more sensitive than adults by a factor of 10; in addition,
radiation scattered inside the patient is more significant in
the small body of a child than in a larger adult body, and
there is a genetic susceptibility of paediatric tissues to radi-
ation-induced cancer. Therefore, there is a need of more
clinical IMRT studies to assess the balance between the
positive therapeutic effects and the risk of radiation-
induced secondary malignancies.
The present study aimed to address the problem of IMRT
in paediatric radiation oncology from a different point of
view. Assuming that research activity in treatment plan-
ning or at clinical level shall be promoted, it is important
to analyse if the tools available for IMRT are adequate and
effective. A comparative study was conducted, similar to a
previous investigation on breast cancer [20], on the most
commonly available Treatment Planning Systems (TPS)
to assess their respective performance and their potential
limits in planning IMRT for some paediatric indications
that were chosen as difficult to be treated optimally with
3DCRT. The rationale to develop and report a study like
the present is multifactorial and is mainly based on the
following pillars.
i) at present, very few studies, and probably none on pae-
diatrics, exist addressing the issue of comparing different
commercial planning systems for IMRT. The study on
breast was the first published by this research group and
aimed to prove (with a minimally acceptable set of five
homogeneous patients) the adequacy of various TPS in
terms of conformal avoidance, for a specific tumour side.
Having proved that principle, it was felt necessary to
expand the research on a different class of patients.
ii) with the new study we aimed to address the usability of
the commercial TPS on pathologies which are more com-
plicate in nature, rarer and more challenging such as pedi-
atric cases where treatment planning requires particular
skills and it is bounded by dose-limiting constraints often
severely different from the ones applied to adults. As men-
tioned, literature is poor in this respect.
iii) in the field of paediatrics there is a generally weak
knowledge about IMRT and, to complicate the problem,
the variety of indications is huge and, at the limit, every
individual patient presents peculiarities (given by the
physiological variability in the evolutionary age) prevent-
ing easy generalisations. Therefore, rather than trying to
identify one single pathology and a consistent cohort of
patients, in the present study we preferred to identify a
(small) group of complicate cases, one case per indica-
tion, but all of them presenting specific planning chal-
lenges. On the other side, it was decided to limit the
number of cases to present in order to minimise data pres-
entation considering the results qualitatively sufficient to
prove the aims.
Radiation Oncology 2007, 2:7 />Page 3 of 21
(page number not for citation purposes)
iv) the study aimed at understanding if systems were keep-
ing the reliability shown for breast also under conditions
uncommon and distant from those generally used in
IMRT planning and likely not tested in the development
and qualification phases.
The strategy described above, allowed testing IMRT capa-
bilities of routinely available commercial TPS under a
range of rather extreme (although rare) conditions. In this
respect, the specific choice of indications, and the actual
status of the selected case, does not limit or affect the
potential of investigating complicate situations that could
be used as templates for similar cases. Clinical questions
(like outcome and toxicity) should be addressed in prop-
erly designed clinical trials and are not subjects of compar-
ative planning studies.
Methods
Four paediatric patients, affected by different types of can-
cer, were chosen. The tumour types were: one extra
osseous, intrathoracic Ewing Sarcoma; one mediastinal
Rhabdomyosarcoma; one Rhabdomyosarcoma of the
anus with intrapelvic, inguinal and osseous metastases;
one Wilm's tumour of the left kidney with multiple liver
metastases. In table 1 a summary of the diagnosis, dose
prescriptions, and planning objectives (PObj) for organs
at risk (OAR) is presented. For all cases except patient 4,
the treatment was structured in two courses, with two dif-
ferent planning target volumes (PTV): PTV1 being the
elective and PTV2 the boost volumes. The PObj concern-
ing OARs refer mainly to the report of the National Cancer
Institute [21,22]. To avoid scaling effects due to optimisa-
tion [20], dose was normalised to the mean PTV value.
Datasets were distributed among participants in DICOM
(CT images) and DICOM-RT (contours of volumes of
interest – VOIs) format as defined at the reference centre
(Bellinzona, Switzerland).
Seven TPS with inverse planning capabilities were com-
pared. Information on release used and main references
for dose calculation and optimisation algorithms are
reported in table 2. All TPS, except Hyperion, are commer-
cial systems. Pinnacle
3
implemented two optimisation
Table 1: Main characteristics of patients and treatment.
Patient 1 Patient 2 Patient 3 Patient 4
Patient Male, 12 y.o. Female, 8 y.o. Female, 13 y.o. Female, 8 y.o.
Diagnosis Ewing Sarcoma
extraosseous, intrathoracic
Rhabdomyosarcoma
mediastinum, stage III
Rhabdomyosarcoma anus.
Metastasis lymphnodes
intrapelvic, inguinal and
osseous
Wilm's tumour of the left
kidney.
(Multiple lung metastasis).
Multiple liver metastasis
Status After chemotherapy +
surgery + chemotherapy
After chemotherapy After chemotherapy After chemotherapy + left
nefrectomy + chemo-
radiotherapy for lung
metastasis
Radiotherapy dose
prescription
Total = 54.4 Gy, Total = 50.4 Gy, Total = 50.4 Gy, Total = 18 Gy,
1.6 Gy/fraction 1.8 Gy/fraction 1.8 Gy/fraction 1.2 Gy/fraction
2 fractions/day 1 fraction/day 1 fraction/day 1 fraction/day
I course (PTV1) = 44.8 Gy I course (PTV1) = 45 Gy I course (PTV1) = 45 Gy
II course(PTV2) = 9.6 Gy
(boost, excludes surgical
scar)
II course (PTV2) = 5.4 Gy
(boost)
II course (PTV2) = 5.4 Gy
(boost, excludes the two
inguinal nodes regions)
Target volumes PTV1 = 564 cm
3
PTV1 = 109 cm
3
PTV1 = 618 cm
3
PTV1 = 1234 cm
3
PTV2 = 549 cm
3
PTV2 = 72 cm
3
PTV2 = 193 cm
3
Organs at risk dose
objectives
Lung
1
< 15 Gy Lung
1
< 15 Gy Rectum
1
< 40 Gy Kidney
1
< 10 Gy
Heart
1
< 30 Gy Heart
1
< 30 Gy Bladder
1
< 30 Gy
Vertebra
1
< 20 Gy Vertebra
1
< 20 Gy Uterus
1
< 20 Gy
Spinal cord
2
< 45 Gy Spinal cord
2
< 45 Gy Femural heads
1
< 20 Gy
Beam arrangement 6 fields. (both courses)
Gantry angles:
180, 165, 125, 90, 60, 340
7 fields. (both courses)
Gantry angles:
0, 30, 100, 130, 230, 260,
330
I course: 7 fields.
Gantry angles:
0, 51, 103, 154, 206, 257,
308
5 fields
Gantry angles:
0, 72, 144, 216, 288
II course: 5 fields:
Gantry angles:
0, 72, 125, 235, 288
1: mean dose; 2: maximum dose
Radiation Oncology 2007, 2:7 />Page 4 of 21
(page number not for citation purposes)
methods: one related to physical quantities and the other
to a combination of physical and 'biological' (Equivalent
Uniform Dose, EUD) quantities and was therefore consid-
ered twice. Hyperion combined 'biological' optimisation
with a Monte Carlo (MC) engine. All the other TPS have
optimisation engines which rely on physical optimisation
only and dose calculation was performed using either
pencil beam (PB) or convolution/superposition algo-
rithms such as the Collapsed Cone (CC) or the Aniso-
tropic Analytical Algorithm (AAA) or MonteCarlo (MC).
All TPS (except Eclipse and KonRad) supported only static
segmental (step-and-shoot) IMRT; Eclipse plans in the
present study used dynamic (sliding window) MLC
sequencing. The number of intensity levels (IL) used by
the static systems to discretise individual beam fluence
was generally 10. For Corvus IL was set to 3, but it is an
aperture based system with manual segment generation
and inverse optimisation of the segment weights. For
Hyperion, the segmentation process does not use ILs,
rather a set of constraints such as segment size, dose per
segment and total number of segments. For OMP and
Pinnacle
3
the total number of segments, the segment size
and the minimum MU per segment are the set parameters.
A set of procedural guidelines was defined including spec-
ifications of the PObj's to fulfil. Given the specifics of each
TPS, the choice of numerical objectives translating the
PObj into e.g. dose-volume constraints was not fixed. Also
'dummy' volumes, steering the optimisation engines to
improve results, were allowed to compare the 'best' plans
under given conditions [20]. To avoid variability in the
results due to different beam arrangements, the number of
fields and the beam geometry were fixed. Bolus was
allowed if required. All plans were designed for 6 MV pho-
ton beams using multileaf collimators with 80 or 120
leaves. The three following objectives should be achieved:
i) target coverage (min. dose 90%, max. dose 107%), ii)
OAR sparing to at least the limits stated in table 1, iii)
sparing of healthy tissue (HTis, defined as the CT dataset
patient volume minus the volume of the largest target).
The dose limits on OARs and HTis were strengthened by
the additional requirement to minimise the volumes
involved. No specific model for the calculation of the risk
of secondary cancer induction was applied because of no
consensus about their value. Hence, the analysis was lim-
ited to the evaluation of physical quantities. Every TPS was
required, using whichever method, to minimise the
involvement of HTis. The dose constraints reported in
table 1 are specific to paediatric cases and more restrictive
than the corresponding for adults and all were derived
from specific literature publications.
The cases and indications were selected in order to obtain
a minimal set of complicate planning situations with spe-
cific challenges to resolve to test TPS capabilities.
For patient 1 the main challenges were: the target was
adjacent to the spinal cord, partially inside the lung with
a long scar (about 5 cm) generating a secondary target vol-
ume, separated from the main one, smaller in volume and
located along the thoracic wall but requiring simultane-
ous irradiation. Complementary to these geometrical con-
ditions, there is a generic need, in paediatrics, to generate
rather symmetric irradiation of the body (in this case the
vertebrae) to prevent potential risks of asymmetric
growth.
For patient 2, the location of the target in the mediasti-
num would be relevant in terms of large dose baths in the
lung (and eventually breast) regions.
For patient 3, the target volume was divided into three
unconnected regions (the anal volume and the two
inguinal node regions) with organs at risk generally posi-
tioned in-between the three targets (as uterus, bladder and
rectum).
For patient 4, the target volume was given by the entire
liver and the main organ at risk was the right kidney with
a low tolerance, located proximal/adjacent to the target.
The sparing of this kidney had a very high priority since
the patient underwent left nephrectomy.
Table 2: TPS characteristics and references
TPS, release Calculation alg. Optimisation alg. References
Corvus, 5.0 Corvus Pencil beam Simulated annealing [25]
Eclipse, 7.5.14.3 Eclipse Anisotropic Analytical Algorithm (AAA) Conjugated gradient [26,27,28,29,30,31,32]
Hyperion, 2.1.4 Hyperion Monte Carlo Conjugate gradient [33,34,35,36]
KonRad, 2.2.18 KonRad Pencil beam Conjugate gradient [37,38]
Oncentra Master Plan, 1.5 OMP Pencil beam Conjugate gradient [39,40]
Pinnacle
3
EUD, 7.4f PinnEUD Collapsed cone Gradient based, sequential quadratic
programming
[41,42,43,44]
Pinnacle
3
Phys, 7.4f PinnPhy Collapsed cone Gradient based, sequential quadratic
programming
[42,45,46]
PrecisePLAN, 2.03 Precise Pencil beam Cimmino [47]
Radiation Oncology 2007, 2:7 />Page 5 of 21
(page number not for citation purposes)
For patients 1, 2 and 3, treatment plans were generated for
two separate treatment courses and for the complete treat-
ment, as the sum of partial plans according to dose pre-
scriptions reported in table 1. In no case was the concept
of simultaneous integrated boost (SIB) applied. All TPS,
except KonRad (in the implementation used although in
principle possible), were able to produce the summed
plan; for KonRad, only the mean doses to the VOIs were
used in the analysis of the entire treatment since the sum
of the mean doses in a VOI is equal to the mean dose of
the summed plan in that VOI. The maximum point dose
reported for the entire treatment for KonRad plans was
recorded as the sum of the two separate plan maximum
doses, even if this value could be overestimated (does not
take into account the actual location of the individual
plan maxima).
The TPS can be divided into two families: a first, where the
two courses are planned independently (Corvus, Eclipse,
KonRad) and a second, where the plans for the second
course are optimised based upon knowledge of the dose
distribution already "accumulated" in the first course
(Hyperion, OMP, Pinnacle
3
, Precise). In principle, Kon-
Rad could belong to the second family, but in the present
study it was not the case.
The number of MU/Gy has been investigated since in
pediatric radiation oncology this is a highly relevant issue
in terms of possible induction of secondary malignancies.
MU values from the different TPS were normalised to a
virtual output of 1 Gy for 100 MU, 10 × 10 cm
2
field, SSD
= 90 cm and 10 cm depth (isocentre).
Evaluation tools
The analysis was based on isodose distributions and on
physical DVHs of PTVs, OARs and HTis. From DVHs, the
following parameters were compared: D
x
(the dose
received by x% of the volume); V
y
(the volume receiving
at least y dose (in percentage of the prescribed dose or in
Gy)); mean dose; maximum and minimum point doses;
maximum and minimum significant doses defined as D
1%
and D
99%
respectively, and standard deviation (SD).
For HTis we also report the volume receiving at least 10 Gy
normalised to the elective PTV (nV
10 Gy
) to assess the rela-
tive extent of irradiation at low dose levels.
A Conformity Index (CI) was defined for each PTV and
treatment course as the ratio of the volume receiving 90%
of the dose prescribed for this specific volume and the PTV
itself.
Finally, to introduce a plan ranking, a 'goodness' parame-
ter was defined for OARs (including HTis) and PTVs:
where the sum is extended to the number of evaluated
OARs or PTVs (nOAR or nPTV), Val
plan
is, for each chosen
parameter (one for each VOI, e.g. mean dose to the lung),
the value found after DVH analysis of the sum plans; PObj
are the relative plan objectives as in table 1. For HTis the
V
10 Gy
parameter was chosen and, as PObj, the mean value
of the parameter over all the TPS for each patient was
used. The sum is normalised to the number of OARs or
PTVs used. For PTVs, the Score analyses the fraction of vol-
ume receiving less than the 90% or more than the 107%
of the prescribed dose in the first course plan and, for the
boost, it analyses the data of the summed plans. In this
way, the TPS of the second family are not penalised.
According to the definition, the Score should be as low as
possible and smaller than 1.
In the evaluation phase, plans were considered as accept-
able if respecting (or minimally violating) the planning
objectives and plans with lower scores were considered
preferable.
Results
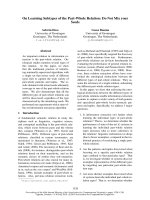
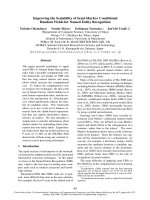
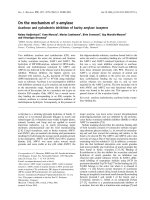
Figures 1 and 2 present, for a representative CT image, the
dose distribution for the four patients, the PTVs shown in
black and some relevant OARs in white. Data are reported
for the total plan (i.e. sum of plans for PTV1 and PTV2 for
the first 3 patients).
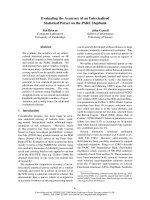
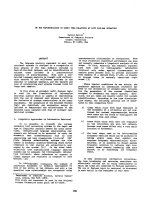
Figures 3, 4, 5, 6 show the DVH of PTV2 (PTV for patient
4) and for the involved OAR for the total treatment for
each patient and for all TPS.
From the dose distribution figures it is possible to qualita-
tively appraise the different degrees of conformal avoid-
ance, the extension of the low dose areas, the degree of
uniformity of doses within the PTVs and the potential
presence of hot spots.
Table 3 presents for all OARs, PTVs and HTis, for all
patients and for the most relevant parameters, the PObj
and the average values computed over all the TPS. Uncer-
tainty is given at one standard deviation (SD). Data for
OARs are given for the total plans while for the first three
patients PTV data are given for the two courses separately
and, for PTV2 only, also for the total treatment (PTV2
(total)).
Score OAR
nOAR
Val PObj
plan
OAR
n
n
()=
()
()
∑
1
1
Score PTV
nPTV
Val PObj
plan
PTV
n
n
()=
()
()
∑
1
2
Radiation Oncology 2007, 2:7 />Page 6 of 21
(page number not for citation purposes)
Table 4 reports the averages, computed over the four
patients and over all the PTVs (analysing the single plans),
of the parameters expressing the degree of target coverage
for all the TPS. For D
1%
and D
99%
the data are reported as
percentage of the prescribed dose for each PTV.
Tables 5, 6, 7, 8 present for each patient the same param-
eters with the findings for each TPS.
In all Figures, the KonRad data are shown only for the last
patient while in the tables, the results are shown only for
the mean and maximum point doses for the summed
plans since dose distributions could not be summed up,
as described above.
Target coverage
For PTV1 and PTV2 the analysis was conducted also for
the DVHs of the separate courses. In this case, the results
for the TPS of the second family, are poorer for the boost
for the reason described in the methods (CI, in some
cases, e.g. Patient 1, is even lower than 1). This feature also
affects the results in table 4 which shall therefore be con-
sidered with some caution for Hyperion, OMP, Pinnacle
3
and Precise (e.g. CI).
Analysing the data, it is possible to notice certain uniform-
ity of results for most of the parameters. In some cases,
these are all sub-optimally fitting the objectives and prove
the difficulty of all the TPS to achieve high conformality
on targets when, as for paediatric cases, the fulfilment of
dose constraints for OARs and HTis is emphasised. The
risk of under dosage of the PTV is common to all TPS (e.g.,
from table 4 and complementary tables, V
90%
and D
99%
present large deviations from the ideal objective values).
For Patient 1, PinnEUD showed a large over dosage of the
PTV2 (total) where V
107%
= 23% (table 5); this is signifi-
Dose distributions of the summed plan (overall treatment) for Patient 1 and Patient 2Figure 1
Dose distributions of the summed plan (overall treatment) for Patient 1 and Patient 2.
Eclipse
Corvus
HyperionMC
OMP
PinnaclePHY
PinnacleEUD
Precise
16.3 Gy (30% of 54.4 Gy)
27.2 Gy (50% of 54.4 Gy)
38.1 Gy (70% of 54.4 Gy)
44.8 Gy (prescr. dose PTV1)
54.4 Gy (total prescr. dose)
59.8 Gy (110% of 54.4 Gy)
Patient 1
Corvus
Eclipse
HyperionMC
OMP
PinnaclePHY
PinnacleEUD
Precise
15.1 Gy (30% of 50.4 Gy)
25.2 Gy (50% of 50.4 Gy)
35.3 Gy (70% of 50.4 Gy)
45.0 Gy (prescr. dose PTV1)
50.4 Gy (total prescr. dose)
55.4 Gy (110% of 50.4 Gy)
Patient 2
Radiation Oncology 2007, 2:7 />Page 7 of 21
(page number not for citation purposes)
cantly different from all other cases. For the two most
complicated cases, OMP showed the best values for
patient 1 (difficult for the small superficial scar volume),
and Hyperion for patient 3 (difficult for the positioning of
the three PTVs with particularly radiosensitive OARs in
between).
Organs at risk
Given the different anatomical location of the tumours
and the different PObj for each OAR, each of the 4
patients is considered separately.
Patient 1: the objective selected for the vertebra (that was
partially included in the target) was respected only by
OMP (table 5) (and almost by Hyperion). Doses larger
than 25 Gy were observed for Precise and PinnPhy. The
PObj for spinal cord was only not reached by PinnPhy
(looking at the maximum point dose) but the limit was
not violated if D
1%
is considered. All TPS respected the
constraint on the mean dose to contra lateral lung and
Hyperion was the only TPS to (almost) keep the mean
dose to the uninvolved omolateral lung below 15 Gy.
KonRad was the only TPS not able to reach the objective
for the heart. Averaging over the TPS, the PObj were not
respected for the vertebra and for the uninvolved omola-
teral lung (table 3).
Patient 2: PObj's were respected by all TPS, with the minor
exception of PinnPhy where the mean dose to the vertebra
was 20.8 Gy instead of 20 Gy.
Patient 3: From table 3, on average, all objectives were
respected. For the mean uterus dose of 20 Gy, Precise
(21.5 Gy), KonRad (20.5 Gy) and OMP (20.5 Gy) show
minor violations. Bladder and Rectum did not cause any
problems (OMP reached the limit on the bladder; Hyper-
Dose distributions of the summed plan (overall treatment) for Patient 3 and Patient 4Figure 2
Dose distributions of the summed plan (overall treatment) for Patient 3 and Patient 4.
Precise
Corvus
Eclipse
HyperionMC
OMP
PinnaclePHY
PinnacleEUD
15.1 Gy (30% of 50.4 Gy)
25.2 Gy (50% of 50.4 Gy)
35.3 Gy (70% of 50.4 Gy)
45.0 Gy (prescr. dose PTV1)
50.4 Gy (total prescr. dose)
55.4 Gy (110% of 50.4 Gy)
5.4 Gy (30% of 18 Gy)
9.0 Gy (50% of 18 Gy)
12.6 Gy (70% of 18 Gy)
16.2 Gy (90% of 18 Gy)
18.0 Gy (total prescr. dose)
19.8 Gy (110% of 18 Gy)
Corvus
HyperionMC
PinnaclePHY
Precise
Eclipse
OMP
PinnacleEUD
KonRad
Patient 3 Patient 4
Radiation Oncology 2007, 2:7 />Page 8 of 21
(page number not for citation purposes)
Dose-Volume Histograms for targets and all organs at risk for Patient 1Figure 3
Dose-Volume Histograms for targets and all organs at risk for Patient 1. Data refer to the complete treatment.
Dose [Gy]
0 102030405060
Volume [%]
0
20
40
60
80
100
120
PTV2
Corvus
Eclipse
Hyperion
OMP
Pinnacle EUD
Pinnacle PHY
Precise
Corvus
Eclipse
Hyperion
OMP
Pinnacle EUD
Pinnacle PHY
Precise
Corvus
Eclipse
Hyperion
OMP
Pinnacle EUD
Pinnacle PHY
Precise
Corvus
Eclipse
Hyperion
OMP
Pinnacle EUD
Pinnacle PHY
Precise
Corvus
Eclipse
Hyperion
OMP
Pinnacle EUD
Pinnacle PHY
Precise
Corvus
Eclipse
Hyperion
OMP
Pinnacle EUD
Pinnacle PHY
Precise
Corvus
Eclipse
Hyperion
OMP
Pinnacle EUD
Pinnacle PHY
Precise
Dose [Gy]
0 1020 30405060
Volume [%]
0
20
40
60
80
100
120
PTV1-PTV2
Corvus
Eclipse
Hyperion
OMP
Pinnacle EUD
Pinnacle PHY
Precise
Corvus
Eclipse
Hyperion
OMP
Pinnacle EUD
Pinnacle PHY
Precise
Corvus
Eclipse
Hyperion
OMP
Pinnacle EUD
Pinnacle PHY
Precise
Corvus
Eclipse
Hyperion
OMP
Pinnacle EUD
Pinnacle PHY
Precise
Corvus
Eclipse
Hyperion
OMP
Pinnacle EUD
Pinnacle PHY
Precise
Corvus
Eclipse
Hyperion
OMP
Pinnacle EUD
Pinnacle PHY
Precise
Corvus
Eclipse
Hyperion
OMP
Pinnacle EUD
Pinnacle PHY
Precise
Dose [Gy]
0 102030405060
Volume [%]
0
20
40
60
80
100
120
Vertebra
Corvus
Eclipse
Hyperion
OMP
Pinnacle EUD
Pinnacle PHY
Precise
Corvus
Eclipse
Hyperion
OMP
Pinnacle EUD
Pinnacle PHY
Precise
Corvus
Eclipse
Hyperion
OMP
Pinnacle EUD
Pinnacle PHY
Precise
Corvus
Eclipse
Hyperion
OMP
Pinnacle EUD
Pinnacle PHY
Precise
Corvus
Eclipse
Hyperion
OMP
Pinnacle EUD
Pinnacle PHY
Precise
Corvus
Eclipse
Hyperion
OMP
Pinnacle EUD
Pinnacle PHY
Precise
Corvus
Eclipse
Hyperion
OMP
Pinnacle EUD
Pinnacle PHY
Precise
Dose [Gy]
0 1020 30405060
Volume [%]
0
20
40
60
80
100
120
Spinal Cord
Corvus
Eclipse
Hyperion
OMP
Pinnacle EUD
Pinnacle PHY
Precise
Corvus
Eclipse
Hyperion
OMP
Pinnacle EUD
Pinnacle PHY
Precise
Corvus
Eclipse
Hyperion
OMP
Pinnacle EUD
Pinnacle PHY
Precise
Corvus
Eclipse
Hyperion
OMP
Pinnacle EUD
Pinnacle PHY
Precise
Corvus
Eclipse
Hyperion
OMP
Pinnacle EUD
Pinnacle PHY
Precise
Corvus
Eclipse
Hyperion
OMP
Pinnacle EUD
Pinnacle PHY
Precise
Corvus
Eclipse
Hyperion
OMP
Pinnacle EUD
Pinnacle PHY
Precise
Dose [Gy]
0 102030405060
Volume [%]
0
20
40
60
80
100
120
Right Lung
Corvus
Eclipse
Hyperion
OMP
Pinnacle EUD
Pinnacle PHY
Precise
Corvus
Eclipse
Hyperion
OMP
Pinnacle EUD
Pinnacle PHY
Precise
Corvus
Eclipse
Hyperion
OMP
Pinnacle EUD
Pinnacle PHY
Precise
Corvus
Eclipse
Hyperion
OMP
Pinnacle EUD
Pinnacle PHY
Precise
Corvus
Eclipse
Hyperion
OMP
Pinnacle EUD
Pinnacle PHY
Precise
Corvus
Eclipse
Hyperion
OMP
Pinnacle EUD
Pinnacle PHY
Precise
Corvus
Eclipse
Hyperion
OMP
Pinnacle EUD
Pinnacle PHY
Precise
Dose [Gy]
0 1020 30405060
Volume [%]
0
20
40
60
80
100
120
Left uninvolved Lung
Corvus
Eclipse
Hyperion
OMP
Pinnacle EUD
Pinnacle PHY
Precise
Corvus
Eclipse
Hyperion
OMP
Pinnacle EUD
Pinnacle PHY
Precise
Corvus
Eclipse
Hyperion
OMP
Pinnacle EUD
Pinnacle PHY
Precise
Corvus
Eclipse
Hyperion
OMP
Pinnacle EUD
Pinnacle PHY
Precise
Corvus
Eclipse
Hyperion
OMP
Pinnacle EUD
Pinnacle PHY
Precise
Corvus
Eclipse
Hyperion
OMP
Pinnacle EUD
Pinnacle PHY
Precise
Corvus
Eclipse
Hyperion
OMP
Pinnacle EUD
Pinnacle PHY
Precise
Dose [Gy]
0 102030405060
Volume [%]
0
20
40
60
80
100
120
Heart
Corvus
Eclipse
Hyperion
OMP
Pinnacle EUD
Pinnacle PHY
Precise
Corvus
Eclipse
Hyperion
OMP
Pinnacle EUD
Pinnacle PHY
Precise
Corvus
Eclipse
Hyperion
OMP
Pinnacle EUD
Pinnacle PHY
Precise
Corvus
Eclipse
Hyperion
OMP
Pinnacle EUD
Pinnacle PHY
Precise
Corvus
Eclipse
Hyperion
OMP
Pinnacle EUD
Pinnacle PHY
Precise
Corvus
Eclipse
Hyperion
OMP
Pinnacle EUD
Pinnacle PHY
Precise
Corvus
Eclipse
Hyperion
OMP
Pinnacle EUD
Pinnacle PHY
Precise
Dose [Gy]
0 1020 30405060
Volume [%]
0
20
40
60
80
100
120
Healthy Tissue
Corvus
Eclipse
Hyperion
OMP
Pinnacle EUD
Pinnacle PHY
Precise
Corvus
Eclipse
Hyperion
OMP
Pinnacle EUD
Pinnacle PHY
Precise
Corvus
Eclipse
Hyperion
OMP
Pinnacle EUD
Pinnacle PHY
Precise
Corvus
Eclipse
Hyperion
OMP
Pinnacle EUD
Pinnacle PHY
Precise
Corvus
Eclipse
Hyperion
OMP
Pinnacle EUD
Pinnacle PHY
Precise
Corvus
Eclipse
Hyperion
OMP
Pinnacle EUD
Pinnacle PHY
Precise
Corvus
Eclipse
Hyperion
OMP
Pinnacle EUD
Pinnacle PHY
Precise
Radiation Oncology 2007, 2:7 />Page 9 of 21
(page number not for citation purposes)
Dose-Volume Histograms for targets and all organs at risk for Patient 2Figure 4
Dose-Volume Histograms for targets and all organs at risk for Patient 2. Data refer to the complete treatment.
Dose [Gy]
0 102030405060
Volume [%]
0
20
40
60
80
100
120
PTV2
Corvus
Eclipse
Hyperion
OMP
Pinnacle EUD
Pinnacle PHY
Precise
Corvus
Eclipse
Hyperion
OMP
Pinnacle EUD
Pinnacle PHY
Precise
Corvus
Eclipse
Hyperion
OMP
Pinnacle EUD
Pinnacle PHY
Precise
Corvus
Eclipse
Hyperion
OMP
Pinnacle EUD
Pinnacle PHY
Precise
Corvus
Eclipse
Hyperion
OMP
Pinnacle EUD
Pinnacle PHY
Precise
Corvus
Eclipse
Hyperion
OMP
Pinnacle EUD
Pinnacle PHY
Precise
Corvus
Eclipse
Hyperion
OMP
Pinnacle EUD
Pinnacle PHY
Precise
Dose [Gy]
0 102030405060
Volume [%]
0
20
40
60
80
100
120
PTV1-PTV2
Corvus
Eclipse
Hyperion
OMP
Pinnacle EUD
Pinnacle PHY
Precise
Corvus
Eclipse
Hyperion
OMP
Pinnacle EUD
Pinnacle PHY
Precise
Corvus
Eclipse
Hyperion
OMP
Pinnacle EUD
Pinnacle PHY
Precise
Corvus
Eclipse
Hyperion
OMP
Pinnacle EUD
Pinnacle PHY
Precise
Corvus
Eclipse
Hyperion
OMP
Pinnacle EUD
Pinnacle PHY
Precise
Corvus
Eclipse
Hyperion
OMP
Pinnacle EUD
Pinnacle PHY
Precise
Corvus
Eclipse
Hyperion
OMP
Pinnacle EUD
Pinnacle PHY
Precise
Dose [Gy]
0 102030405060
Volume [%]
0
20
40
60
80
100
120
Vertebra
Corvus
Eclipse
Hyperion
OMP
Pinnacle EUD
Pinnacle PHY
Precise
Corvus
Eclipse
Hyperion
OMP
Pinnacle EUD
Pinnacle PHY
Precise
Corvus
Eclipse
Hyperion
OMP
Pinnacle EUD
Pinnacle PHY
Precise
Corvus
Eclipse
Hyperion
OMP
Pinnacle EUD
Pinnacle PHY
Precise
Corvus
Eclipse
Hyperion
OMP
Pinnacle EUD
Pinnacle PHY
Precise
Corvus
Eclipse
Hyperion
OMP
Pinnacle EUD
Pinnacle PHY
Precise
Corvus
Eclipse
Hyperion
OMP
Pinnacle EUD
Pinnacle PHY
Precise
Dose [Gy]
0 102030405060
Volume [%]
0
20
40
60
80
100
120
Spinal Cord
Corvus
Eclipse
Hyperion
OMP
Pinnacle EUD
Pinnacle PHY
Precise
Corvus
Eclipse
Hyperion
OMP
Pinnacle EUD
Pinnacle PHY
Precise
Corvus
Eclipse
Hyperion
OMP
Pinnacle EUD
Pinnacle PHY
Precise
Corvus
Eclipse
Hyperion
OMP
Pinnacle EUD
Pinnacle PHY
Precise
Corvus
Eclipse
Hyperion
OMP
Pinnacle EUD
Pinnacle PHY
Precise
Corvus
Eclipse
Hyperion
OMP
Pinnacle EUD
Pinnacle PHY
Precise
Corvus
Eclipse
Hyperion
OMP
Pinnacle EUD
Pinnacle PHY
Precise
Dose [Gy]
0 102030405060
Volume [%]
0
20
40
60
80
100
120
Right Lung
Corvus
Eclipse
Hyperion
OMP
Pinnacle EUD
Pinnacle PHY
Precise
Corvus
Eclipse
Hyperion
OMP
Pinnacle EUD
Pinnacle PHY
Precise
Corvus
Eclipse
Hyperion
OMP
Pinnacle EUD
Pinnacle PHY
Precise
Corvus
Eclipse
Hyperion
OMP
Pinnacle EUD
Pinnacle PHY
Precise
Corvus
Eclipse
Hyperion
OMP
Pinnacle EUD
Pinnacle PHY
Precise
Corvus
Eclipse
Hyperion
OMP
Pinnacle EUD
Pinnacle PHY
Precise
Corvus
Eclipse
Hyperion
OMP
Pinnacle EUD
Pinnacle PHY
Precise
Dose [Gy]
0 102030405060
Volume [%]
0
20
40
60
80
100
120
Left Lung
Corvus
Eclipse
Hyperion
OMP
Pinnacle EUD
Pinnacle PHY
Precise
Corvus
Eclipse
Hyperion
OMP
Pinnacle EUD
Pinnacle PHY
Precise
Corvus
Eclipse
Hyperion
OMP
Pinnacle EUD
Pinnacle PHY
Precise
Corvus
Eclipse
Hyperion
OMP
Pinnacle EUD
Pinnacle PHY
Precise
Corvus
Eclipse
Hyperion
OMP
Pinnacle EUD
Pinnacle PHY
Precise
Corvus
Eclipse
Hyperion
OMP
Pinnacle EUD
Pinnacle PHY
Precise
Corvus
Eclipse
Hyperion
OMP
Pinnacle EUD
Pinnacle PHY
Precise
Dose [Gy]
0 102030405060
Volume [%]
0
20
40
60
80
100
120
Heart
Corvus
Eclipse
Hyperion
OMP
Pinnacle EUD
Pinnacle PHY
Precise
Corvus
Eclipse
Hyperion
OMP
Pinnacle EUD
Pinnacle PHY
Precise
Corvus
Eclipse
Hyperion
OMP
Pinnacle EUD
Pinnacle PHY
Precise
Corvus
Eclipse
Hyperion
OMP
Pinnacle EUD
Pinnacle PHY
Precise
Corvus
Eclipse
Hyperion
OMP
Pinnacle EUD
Pinnacle PHY
Precise
Corvus
Eclipse
Hyperion
OMP
Pinnacle EUD
Pinnacle PHY
Precise
Corvus
Eclipse
Hyperion
OMP
Pinnacle EUD
Pinnacle PHY
Precise
Dose [Gy]
0 102030405060
Volume [%]
0
20
40
60
80
100
120
Healthy Tissue
Corvus
Eclipse
Hyperion
OMP
Pinnacle EUD
Pinnacle PHY
Precise
Corvus
Eclipse
Hyperion
OMP
Pinnacle EUD
Pinnacle PHY
Precise
Corvus
Eclipse
Hyperion
OMP
Pinnacle EUD
Pinnacle PHY
Precise
Corvus
Eclipse
Hyperion
OMP
Pinnacle EUD
Pinnacle PHY
Precise
Corvus
Eclipse
Hyperion
OMP
Pinnacle EUD
Pinnacle PHY
Precise
Corvus
Eclipse
Hyperion
OMP
Pinnacle EUD
Pinnacle PHY
Precise
Corvus
Eclipse
Hyperion
OMP
Pinnacle EUD
Pinnacle PHY
Precise
Radiation Oncology 2007, 2:7 />Page 10 of 21
(page number not for citation purposes)
Dose-Volume Histograms for targets and all organs at risk for Patient 3Figure 5
Dose-Volume Histograms for targets and all organs at risk for Patient 3. Data refer to the complete treatment.
Dose [Gy]
0 102030405060
Volume [%]
0
20
40
60
80
100
120
PTV2
Corvus
Eclipse
Hyperion
OMP
Pinnacle EUD
Pinnacle PHY
Precise
Corvus
Eclipse
Hyperion
OMP
Pinnacle EUD
Pinnacle PHY
Precise
Corvus
Eclipse
Hyperion
OMP
Pinnacle EUD
Pinnacle PHY
Precise
Corvus
Eclipse
Hyperion
OMP
Pinnacle EUD
Pinnacle PHY
Precise
Corvus
Eclipse
Hyperion
OMP
Pinnacle EUD
Pinnacle PHY
Precise
Corvus
Eclipse
Hyperion
OMP
Pinnacle EUD
Pinnacle PHY
Precise
Corvus
Eclipse
Hyperion
OMP
Pinnacle EUD
Pinnacle PHY
Precise
Dose [Gy]
0 102030405060
Volume [%]
0
20
40
60
80
100
120
PTV1-PTV2
Corvus
Eclipse
Hyperion
OMP
Pinnacle EUD
Pinnacle PHY
Precise
Corvus
Eclipse
Hyperion
OMP
Pinnacle EUD
Pinnacle PHY
Precise
Corvus
Eclipse
Hyperion
OMP
Pinnacle EUD
Pinnacle PHY
Precise
Corvus
Eclipse
Hyperion
OMP
Pinnacle EUD
Pinnacle PHY
Precise
Corvus
Eclipse
Hyperion
OMP
Pinnacle EUD
Pinnacle PHY
Precise
Corvus
Eclipse
Hyperion
OMP
Pinnacle EUD
Pinnacle PHY
Precise
Corvus
Eclipse
Hyperion
OMP
Pinnacle EUD
Pinnacle PHY
Precise
Dose [Gy]
0 102030405060
Volume [%]
0
20
40
60
80
100
120
Uterus
Corvus
Eclipse
Hyperion
OMP
Pinnacle EUD
Pinnacle PHY
Precise
Corvus
Eclipse
Hyperion
OMP
Pinnacle EUD
Pinnacle PHY
Precise
Corvus
Eclipse
Hyperion
OMP
Pinnacle EUD
Pinnacle PHY
Precise
Corvus
Eclipse
Hyperion
OMP
Pinnacle EUD
Pinnacle PHY
Precise
Corvus
Eclipse
Hyperion
OMP
Pinnacle EUD
Pinnacle PHY
Precise
Corvus
Eclipse
Hyperion
OMP
Pinnacle EUD
Pinnacle PHY
Precise
Corvus
Eclipse
Hyperion
OMP
Pinnacle EUD
Pinnacle PHY
Precise
Dose [Gy]
0 102030405060
Volume [%]
0
20
40
60
80
100
120
Rectum
Corvus
Eclipse
Hyperion
OMP
Pinnacle EUD
Pinnacle PHY
Precise
Corvus
Eclipse
Hyperion
OMP
Pinnacle EUD
Pinnacle PHY
Precise
Corvus
Eclipse
Hyperion
OMP
Pinnacle EUD
Pinnacle PHY
Precise
Corvus
Eclipse
Hyperion
OMP
Pinnacle EUD
Pinnacle PHY
Precise
Corvus
Eclipse
Hyperion
OMP
Pinnacle EUD
Pinnacle PHY
Precise
Corvus
Eclipse
Hyperion
OMP
Pinnacle EUD
Pinnacle PHY
Precise
Corvus
Eclipse
Hyperion
OMP
Pinnacle EUD
Pinnacle PHY
Precise
Dose [Gy]
0 102030405060
Volume [%]
0
20
40
60
80
100
120
Bladder
Corvus
Eclipse
Hyperion
OMP
Pinnacle EUD
Pinnacle PHY
Precise
Corvus
Eclipse
Hyperion
OMP
Pinnacle EUD
Pinnacle PHY
Precise
Corvus
Eclipse
Hyperion
OMP
Pinnacle EUD
Pinnacle PHY
Precise
Corvus
Eclipse
Hyperion
OMP
Pinnacle EUD
Pinnacle PHY
Precise
Corvus
Eclipse
Hyperion
OMP
Pinnacle EUD
Pinnacle PHY
Precise
Corvus
Eclipse
Hyperion
OMP
Pinnacle EUD
Pinnacle PHY
Precise
Corvus
Eclipse
Hyperion
OMP
Pinnacle EUD
Pinnacle PHY
Precise
Dose [Gy]
0 102030405060
Volume [%]
0
20
40
60
80
100
120
Right Femur
Corvus
Eclipse
Hyperion
OMP
Pinnacle EUD
Pinnacle PHY
Precise
Corvus
Eclipse
Hyperion
OMP
Pinnacle EUD
Pinnacle PHY
Precise
Corvus
Eclipse
Hyperion
OMP
Pinnacle EUD
Pinnacle PHY
Precise
Corvus
Eclipse
Hyperion
OMP
Pinnacle EUD
Pinnacle PHY
Precise
Corvus
Eclipse
Hyperion
OMP
Pinnacle EUD
Pinnacle PHY
Precise
Corvus
Eclipse
Hyperion
OMP
Pinnacle EUD
Pinnacle PHY
Precise
Corvus
Eclipse
Hyperion
OMP
Pinnacle EUD
Pinnacle PHY
Precise
Dose [Gy]
0 102030405060
Volume [%]
0
20
40
60
80
100
120
Left Femur
Corvus
Eclipse
Hyperion
OMP
Pinnacle EUD
Pinnacle PHY
Precise
Corvus
Eclipse
Hyperion
OMP
Pinnacle EUD
Pinnacle PHY
Precise
Corvus
Eclipse
Hyperion
OMP
Pinnacle EUD
Pinnacle PHY
Precise
Corvus
Eclipse
Hyperion
OMP
Pinnacle EUD
Pinnacle PHY
Precise
Corvus
Eclipse
Hyperion
OMP
Pinnacle EUD
Pinnacle PHY
Precise
Corvus
Eclipse
Hyperion
OMP
Pinnacle EUD
Pinnacle PHY
Precise
Corvus
Eclipse
Hyperion
OMP
Pinnacle EUD
Pinnacle PHY
Precise
Dose [Gy]
0 102030405060
Volume [%]
0
20
40
60
80
100
120
Healthy Tissue
Corvus
Eclipse
Hyperion
OMP
Pinnacle EUD
Pinnacle PHY
Precise
Corvus
Eclipse
Hyperion
OMP
Pinnacle EUD
Pinnacle PHY
Precise
Corvus
Eclipse
Hyperion
OMP
Pinnacle EUD
Pinnacle PHY
Precise
Corvus
Eclipse
Hyperion
OMP
Pinnacle EUD
Pinnacle PHY
Precise
Corvus
Eclipse
Hyperion
OMP
Pinnacle EUD
Pinnacle PHY
Precise
Corvus
Eclipse
Hyperion
OMP
Pinnacle EUD
Pinnacle PHY
Precise
Corvus
Eclipse
Hyperion
OMP
Pinnacle EUD
Pinnacle PHY
Precise
Radiation Oncology 2007, 2:7 />Page 11 of 21
(page number not for citation purposes)
ion and OMP presented V
40 Gy
larger than 20% in the rec-
tum). The mean dose to the femurs was violated quite
substantially by KonRad (both left and right femurs);
Eclipse showed a small deviation for the right femur; Pre-
cise was at the limit for both femurs.
Patient 4: the only OAR considered in this plan was the
right kidney, the only one in the patient (nephrectomy
had been performed to the left kidney). The PObj was
fixed very conservatively and a very high priority was
assigned to this organ during optimisation. All systems
respected the objective and the best values (in terms of
mean dose and V
5 Gy
) were reached by Eclipse (followed
by Hyperion).
Healthy tissue sparing
In the tables are reported, for HTis, the mean dose, the
maximum point dose, V
10 Gy
, nV
10 Gy
and V
90%
(to analyse
the presence of hot spots). KonRad was not completely
analysed (only mean and max doses are reported) except
for patient 4. Regarding V
10 Gy
, the best results were
achieved by Hyperion and Eclipse (patient 1), Precise and
Pinnacle
3
(patient 2), Eclipse (patients 3 and 4). V
10 Gy
is
interpreted as a global dose bath, and the mean values
ranged from 1060 ± 170 cm
3
(patient 2) to 3620 ± 240
cm
3
(patient 3). The value of nV
10 Gy
ranged from 1.2
(patient 4) to 9.5 (patient 2) if averaged over the TPS, and
from 5.0 for PinnEUD and Eclipse to 6.4 for OMP if aver-
aged over the patients.
The average values of V
90%
ranged from 24 ± 8 cm
3
(patient 2) to 334 ± 122 cm
3
(patient 4). The best results
were for Corvus (patient 1), PinnEUD (patient 2), Eclipse
(patients 3 and 4).
Considering the qualitative evaluation of dose distribu-
tions of figures 1 and 2 and the DVH of the figures 3, 4, 5,
6, it is clear, e.g. patients 3 and 4, that the high sparing of
Dose-Volume Histograms for the target and all organs at risk for Patient 4Figure 6
Dose-Volume Histograms for the target and all organs at risk for Patient 4.
PED1
Dose [Gy]
0246810121416182022
Volume [%]
0
20
40
60
80
100
120
PTV
Corvus
Eclipse
Hyperion
Konrad
OMP
Pinnacle EUD
Pinnacle PHY
Precise
Corvus
Eclipse
Hyperion
Konrad
OMP
Pinnacle EUD
Pinnacle PHY
Precise
Corvus
Eclipse
Hyperion
Konrad
OMP
Pinnacle EUD
Pinnacle PHY
Precise
Corvus
Eclipse
Hyperion
Konrad
OMP
Pinnacle EUD
Pinnacle PHY
Precise
Corvus
Eclipse
Hyperion
Konrad
OMP
Pinnacle EUD
Pinnacle PHY
Precise
Corvus
Eclipse
Hyperion
Konrad
OMP
Pinnacle EUD
Pinnacle PHY
Precise
Corvus
Eclipse
Hyperion
Konrad
OMP
Pinnacle EUD
Pinnacle PHY
Precise
Corvus
Eclipse
Hyperion
Konrad
OMP
Pinnacle EUD
Pinnacle PHY
Precise
Dose [Gy]
0 2 4 6 8 10121416182022
Volume [%]
0
20
40
60
80
100
120
Kidney
Corvus
Eclipse
Hyperion
Konrad
OMP
Pinnacle EUD
Pinnacle PHY
Precise
Corvus
Eclipse
Hyperion
Konrad
OMP
Pinnacle EUD
Pinnacle PHY
Precise
Corvus
Eclipse
Hyperion
Konrad
OMP
Pinnacle EUD
Pinnacle PHY
Precise
Corvus
Eclipse
Hyperion
Konrad
OMP
Pinnacle EUD
Pinnacle PHY
Precise
Corvus
Eclipse
Hyperion
Konrad
OMP
Pinnacle EUD
Pinnacle PHY
Precise
Corvus
Eclipse
Hyperion
Konrad
OMP
Pinnacle EUD
Pinnacle PHY
Precise
Corvus
Eclipse
Hyperion
Konrad
OMP
Pinnacle EUD
Pinnacle PHY
Precise
Corvus
Eclipse
Hyperion
Konrad
OMP
Pinnacle EUD
Pinnacle PHY
Precise
Dose [Gy]
0246810121416182022
Volume [%]
0
20
40
60
80
100
120
Healthy Tissue
Corvus
Eclipse
Hyperion
Konrad
OMP
Pinnacle EUD
Pinnacle PHY
Precise
Corvus
Eclipse
Hyperion
Konrad
OMP
Pinnacle EUD
Pinnacle PHY
Precise
Corvus
Eclipse
Hyperion
Konrad
OMP
Pinnacle EUD
Pinnacle PHY
Precise
Corvus
Eclipse
Hyperion
Konrad
OMP
Pinnacle EUD
Pinnacle PHY
Precise
Corvus
Eclipse
Hyperion
Konrad
OMP
Pinnacle EUD
Pinnacle PHY
Precise
Corvus
Eclipse
Hyperion
Konrad
OMP
Pinnacle EUD
Pinnacle PHY
Precise
Corvus
Eclipse
Hyperion
Konrad
OMP
Pinnacle EUD
Pinnacle PHY
Precise
Corvus
Eclipse
Hyperion
Konrad
OMP
Pinnacle EUD
Pinnacle PHY
Precise
Radiation Oncology 2007, 2:7 />Page 12 of 21
(page number not for citation purposes)
Table 3: Global results from total dose plan analysis. For each patient and parameter the average over all the planning systems is
shown, uncertainties are reported at 1 standard deviation.
Objectives Patient 1 Patient 2 Patient 3 Patient 4
PTV1 Prescription - 44.8 45.0 45.0 18.0
D
1%
Gy Prescript 50.4 ± 0.8 48.1 ± 1.5 50.2 ± 1.2 20.5 ± 0.9
D
99%
Gy Prescript 35.3 ± 2.2 40.5 ± 1.8 38.7 ± 1.3 14.4 ± 1.5
V
90%
% 100% 93.6 ± 2.6 98.4 ± 1.6 96.3 ± 2.5 96.7 ± 2.3
V
107%
% 0% 10.8 ± 5.4 2.7 ± 4.4 8.6 ± 4.9 9.4 ± 6.3
SD Gy 0 Gy 3.0 ± 0.5 1.5 ± 0.7 2.4 ± 0.5 1.1 ± 0.3
CI 1.0 1.14 ± 0.08 1.28 ± 0.10 1.58 ± 0.26 1.26 ± 0.14
PTV2 Prescription - 9.6 5.4 5.4 -
D
1%
Gy Prescript 11.4 ± 1.5 6.1 ± 0.6 6.6 ± 1.4 -
D
99%
Gy Prescript 6.1 ± 2.5 4.3 ± 0.7 3.9 ± 1.6 -
V
90%
% 100% 88.4 ± 10.9 91.8 ± 10.8 89.6 ± 16.9 -
V
107%
% 0% 18.6 ± 18.5 14.2 ± 16.5 14.6 ± 19.7 -
SD Gy 0 Gy 1.1 ± 1.0 0.4 ± 0.3 0.6 ± 0.7 -
CI 1.0 1.07 ± 0.15 1.37 ± 0.16 1.33 ± 0.13 -
PTV2 (total) Prescription - 54.4 50.4 50.4 -
Mean Gy Prescript. 54.1 ± 0.5 50.6 ± 0.2 50.2 ± 0.1 -
Max pt Gy Prescript 63.5 ± 2.7 54.2 ± 2.0 57.3 ± 2.1 -
D
1%
Gy Prescript 60.3 ± 1.3 53.1 ± 1.3 55.7 ± 1.6 -
D
99%
Gy Prescript 42.7 ± 1.4 46.8 ± 1.4 43.1 ± 1.3 -
V
90%
% 100% 91.3 ± 4.5 99.6 ± 0.6 95.4 ± 2.3 -
V
107%
% 0% 10.3 ± 7.6 1.4 ± 3.2 7.1 ± 3.9 -
Vertebra Mean Gy <20 Gy 22.8 ± 2.5 18.0 ± 1.8 - -
Spinal Cord Max pt Gy <45 Gy 33.3 ± 7.2 25.1 ± 4.7 - -
D
1%
Gy Minimise 29.0 ± 7.8 23.1 ± 3.9 - -
Right Lung Mean Gy < 15 Gy 10.8 ± 1.3 9.6 ± 1.5 - -
V
20 Gy
% Minimise 7.6 ± 4.4 18.8 ± 4.1 - -
Left (uninv.) Lung Mean Gy < 15 Gy 18.5 ± 2.2 12.6 ± 1.5 - -
V
20 Gy
% Minimise 38.3 ± 8.1 27.9 ± 6.0 - -
Heart Mean Gy <30 Gy 27.4 ± 2.6 3.9 ± 0.9 - -
Max pt Gy Minimise 55.1 ± 2.4 43.2 ± 6.9 - -
D
1%
Gy Minimise 51.4 ± 3.6 39.8 ± 7.8 - -
Uterus Mean Gy <20 Gy - - 18.9 ± 1.8 -
V
20 Gy
% Minimise - - 26.2 ± 20.6 -
Rectum Mean Gy <40 Gy - - 23.6 ± 3.1 -
V
40 Gy
% Minimise - - 15.3 ± 7.7 -
Bladder Mean Gy <30 Gy - - 24.4 ± 3.6 -
V
30 Gy
% Minimise - - 16.9 ± 15.8 -
Right Femur Mean Gy <20 Gy - - 19.2 ± 3.2 -
Max pt Gy Minimise - - 40.7 ± 3.6 -
Left Femur Mean Gy <20 Gy - - 18.7 ± 2.6 -
Max pt Gy Minimise - - 38.4 ± 4.0 -
Kidney Mean Gy <10 Gy - - - 7.9 ± 1.6
Max pt Gy Minimise - - - 15.0 ± 2.3
D
1%
Gy Minimise - - - 13.7 ± 2.0
V
5 Gy
% Minimise - - - 83.6 ± 20.3
Healthy tissue Mean Gy Minimise 8.2 ± 0.7 4.6 ± 0.7 13.7 ± 1.7 7.5 ± 0.8
Max pt Gy Minimise 61.6 ± 5.3 52.2 ± 2.2 57.0 ± 3.8 20.8 ± 1.7
V
10 Gy
cm
3
Minimise 2700 ± 300 1060 ± 170 3620 ± 240 1450 ± 300
nV
10 Gy
Minimise 4.8 ± 0.6 9.5 ± 1.7 5.8 ± 0.4 1.2 ± 0.3
V
90%
cm
3
Minimise 74 ± 30 24 ± 8 189 ± 120 334 ± 122
Radiation Oncology 2007, 2:7 />Page 13 of 21
(page number not for citation purposes)
OARs reached by Pinnacle
3
was counterbalanced by a
poorer management of the HTis. For the fourth patient,
the best sparing of the kidney obtained by Eclipse and
Hyperion was associated with a consistently better man-
agement of the HTis and a relatively low dose bath. The
effect (e.g. for Eclipse) is quite visible in the DVH of figure
6.
MU evaluation
MU/Gy are summarised in table 9. Over all TPS a mean
value of 256 MU/Gy has been determined, about twice
that of a 3DCRT plan. Precise and KonRad present the
lowest values, while Corvus and Eclipse the highest. The
use of the dynamic sliding window delivery (Eclipse) is
not significantly worse than the static segmental (step and
shoot) technique in this regard.
'Global plan quality'
The findings for the Score parameters are reported in table
10 for all TPS individually for the single patients and aver-
aged over the patients (uncertainty is given at one SD).
The lowest (better) average value was achieved for OARs
by Eclipse (0.75), the highest (worst) by PinnPhy (0.92),
for targets the best results were achieved by PinnPhy and
OMP (0.05 and 0.06).
Discussion
The study aimed to address the effectiveness of IMRT treat-
ment planning on various paediatric indications. The
study compared eight TPS with a common data set and
planning guidelines, reproducing the model already
adopted in a previous study on breast treatment [20]. The
complexity of IMRT planning on paediatric patients was
confirmed by the study. Differences in plans from various
TPS, both in terms of PTV coverage and OAR sparing, were
observed. Care has to be taken in ranking the TPS, since
the influence of user preferences on the planning results
has to be considered too: where goals cannot be achieved
simultaneously, some trade-off has to be found that satis-
fies the individual planner. In this context, the mean
scores do allow an assessment of both the TPS quality and
the user preferences.
Each patient case was selected as paradigmatic of some
planning challenge (exemplified in the methods) in com-
bination with very strict dose constraints deriving form
the paediatric environment. All plans sufficiently
respected objectives and won challenges, therefore the
general conclusion is that modern optimisation algo-
rithms can technically succeed in managing very restric-
tive conditions and are in principle considerable for
application in paediatric practice. Detailed studies on
individual paediatric pathologies could provide more
quantitative information on specific questions (with all
the complications arising from inter-patient variability
present in paediatrics) and statistically substantiate our
present proof of principles but this is a target that can be
achieved also in more common pathologies (as in the case
of breast for adults [20]) whereas the fundamental ques-
tion of understanding basic response of the main com-
mercial systems to paediatric IMRT is addressed by this
study.
Considering target coverage and limiting the discussion to
the second family of TPS, significantly heterogeneous
dose distributions were observed for the targets in the
boost courses. Considering as an example (without any
implication of merit) PinnEUD and patient 1, for PTV2,
the volume receiving less than 90% of the prescribed dose
(and dose/fraction) was about 31% (i.e.~1/3 of the PTV
received a dose per fraction lower than prescription), sim-
ilarly V
107%
was about 54% (~1/2 of the PTV received a
dose per fraction higher than prescription); as a conse-
quence only ~1/6 of the PTV would receive the prescribed
dose per fraction (within 90% and 107%). The biological
and clinical response of one third of the target volume
receiving low dose per fraction could raise some issue
about local control probability. This effect derived directly
from the optimisation and planning strategies imple-
mented for boost volumes that included the knowledge of
dose distributions computed for the previous course, that
in principle should try to compensate hot and cold spots.
This effect is enhanced by the fact that the boost dose is
significantly smaller than the dose prescribed to PTV1.
Hence, attention should be paid to keep the dose per frac-
Table 4: Global results on PTVs from dose plan analysis. For each TPS the averages over all the patients and target volumes are
shown, uncertainties are reported at 1 standard deviation. D
1%
and D
99%
are reported as percentage of the prescribed dose.
Objective Corvus
1
Eclipse
1
Hyperion
2
KonRad
1
OMP
2
PinnEUD
2
PinnPhy
2
Precise
2
D
1%
% 100 112 ± 2 107 ± 4 109 ± 4 113 ± 6 111 ± 5 126 ± 24 116 ± 13 114 ± 7
D
99%
% 100 81 ± 6 87 ± 5 82 ± 9 78 ± 10 87 ± 4 68 ± 31 77 ± 22 83 ± 7
V
90%
% 100% 93.8 ± 3.7 97.1 ± 2.6 95.2 ± 2.9 96.6 ± 2.0 97.8 ± 1.2 83.8 ± 18.5 88.4 ± 12.6 95.6 ± 3.3
V
107%
% 0% 13.3 ± 6.5 3.9 ± 5.6 5.9 ± 4.8 9.6 ± 5.7 4.6 ± 3.5 24.1 ± 21.7 18.7 ± 20.9 10.2 ± 6.9
SD Gy 0 Gy 1.63 ± 1.39 1.19 ± 1.15 1.37 ± 1.08 1.44 ± 1.12 1.14 ± 1.02 1.87 ± 0.88 1.26 ± 0.66 1.54 ± 1.36
CI 1.00 1.29 ± 0.29 1.16 ± 0.09 1.34 ± 0.24 1.26 ± 0.14 1.35 ± 0.16 1.28 ± 0.30 1.32 ± 0.30 1.31 ± 0.14
1
: TPS belonging to the first family type
2
: TPS belonging to the second family type
Radiation Oncology 2007, 2:7 />Page 14 of 21
(page number not for citation purposes)
Table 5: Results from dose plan analysis (total treatment) for Patient 1
Obj Corvus
1
Eclipse
1
Hyperion
2
KonRad
1
OMP
2
PinnEUD
2
PinnPhy
2
Precise
2
PTV1 (44.8 Gy)
D
1%
Gy Prescript 51.4 50.4 49.3 50.7 50.6 50.4 49.1 51.3
D
99%
Gy Prescript 34.2 36.7 32.9 33.2 36.8 37.9 37.8 32.7
V
90%
% 100% 89.8 93.7 91.6 92.7 96.7 96.4 96.3 91.6
V
107%
% 0% 18.9 10.5 7.7 14.0 6.4 7.3 4.1 17.1
SD Gy 0 Gy 3.7 2.7 3.2 3.3 2.7 2.4 2.3 3.5
CI 1.0 1.03 1.10 1.06 1.13 1.24 1.20 1.24 1.10
PTV2 (9.6 Gy)
D
1%
Gy Prescript 11.1 10.3 10.6 10.5 10.8 14.4 13.0 10.7
D
99%
Gy Prescript 6.6 8.3 7.5 5.8 7.8 0.8 4.5 7.3
V
90%
% 100% 87.9 97.7 94.4 96.8 96.1 69.3 74.1 91.2
V
107%
% 0% 22.6 1.2 6.2 4.6 6.9 53.6 37.5 16.5
SD Gy 0 Gy 0.9 0.4 0.6 0.6 0.6 3.3 1.7 0.7
CI 1.0 0.94 1.17 1.18 1.13 1.24 0.82 0.91 1.14
PTV2 (54.4 Gy)
Mean Gy 54.4 Gy 53.7 54.5 53.1 54.4 53.9 54.3 54.3 54.3
Max pt Gy Prescript 64.3 63.7 59.8 62.6 68.3 65.8 60.9 62.6
D
1%
Gy Prescript 60.8 60.2 57.6 - 60.2 61.5 60.1 61.6
D
99%
Gy Prescript 41.0 45.3 40.2 - 44.7 41.9 45.7 40.0
V
90%
% 100% 88.2 94.8 89.8 - 96.5 83.3 94.2 91.9
V
107%
% 0% 10.7 8.1 0.4 - 3.5 23.1 9.7 16.3
Vertebra
Mean Gy < 20 Gy 24.1 21.2 20.1 24.1 19.4 21.5 25.6 26.0
Spinal Cord
Max pt Gy < 45 Gy 38.0 27.8 23.4 35.1 27.4 33.2 46.2 35.6
D
1%
Gy Minimise 34.6 24.6 21.6 - 19.5 28.2 41.3 33.4
Right Lung
Mean Gy < 15 Gy 10.1 10.4 9.0 11.1 9.8 11.6 13.0 11.6
V
20 Gy
% Minimise 3.6 7.4 3.1 - 3.7 11.4 14.2 9.9
Left uninv. Lung
Mean Gy < 15 Gy 18.8 17.1 15.1 17.9 17.7 17.8 21.4 21.8
V
20 Gy
% Minimise 42.0 32.2 30.0 - 31.3 36.0 45.7 50.9
Heart
Mean Gy < 30 Gy 24.8 29.1 28.8 31.5 29.3 23.8 26.0 26.0
Max pt Gy Minimise 52.2 53.7 53.4 56.5 55.5 55.7 60.0 53.6
D
1%
Gy Minimise 45.7 50.0 50.4 - 53.1 52.9 57.4 50.0
Healthy tissue
Mean Gy Minimise 8.3 7.9 7.0 8.6 9.2 7.6 8.5 8.4
Max pt Gy Minimise 51.8 63.6 59.6 65.4 68.9 65.1 59.7 58.8
V
10 Gy
cm
3
Minimise 2810 2340 2310 - 2640 2770 3020 3040
nV
10 Gy
Minimise 4.9 4.1 4.0 - 4.9 4.7 5.2 5.6
V
90%
cm
3
Minimise 31 86 52 - 127 71 77 78
1
: TPS belonging to the first family type
2
: TPS belonging to the second family type
Radiation Oncology 2007, 2:7 />Page 15 of 21
(page number not for citation purposes)
Table 6: Results from dose plan analysis (total treatment) for Patient 2
Obj Corvus
1
Eclipse
1
Hyperion
2
KonRad
1
OMP
2
PinnEUD
2
PinnPhy
2
Precise
2
PTV1 (45 Gy)
D
1%
Gy Prescript 50.2 46.5 48.3 50.2 47.2 47.1 46.5 48.4
D
99%
Gy Prescript 38.6 40.7 38.9 38.9 41.2 42.2 43.7 39.9
V
90%
% 100% 96.0 99.2 96.3 98.0 99.5 99.9 100.0 98.4
V
107%
% 0% 12.5 0.0 1.4 5.7 0.0 0.1 0.1 1.9
SD Gy 0 Gy 2.5 1.3 1.9 2.1 1.2 0.9 0.6 1.8
CI 1.0 1.18 1.17 1.30 1.21 1.41 1.20 1.43 1.31
PTV2 (5.4 Gy)
D
1%
Gy Prescript 6.2 5.5 5.9 5.8 5.8 7.3 6.6 6.0
D
99%
Gy Prescript 4.5 5.0 4.6 4.2 4.7 3.0 3.6 4.8
V
90%
% 100% 96.6 99.8 95.0 97.2 97.8 72.3 76.8 98.6
V
107%
% 0% 16.7 0.0 8.2 4.5 0.9 41.6 37.3 5.3
SD Gy 0 Gy 0.3 0.1 0.3 0.3 0.2 1.0 0.7 0.2
CI 1.0 1.33 1.31 1.66 1.32 1.37 1.48 1.10 1.42
PTV2 (50.4 Gy)
Mean Gy 50.4 Gy 50.7 51.0 50.8 50.7 50.4 50.4 50.4 50.6
Maxpt Gy Prescript 56.8 52.2 54.1 56.9 52.9 53.2 52.1 55.5
D
1%
Gy Prescript 55.4 52.0 53.3 - 52.4 52.4 51.8 54.2
D
99%
Gy Prescript 44.8 48.0 45.7 - 47.2 47.3 48.7 45.7
V
90%
% 100% 98.5 100.0 99.2 - 100.0 99.9 100.0 99.5
V
107%
% 0% 8.5 0.0 0.0 - 0.0 0.0 0.0 1.5
Vertebra
Mean Gy < 20 Gy 15.1 17.8 16.5 19.0 16.8 19.2 20.8 19.0
Spinal Cord
Max pt Gy < 45 Gy 20.9 25.1 21.0 28.5 20.0 27.4 33.7 24.1
D
1%
Gy Minimise 19.6 23.5 20.0 - 19.1 26.4 29.7 23.4
Right Lung
Mean Gy < 15 Gy 8.2 8.7 9.6 12.0 10.8 9.5 10.2 7.5
V
20 Gy
% Minimise 15.0 17.3 20.6 - 24.1 20.9 21.5 12.4
Left Lung
Mean Gy < 15 Gy 10.9 12.9 13.2 14.4 14.5 11.1 12.4 11.1
V
20 Gy
% Minimise 23.8 31.6 32.4 - 37.3 20.6 23.3 26.2
Heart
Mean Gy < 30 Gy 3.7 2.7 4.2 4.7 4.8 4.0 4.5 2.3
Max pt Gy Minimise 50.2 49.0 49.8 41.4 44.9 37.3 42.6 30.5
D
1%
Gy Minimise 45.5 40.5 48.3 - 42.6 35.4 41.7 24.8
Healthy tissue
Mean Gy Minimise 4.4 4.4 4.8 4.2 6.0 4.3 4.9 3.9
Max pt Gy Minimise 55.1 49.9 53.5 53.3 50.3 50.7 50.0 54.5
V
10 Gy
cm
3
Minimise 1020 1090 1250 - 1320 910 980 860
nV
10 Gy
Minimise 8.8 10.0 10.0 - 12.9 7.9 8.5 8.4
V
90%
cm
3
Minimise 20 16 35 - 29 13 28 26
1
: TPS belonging to the first family type
2
: TPS belonging to the second family type
Radiation Oncology 2007, 2:7 />Page 16 of 21
(page number not for citation purposes)
Table 7: Results from dose plan analysis (total treatment) for Patient 3
Obj Corvus
1
Eclipse
1
Hyperion
2
KonRad
1
OMP
2
PinnEUD
2
PinnPhy
2
Precise
2
PTV1 (45 Gy)
D
1%
Gy Prescript 50.0 50.3 48.6 49.9 50.7 50.5 48.9 52.5
D
99%
Gy Prescript 35.4 38.0 39.6 40.1 39.3 39.4 40.1 37.6
V
90%
% 100% 92.7 93.5 97.9 98.6 97.5 97.7 98.7 93.7
V
107%
% 0% 11.0 13.3 2.1 6.2 9.9 7.8 2.5 15.9
SD Gy 0 Gy 2.9 2.8 1.9 2.0 2.4 2.2 1.6 3.2
CI 1.0 1.78 1.04 1.49 1.53 1.67 1.80 1.85 1.48
PTV2 (5.4 Gy)
D
1%
Gy Prescript 5.9 5.6 5.8 6.1 6.0 9.7 7.5 5.8
D
99%
Gy Prescript 4.6 4.9 5.0 4.6 4.7 1.0 1.6 4.7
V
90%
% 100% 96.8 99.1 99.5 97.7 97.9 53.4 74.1 98.3
V
107%
% 0% 4.2 0.0 1.2 13.6 4.3 44.4 47.3 2.1
SD Gy 0 Gy 0.2 0.1 0.2 0.3 0.2 2.1 1.3 0.2
CI 1.0 1.26 1.22 1.58 1.21 1.24 1.31 1.44 1.38
PTV2 (50.4 Gy)
Mean Gy 50.4 Gy 50.0 50.3 50.3 50.2 50.1 50.0 50.3 50.3
Maxpt Gy Prescript 57.6 57.5 54.2 56.3 56.7 58.0 56.8 61.6
D
1%
Gy Prescript 55.4 55.7 53.0 - 55.7 56.0 55.2 58.6
D
99%
Gy Prescript 40.8 42.5 45.0 - 44.1 42.5 43.0 43.6
V
90%
% 100% 92.8 93.8 98.7 - 97.0 92.8 96.6 96.2
V
107%
% 0% 6.6 9.1 0.0 - 9.0 9.4 4.0 11.4
Uterus
Mean Gy < 20 Gy 16.0 18.2 18.7 20.5 20.5 17.5 18.3 21.5
V
20 Gy
% Minimise 4.2 16.4 38.9 - 49.6 7.5 13.4 53.5
Rectum
Mean Gy < 40 Gy 19.0 21.2 27.4 27.3 25.4 21.7 24.7 21.8
V
40 Gy
% Minimise 2.3 12.1 26.7 - 21.9 13.5 14.2 16.8
Bladder
Mean Gy < 30 Gy 24.2 25.6 24.0 27.3 30.0 18.0 21.2 25.1
V
30 Gy
% Minimise 4.5 22.5 12.8 - 49.1 6.0 5.1 18.5
Right Femur
Mean Gy < 20 Gy 18.3 20.6 19.7 24.9 19.6 15.0 15.2 20.2
Max pt Gy Minimise 40.4 43.6 39.4 43.7 46.5 37.6 38.8 35.9
Left Femur
Mean Gy < 20 Gy 17.0 19.4 19.0 23.6 18.9 15.7 15.8 20.0
Max pt Gy Minimise 39.5 39.8 40.3 42.2 40.7 30.2 34.4 40.0
Healthy tissue
Mean Gy Minimise 13.9 11.3 13.3 16.9 13.8 14.1 14.3 11.8
Max pt Gy Minimise 59.1 52.6 50.7 57.5 56.8 58.0 58.6 62.6
V
10 Gy
cm
3
Minimise 3630 3190 3750 - 3750 3790 3840 3400
nV
10 Gy
Minimise 5.8 5.2 5.9 - 6.3 5.9 6.0 5.5
V
90%
cm
3
Minimise 328 22 123 - 78 319 264 190
1
: TPS belonging to the first family type
2
: TPS belonging to the second family type
Radiation Oncology 2007, 2:7 />Page 17 of 21
(page number not for citation purposes)
tion within certain limits if hot and/or cold spots should
be compensated (for example, in Hyperion, plans were
optimised with a mixture of dose per fraction and total
dose objectives).
The previous example clarifies extremely well the absolute
importance for centres willing to approach IMRT (not
only in paediatrics) to establish precise treatment proto-
cols, including fractionation issues and, depending on the
TPS available, it could be necessary to adapt historical tra-
ditions to technological constraints (this is very important
especially when simultaneous integrated boost tech-
niques are under discussion).
In the paediatric treatments, great care has to be taken on
OARs, and in the present study, the effort was put to have
better sparing; in some cases, this could lead to more dose
heterogeneity in the target. This is an issue that has to be
pursued with adequate objective definitions in the paedi-
atric field using dose constraints specific for paediatric
patients, from proper publications, which are significantly
different (and more demanding) from what normally
used for adults. Therefore, the results presented are appro-
priate to appraise the performances of different TPS under
the severe restrictions that shall be applied for paediatric
IMRT and not as a simple measure of TPS reliability for
IMRT, proven elsewhere [20]. It is obvious that, the more
restrictive the planning objectives are, the more difficult
the optimisation process should be. Nevertheless, the
qualitative pattern of results from the different TPS is
encouraging towards a possible usage in paediatric clini-
cal practice.
Another important point is linked to the analysis of the
HTis involvement. Assuming the need to reduce maxi-
mally the amount of HTis irradiated at any dose level, no
system was able to achieve the goal. Considering nV
10 Gy
,
it resulted in average at least 5 times greater than the target
volume (excluding patient 4 where the prescribed dose
was anyway low). In addition, a large variation was
observed among systems. Looking at the standard devia-
tion reported for V
10 Gy
in table 3, this ranged from 7%
(240 cm
3
) for patient 3 to 21% (300 cm
3
) for patient 4.
This variability among TPS should be seriously considered
when IMRT treatments are prescribed to children. The TPS
industry should be urged to introduce efficient tools to
cope with this need in their products, and some improve-
Table 9: MU/Gy for all TPS averaged over all patients (mean ±
SD, [range]).
TPS MU/Gy
Corvus 344 ± 174 [167, 648]
Eclipse 337 ± 188 [162, 684]
Hyperion 263 ± 129 [136, 513]
KonRad 191 ± 64 [145, 294]
OMP 263 ± 121 [149, 503]
PinnEUD 220 ± 86 [133, 316]
PinnPhy 238 ± 54 [172, 307]
Precise 190 ± 73 [133, 343]
Table 8: Results from dose plan analysis for Patient 4
Obj Corvus
1
Eclipse
1
Hyperion
2
KonRad
1
OMP
2
PinnEUD
2
PinnPhy
2
Precise
2
PTV1 (18 Gy)
Maxpt Gy Prescript 21.0 20.0 21.4 22.5 21.7 23.9 21.0 23.6
D
1%
Gy Prescript 20.0 19.5 20.4 21.6 19.8 21.7 19.6 21.4
D
99%
Gy Prescript 15.2 14.2 11.8 12.9 16.2 14.5 16.2 14.3
V
90%
% 100% 96.8 96.7 91.9 95.2 99.0 97.4 99.0 97.6
V
107%
% 0% 7.3 2.4 14.6 18.5 3.8 13.8 2.2 12.7
SD Gy 0 Gy 0.9 0.9 1.5 1.5 0.7 1.2 0.6 1.2
CI 1.0 1.53 1.12 1.11 1.30 1.28 1.16 1.27 1.31
Kidney
Mean Gy < 10 Gy 7.7 5.1 6.4 8.0 9.3 7.7 9.7 9.3
Max pt Gy Minimise 17.5 13.4 12.2 13.4 18.1 13.7 17.3 14.1
D
1%
Gy Minimise 14.8 12.0 11.3 12.5 16.7 12.7 16.0 13.4
V
5 Gy
% Minimise 78.6 39.7 72.2 97.2 98.0 87.8 97.3 98.1
Healthy tissue
Mean Gy Minimise 8.8 6.1 7.0 7.9 8.2 7.1 7.6 7.0
Max pt Gy Minimise 20.5 19.7 17.7 22.6 21.6 20.6 20.6 23.1
V
10 Gy
cm
3
Minimise 1920 970 1200 1580 1650 1380 1600 1300
nV
10 Gy
Minimise 1.9 0.8 0.9 1.3 1.4 1.1 1.3 1.1
V
90%
cm
3
Minimise 561 206 219 440 339 227 331 348
1
: TPS belonging to the first family type
2
: TPS belonging to the second family type
Radiation Oncology 2007, 2:7 />Page 18 of 21
(page number not for citation purposes)
ments appear to be coming from research developments
and pre-clinical releases. Nevertheless, it is fundamentally
impossible with photons to avoid the presence of rather
extended dose baths.
In terms of organs at risk, the study is affected by some
limitations that deserve clarification. For patient 2, breasts
were not explicitly included in the list of organs at risk and
for patient 3 the same applies to ovaries. Concerning
breast, in this case the issue is not heavy involvement of
the glands (i.e. irradiation at high dose levels) but rather
the dose bath and the potential for secondary cancer
induction. In the absence of reliable models to predict the
risk of secondary cancers (unfortunately all the studies
that appeared so far are not conclusive) it would be only
speculative to show data pointing to this endpoint. More-
over there are no values in literature that can reliably be
used as tolerance dose levels for breast irradiation (as an
organ) in children. Nevertheless, breasts were anyway
included in our analysis as part of the healthy tissue
(instead of considering them as specific organs) and there-
fore they were accounted for in the results presented for
generic healthy tissue.
Concerning ovaries, this is an even more delicate case
since dose tolerance (in the range of 4–12 Gy) changes,
decreasing, with increasing age. In principle it would be
appropriate to include these organs in the analysis but, in
the specific case, it was difficult to properly identify ova-
ries on the available CT dataset. The only viable solution
was, at the limit, to draw a likelihood region probably
including the ovaries. From the analysis point of view,
given the tolerance level very low with respect to the pre-
scribed dose (50.4 Gy), given the impossibility to have a
correct location of the organs, and given their close prox-
imity to the target, it would be hard to quote reliable pre-
dicted dose values for these organs to appraise IMRT
performances on an improperly defined object. Further-
more, the objective to keep the ovarian dose below 10%
of the prescribed dose (that is the tolerance level) is essen-
tially impossible with standard IMRT approaches for
physical reasons (scattering, penumbras and dose gradi-
ents). Since the ovaries are basically 'surrounded' by the
target; the trade-off between sufficient sparing and target
under dosage would be hardly acceptable. This means
that, in addition to the delineation problems mentioned
above, and in the present study at least, it was considered
as unavoidable to renounce to ovaries as a primary organs
at risk and we were forced to accept their compromission.
To give anyway a qualitative appraisal of the different sys-
tems, we recorded the dose to the 'ovarian region' result-
ing from the plans in the study, and this resulted to be of
the order of 30 Gy regardless from the TPS in the slices
where it was possible to roughly identify them. The lesson
to learn from this case is that, for IMRT in general and par-
ticularly for pediatrics, high spatial resolution and the
eventual need for combined imaging modalities or con-
trast agents should be considered as a priority for target
delineation and therefore we should all systematically
change our normal codes of practice (with also potential
financial implication depending on the reimbursement
schemes).
As proven in many other IMRT studies, the degree of con-
formal avoidance with photon based IMRT is not perfect
and trade-offs should be considered for complex situa-
tions. This proves to be particularly important in the case
of paediatric oncology due to low tolerances, small dis-
tances among organs, growth problems and risk of sec-
ondary cancer induction are all concurring elements that
could increase the interest for alternative treatment
modalities. In particular, the usage of protons, which is
Table 10: Global scores for the treatment plans. Scores for OARs and PTVs should be as low as possible and not larger than 1.
Corvus
1
Eclipse
1
Hyperion
2
KonRad
1
OMP
2
PinnEUD
2
PinnPhy
2
Precise
2
Patient 1 OARs 0.97 0.89 0.82 0.99 0.89 0.93 1.10 1.05
Targets 0.26 0.15 0.13 0.15 0.08 0.25 0.12 0.25
Patient 2 OARs 0.60 0.67 0.69 0.70 0.73 0.66 0.73 0.60
Targets 0.13 0.00 0.03 0.08 0.00 0.00 0.00 0.03
Patient 3 OARs 0.81 0.86 0.90 1.01 0.94 0.77 0.81 0.90
Targets 0.16 0.18 0.03 0.12 0.12 0.13 0.06 0.19
Patient 4 OARs 1.05 0.59 0.73 0.80 1.03 0.86 1.04 0.91
Targets 0.11 0.06 0.23 0.23 0.05 0.16 0.03 0.15
Mean ± SD OARs 0.86 ± 0.20 0.75 ± 0.15 0.79 ± 0.09 0.88 ± 0.15 0.90 ± 0.13 0.80 ± 0.12 0.92 ± 0.18 0.87 ± 0.19
Targets 0.16 ± 0.07 0.10 ± 0.08 0.10 ± 0.10 0.14 ± 0.07 0.06 ± 0.05 0.14 ± 0.05 0.05 ± 0.05 0.15 ± 0.09
1
: TPS belonging to the first family type
2
: TPS belonging to the second family type
Radiation Oncology 2007, 2:7 />Page 19 of 21
(page number not for citation purposes)
completely out of the aim of our study, should be men-
tioned as particularly interesting due to the excellent phys-
ical properties (lateral limited scattering and sharp fall-off
of doses at distal edge of the Bragg's peaks). Some studies
appeared and potentials are encouraging [23] even if care
should be put on the proton technique as pointed out by
Hall [19] since, for example, passive scattering modalities
could increase the neutron contaminations and the "MU"
needed to delivery the prescribed dose with potential
impact on the probability of secondary cancer induction.
More general and widespread comparative studies should
be necessary to identify proper indications but, in the
absence of generally available proton facilities, or in the
presence of severe logistic limits, photons based IMRT
could be anyway considered as a valid approach.
The stability or sensitivity of different TPS against varia-
tions in the planning objectives was not considered as part
of the study because considered as beyond the purposes of
the study and would deserve a dedicated study, regardless
from paediatric indications. Furthermore, it would be
extremely complicate to perform correctly a similar study
since we used, to define the study strategies, "clinical"
planning objective rather the specific dose-constraints
which are depending from the individual TPS and their
optimisation methods. The translation of fluctuations in
clinical objectives into fluctuations of TPS-depending
constraints would be affected by intrinsic uncertainties
probably masking the sensitivity effects to investigate.
The accuracy of the dose calculations (against measure-
ments) was not considered in the study, because it is seen
as part of a proper commissioning of IMRT and was
already partially discussed in [20]. Notice that the differ-
ent dose calculation algorithms used can be divided into
two groups: the PB related algorithms, and the 'advanced'
ones like CC, AAA and MC, where the lateral electron
transport is taken into account, giving more reliable
results in heterogeneous media (especially in low density
tissues) and possibly in HTis. In this way the study incor-
porated in an indirect way the impact of dose calculation
algorithms on IMRT planning comparisons. In general,
we consider appropriate to evaluate globally the perform-
ances of different TPS without explicitly correcting for
(known) limitations in dose calculation engines since in
this way it is possible to reproduce more precisely poten-
tial clinical conditions. In addition to this, it would be
substantially impossible to disentangle the optimisation
phase from the dose calculation engines. An ideal proce-
dure would consist of comparing TPS limiting to the opti-
misation phase and performing the final dose calculations
using only one (e.g. MC) reliable engine. In fact, for most
of the TPS this is impossible because, if the optimisation
is performed using pencil beam algorithms (eventually
simplified for speed reasons), the multileaf segmentation
engines quite often include some consideration of the
head scattered radiation from the linac head and this is
intimately connected with the final dose calculation
engines. Therefore no true factorisation process is possible
to limit a comparison of performances to the optimisa-
tion phase. On the other side, the impact of dose calcula-
tion algorithms in some range of clinical conditions is
object of independent evaluations in more standard con-
ditions (e.g. Knöös [24]) and results can be likely general-
ised to IMRT.
The issue of MU was here addressed simply analysing the
MU/Gy for all TPSs, even if no effort was put in the appli-
cation of models to estimate secondary cancer induction
from the observed 3D dose distributions. This is an
important aspect of paediatric radiation oncology, and
detailed descriptions of linac head, shielding, beam spec-
tra, neutron and electron contamination should be mod-
elled in the dose calculation algorithms. This was felt to be
beyond this study; meanwhile it should be considered a
mandatory code of good practice to maximise the efforts
to keep the delivered MU to young patients as low as pos-
sible to minimise the risk of inducing secondary malig-
nancies. The average value of MU/Gy observed in the
present study is not significantly different from what
reported in the breast study for the same systems in both
relative and absolute terms proving a good stability of sys-
tems and their performance independence from the chal-
lenge to solve. In this respect, the plans analysed in the
present paper show that IMRT may be efficiently used in
paediatric patients increasing to a certain extent the risk of
second cancer (about doubled with respect to 3DCRT
[19]). It is however well known that the number of fields,
the modulation degree, the number of IL and segments
may influence the MU/Gy delivered with IMRT plans.
Conclusion
Eight TPS were compared to assess the capability to plan
IMRT in different paediatric patients. All the TPS allowed
the design of plans mostly respecting initial objectives
even if with a range of differences. Emphasis should be
made of the importance of avoiding hot spots outside tar-
gets and in the maximal reduction of HTis involvement.
This normal tissue and OAR sparing leads inevitably to
more heterogeneity in the target dose distribution. Some
systems provided better capabilities (as measured by the
scoring indexes), within the limits of user preferences,
than others but performance should be evaluated case by
case according to clinical requirements and strategies. The
key message concerning the possibility to consider IMRT
for paediatric treatments is that all systems proved to offer
sufficient performances from the technical point of view.
Concerns remain about the relevance of large dose baths,
not avoidable with IMRT in this class of patients.
Radiation Oncology 2007, 2:7 />Page 20 of 21
(page number not for citation purposes)
Competing interests
No special competing interest exists for any authors.
Dr. Mats Asell is employed by Nucletron AB and is in the
development group of Oncentra Masterplan one of the
systems used in the study.
Dr. Malin Larsson is employed by RaySearch Laboratories
(Stockholm, Uppsala) and is in the development group of
the optimisation algorithms implemented in both Philips
Pinnacle and Nucletron Oncentra Masterplan used in the
study.
Authors' contributions
AF and LC designed the study.
AF, GN, FL, MA and BD defined planning protocols and
operative procedures.
RW defined volumes of interest.
MA performed planning on Masterplan.
ML performed planning on Pinnacle.
AF and GN performed planning on Eclipse.
JM and MA performed planning on Hyperion.
BD, FL and FL performed planning on Konrad.
MP and FL performed planning on PrecisePlan.
BD, DW and FL performed planning on Corvus.
AC, EV, AF and GN coordinated and carried out data col-
lection, program development and statistical analysis
LC wrote the manuscript.
All authors contributed read and approved the final man-
uscript.
References
1. Taylor R: Cancer in childern: radiotherapeutic approaches. Br
Med Bull 1996, 52:873-886.
2. Claus F, Duthoy W, Boterberg T, De Gersem W, Huys J, Vermeersch
H, De Neve W: Intensity modulated radiation therapy for
oropharyngeal and oral cavity tumors: clinical use and expe-
rience. Oral Oncol 2002, 38(6):597-604.
3. Cozzi L, Fogliata A, Nicolini G, Bernier J: Clinical experience in
breast irradiation with intensity modulated photon beams.
Acta Oncol 2005, 44:467-74.
4. Freedman GM, Anderson PR, Li J, eisenberg DF, Hanlon AL, Wang L,
Nicolaou N: Intensity modulated radiation therapy (IMRT)
decreases acute skin toxicity for women receiving radiation
for breast cancer. Am J Clin Oncol 2006, 29(1):66-70.
5. Parliament MB, Scrimger RA, Anderson SG, Kurien EC, Thompson
HK, Field GC, Hanson J: Preservation of oral health-related
quality of life and salivary flow rates after inverse-planned
intensity- modulated radiotherapy (IMRT) for head-and-
neck cancer. Int J Radiat Oncol Biol Phys 2004, 58(3):663-673.
6. Studer G, Huguenin P, Davis J, Kunz G, Lutolf U, Glanzmann C: IMRT
using simultaneously integrated boost (SIB) in head and
neck cancer patients. Radiat Oncol 2006, 31(1):7.
7. Zelefsky MJ, Fuks Z, Hunt M, Yamada Y, Marion C, Ling CC, Amols
H, Venkatraman ES, Leibel SA: High-dose intensity modulated
radiation therapy for prostate cancer: early toxicity and bio-
chemical outcome in 772 patients. Int J Radiat Oncol Biol Phys
2002, 53(5):1111-1116.
8. Huang E, Teh BS, Strother DR, Davis QG, Chiu JK, Lu HH, Carpenter
LS, Mai WY, Chintaqumpala MM, South M, Grant WH, Butler EB,
Woo SY: Intensity-modulated radiation therapy for pediatric
medulloblastoma: early report on the reduction of ototoxic-
ity. Int J Radiat Oncol Biol Phys 2002, 52(3):599-605.
9. Paulino AC, Skwarchuk M: Intensity-modulated radiation ther-
apy in the treatment of children. Med Dosim 2002,
27(2):115-120.
10. Penagaricano JA, Papanikolaou N, Yan Y, Ratanatharathorn V: Appli-
cation of intensity-modulated radiation therapy for pediatric
malignancies. Med Dosim 2004, 29(4):247-253.
11. Teh BS, Mai WY, Grant WH 3rd: Intensity modulated radiother-
apy (IMRT) decreases treatment-related morbidity and
potentially enhances tumor control. Cancer Invest 2002,
20(4):437-451.
12. Rembielak A, Woo TC: Intensity-modulated radiation therapy
for the treatment of pediatric cancer patients. Nat Clin Pract
Oncol 2005, 2(4):211-217.
13. Krasin MJ, Crawford BT, Zhu Y, Evans ES, Sontag MR, Kun LE, Mer-
chant TE: Intensity-modulated radiation therapy for children
with intraocular retinoblastoma: potential sparing of the
bony orbit. Clin Oncol 2004, 16(3):215-222.
14. Kuppersmith RB, Teh BS, Donovan DT, Mai WY, Chiu JK, Woo SY,
Butler EB: The use of intensity modulated radiotherapy for
the treatment of extensive and recurrent juvenile angiofi-
broma. Int J Pediatr Otorhinolaryngol 2000, 52(3):261-268.
15. Swift P: Novel techniques in the delivery of radiation in pedi-
atric oncology. Pediatr Clin North Am 2002, 49(5):1107-1129.
16. Followill D, Geis P, Boyer A: Estimates of whole-body dose que-
ivalent produced by beam intensity modulated conformal
therapy. Int J Radiat Oncol Biol Phys 1997, 38(3):667-672.
17. Koshy M, Paulino AC, Mai WY, Teh BS: Radiation-induced oste-
osarcomas in the pediatric population. Int J Radiat Oncol Biol Phys
2005, 63(4):1169-2005.
18. Hall EJ, Wuu CS: Radiation-induced second cancer: the impact
of 3D-CRT and IMRT. Int J Radiat Oncol Biol Phys 2003, 56:83-88.
19. Hall EJ: Intensity-modulated radiation therapy, protons, and
the risk of second cancers. Int J Radiat Oncol Biol Phys 2006,
65(1):1-7.
20. Fogliata A, Nicolini G, Alber M, Asell M, Dobler B, El-Haddad M, Har-
demark B, Jelen U, Kania A, Larsson M, Lohr F, Munger T, Negri E,
Rodrigues C, Cozzi L: IMRT for breast. A planning study. Radi-
other Oncol 2005,
76:300-10.
21. AA VV: Late Effects of Treatment for Childhood Cancer
(PDQ). Healthy Professional Version. U.S. National Cancer Insti-
tute, Physician Data Query Database [
].
22. Schwartz CL, Hobbie WL, Constine LS, Truesdell S, Constine LC,
Clark EB: Survivors of Childhood Cancer: Assessment and Management
Mosby, St. Louis; 1994.
23. Timmermann B, Schuck A, Niggli F, Weiss M, Lomax A, Pedroni E,
Coray A, Jermann M, Rutz HP, Goitein G: Spot-scanning proton
therapy for malignant soft tissue tumors in childhood: First
experiences at the Paul Scherrer Institute. Int J Radiat Oncol Biol
Phys 2007, 67(2):497-504.
24. Knöös T, Wieslander E, Cozzi L, Albers D, Brink C, Nyström H,
Fogliata A, Lassen S: Qualitative Comparison of Dose Calcula-
tion Algorithms for Treatment Planning in External Photon
Beam Therapy. Phys Med Biol 2006, 51:5785-5807.
25. Nizin P, Kania A, Ayyangar K: Basic concepts of Corvus dose
model. Med Dosim 2001, 26:65-69.
26. Chui C, LoSasso T, Spirou S: Dose calculation for photon beams
with intensity modulation generated by dynamic jaw or mul-
tileaf collimations. Med Phys 1994, 21:1237-1244.
27. Convery D, Rosenbloom M: The generation of intensity-modu-
lated fields for conformal radiotherapy by dynamic multileaf
collimation. Phys Med Biol 1992, 37:1359-1374.
Publish with BioMed Central and every
scientist can read your work free of charge
"BioMed Central will be the most significant development for
disseminating the results of biomedical research in our lifetime."
Sir Paul Nurse, Cancer Research UK
Your research papers will be:
available free of charge to the entire biomedical community
peer reviewed and published immediately upon acceptance
cited in PubMed and archived on PubMed Central
yours — you keep the copyright
Submit your manuscript here:
/>BioMedcentral
Radiation Oncology 2007, 2:7 />Page 21 of 21
(page number not for citation purposes)
28. Spirou SV, Chi CS: A gradient inverse planning algorithm with
dose-volume constraints. Med Phys 1998, 25:321-333.
29. Spirou S, Chui C: Generation of arbitrary intensity profiles by
dynamic jaws or multileaf collimators. Med Phys 1994,
21:1031-1041.
30. Ulmer W, Harder D: A triple gaussian pencil beam model for
photon beam treatment planning. Z Med Phys 1995, 5:25-30.
31. Ulmer W, Harder D: Applications of a triple gaussian pencil
beam model for photon beam treatment planning. Z Med
Phys 1996, 6:68-74.
32. Ulmer W, Kaissl W: The inverse problem of a gaussian convo-
lution and its application to the finite size of the measure-
ment chambers/detectors in photon and proton dosimetry.
Phys Med Biol 2003, 48:707-727.
33. Alber M, Nüsslin F: An objective function for radiation treat-
ment optimization based on local biological measures. Phys
Med Biol 1999, 44:479-493.
34. Alber M, Nüsslin F: Optimization of intensity modulated radio-
therapy under constraints for static and dynamic MLC deliv-
ery. Phys Med Biol 2001, 46:3229-3239.
35. Bär W, Alber M, Nüsslin F: A variable fluence step clustering
and segmentation algorithm for step and shoot IMRT. Phys
Med Biol 2001, 46:1997-2007.
36. Bär W, Schwarz M, Alber M, Bos LJ, Mijnheer BJ, Rasch C, Schneider
C, Nusslin F, Damen EM: A comparison of forward and inverse
treatment planning for intensity-modulated radiotherapy of
head and neck cancer. Radiother Oncol 2003, 69:251-258.
37. Bortfeld T, Schlegel W, Rhein B: Decomposition of pencil beam
kernels for fast calculations in three-dimensional treatment
planning. Med Phys 1993, 20:311-318.
38. Bortfeld T, Bürkelbach J, Schlegel W: Three-dimensional solution
of the inverse problem in conformation therapy. In Advanced
Radiation Therapy Tumor Response Monitoring and Treatment Planning
Edited by: Breit. Springer Verlag, Berlin; 1992:503-508.
39. Gustafsson A, Lind BK, Brahme A: A generalized pencil beam
algorithm for optimization of radiation therapy. Med Phys
1994, 21:343-356.
40. Gustafsson A, Lind BK, Svesson R, Brahme A: Simultaneous opti-
mization of dynamic multileaf collimation and scanning pat-
terns or compensating filters using a generalized pencil
beam algorithm. Med Phys 1995, 22:1141-1156.
41. Loef J, Rehbinder H, Mc Nutt T, Johnson S: P3IMRT: Inverse plan-
ning optimisation. Pinnacle White Paper Nr. 4535 983 02479, Philips
2003.
42. McNutt T: Dose calculations: collapsed cone convolution
superposition and delta pixel beam. Pinnacle White Paper Nr.
4535 983 02474 Philips 2002.
43. Thieke C, Bortfeld T, Niemierko A, Nill S: From physical dose
constraints to equivalent uniform dose constraints in inverse
radiotherapy planning. Med Phys 2003, 30:2332-2339.
44. Wu Q, Mohan R, Niemierko A, Schmidt-Ullrich R: Optimisation of
intensity modulated radiotherapy plans based on the equiv-
alent uniform dose. Int J Radiat Oncol Biol Phys 2002, 52:224-235.
45. Hårdemark B, Liander A, Rehbinder H, Loef J: P3IMRT. Direct
machine parameter optimisation. Pinnacle White Paper Nr. 4535
983 02483, Philips 2004.
46. Hårdemark B, Liander A, Rehbinder H, Loef J, Robinson D: P3IMRT.
Biological optimisation and EUD. Pinnacle white Paper Nr. 4535
983 02482, Philips 2004.
47. Xiao Y, Galvin J, Hossain M, Valicenti R: An optimized forward-
planning technique for intensity modulated radiation ther-
apy. Med. Phys 2000, 27:2093-2099.