Báo cáo khoa học: " Phantom investigation of 3D motion-dependent volume aliasing during CT simulation for radiation therapy planning" potx
Bạn đang xem bản rút gọn của tài liệu. Xem và tải ngay bản đầy đủ của tài liệu tại đây (1019.81 KB, 15 trang )
Radiation Oncology
BioMed Central
Open Access
Research
Phantom investigation of 3D motion-dependent volume aliasing
during CT simulation for radiation therapy planning
James A Tanyi*1, Martin Fuss2,3, Vladimir Varchena4, Jack L Lancaster5 and
Bill J Salter6
Address: 1Department of Radiation Oncology, University of Arizona Health Science Center, Tucson, AZ 85724, USA, 2Department of Radiation
Oncology and Radiation Medicine, Oregon Health and Science University, Portland, OR 97239, USA, 3Department of Radiation Oncology,
University of Texas Health Science Center at San Antonio, San Antonio, TX 78229, USA, 4Computerized Imaging Reference Systems (CIRS),
Incorporated, Norfolk, VA 23513, USA, 5Research Imaging Center, University of Texas Health Science Center at San Antonio, San Antonio, TX
78284, USA and 6Department of Radiation Oncology, University of Utah/Huntsman Cancer Institute, Salt Lake City, UT 84112, USA
Email: James A Tanyi* - ; Martin Fuss - ; Vladimir Varchena - ;
Jack L Lancaster - ; Bill J Salter -
* Corresponding author
Published: 24 February 2007
Radiation Oncology 2007, 2:10
doi:10.1186/1748-717X-2-10
Received: 11 December 2006
Accepted: 24 February 2007
This article is available from: />© 2007 Tanyi et al; licensee BioMed Central Ltd.
This is an Open Access article distributed under the terms of the Creative Commons Attribution License ( />which permits unrestricted use, distribution, and reproduction in any medium, provided the original work is properly cited.
Abstract
Purpose: To quantify volumetric and positional aliasing during non-gated fast- and slow-scan
acquisition CT in the presence of 3D target motion.
Methods: Single-slice fast, single-slice slow, and multi-slice fast scan helical CTs were acquired of
dynamic spherical targets (1 and 3.15 cm in diameter), embedded in an anthropomorphic phantom.
3D target motions typical of clinically observed tumor motion parameters were investigated.
Motion excursions included ± 5, ± 10, and ± 15 mm displacements in the S-I direction synchronized
with constant displacements of ± 5 and ± 2 mm in the A-P and lateral directions, respectively. For
each target, scan technique, and motion excursion, eight different initial motion-to-scan phase
relationships were investigated.
Results: An anticipated general trend of target volume overestimation was observed. The mean
percentage overestimation of the true physical target volume typically increased with target motion
amplitude and decreasing target diameter. Slow-scan percentage overestimations were larger, and
better approximated the time-averaged motion envelope, as opposed to fast-scans. Motion induced
centroid misrepresentation was greater in the S-I direction for fast-scan techniques, and transaxial
direction for the slow-scan technique. Overestimation is fairly uniform for slice widths < 5 mm,
beyond which there is gross overestimation.
Conclusion: Non-gated CT imaging of targets describing clinically relevant, 3D motion results in
aliased overestimation of the target volume and misrepresentation of centroid location, with little
or no correlation between the physical target geometry and the CT-generated target geometry.
Slow-scan techniques are a practical method for characterizing time-averaged target position. Fastscan techniques provide a more reliable, albeit still distorted, target margin.
Page 1 of 15
(page number not for citation purposes)
Radiation Oncology 2007, 2:10
Background
Tumor localization for treatment planning in radiation
oncology is commonly performed using computed tomography (CT). Owing to image matrix selection, slice
thickness, and window and level settings, an overestimation of a static target's physical volume may be observed
due to partial volume sampling uncertainty effects [1].
Organ motion, most pronouncedly observed in the thorax
and the abdomen, further challenges CT-based targeting
due to the potential for insufficient temporal sampling of
the moving target. Clinically, these uncertainties can
result in errors in representation of true tumor location,
extent, and associated motion envelope (the three-dimensional-space that is occupied by a target volume due to
respiration and other motion inducing positional variations). Thus, it is critical to understand the potential problems and limitations with CT simulation image
acquisition as they correlate directly with the capability to
accurately deliver a radiation oncology treatment at anatomical sites that are subject to organ motion. It should be
noted that recently, so-called 4D imaging techniques have
become available in radiation oncology, wherein CT scanners capable of multislice acquisition are utilized in cinemode to acquire time-stamped projections which allow
for a binned reconstruction of CT motion data. While the
advent of this exciting new imaging modality holds much
promise, the vast majority of CT simulation studies currently conducted in radiation oncology are still performed
via non-4D, helical scanning techniques. This can be
attributed both to the very recent emergence of the 4D
scanning technique, along with the inherent requirement
that to perform such 4D scans expensive and specialized
equipment must be acquired, not the least of which
would include a multi-slice-capable CT scanner. For this
reason we restrict the scope of the current study to the currently, more commonly employed helical scan technique.
Volume aliasing, understood as a CT misrepresentation of
the true spatial and geometric parameters of well-defined
volumes, has been investigated experimentally and/or
analytically for targets moving freely in a single dimension (longitudinally or transversally) [2,3]. Pertinent
motion/imaging parameters that have been considered
include initial motion phase, motion amplitude, and scan
speed. To supplement current understanding of volume
aliasing, the present study investigates the impact of clinically relevant, three-dimensional (3D) target motion of
well-defined geometric targets using a prototype motion
phantom (now commercially available from CIRS, Computerized Imaging Reference Systems Inc., Norfolk, VA,
USA). The specific aims of this study were to (1) experimentally quantify volume aliasing for known, clinically
relevant, 3D tumor motion amplitudes as a function of CT
image acquisition mode (helical), and CT rotation time,
and (2) to provide a qualitative understanding of 3D
/>
tumor motion effects on the accuracy of tumor localization. The data collected should provide a valuable context
for the evaluation of the potential value of recently emerging 4D scanning techniques.
Materials and methods
Phantom description
A prototype dynamic anthropomorphic thorax phantom
(commercially available from CIRS Inc., Norfolk, VA,
USA) was used in this study. Modifications, relevant to the
conduct of the present study, regarding the original phantom specifications were designed by the investigators and
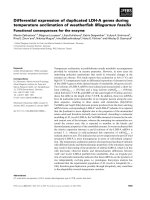
implemented by the phantom vendor. The phantom (figure 1) is a 15 cm thick tissue equivalent thorax section that
represents an average human thorax anatomy in shape,
proportion and composition. The phantom is manufactured from lung, bone, and soft tissue equivalent materials to simulate the heterogeneous environment of the
human thorax. Table 1 is a summary of the physical properties of the equivalent tissue materials constituent of the
phantom. Lung equivalent rod subsections, 40 and 70
mm in diameter, embedded in the lung-equivalent section of the phantom, are used to house spherical, soft tissue equivalent, tumor-simulating targets of various sizes.
The phantom sits on an alignment base plate that is connected to a motion actuator box. A motion actuator is
used to induce target motion through the translation and
rotation of the lung equivalent rod. A computer programmed motion control unit and cable assembly is used
to drive the motion actuator. The center of mass, or centroid, of the available targets is positioned at an off central-axis location in the lung equivalent rod, thus
facilitating three dimensional (3D) motion of the target
through simultaneous rotation and translation of the lung
equivalent rod. The target can describe linear motion in
the longitudinal, or superior-inferior (S-I), direction of up
to ± 20 mm, with an accuracy of 0.05 mm about its reference position. Rotational motion about the central axis of
the tumor-adapted rod allows the centroid of the target to
describe an arc ranging from 0° to 180° axially with an
accuracy of 0.2°. The range of motion of the target centroid in the anterior-posterior (A-P) and the right-left (RL) directions can be computed knowing the distance of
the target centroid from the central axis of the tumoradapted rod and the ± angle of rotation of the tumorhousing lung equivalent rod. Linear motion in the S-I
direction can be isolated from rotational motion in the
axial direction in both frequency and amplitude. Linear
and rotational motions can be synchronized to one
another with accuracy better than 20 msec, thus enabling
simple sinusoidal tumor motion in 3D space. Finally,
motion cycles ranging from 4 – 7 seconds, with accuracy
better than 5 msec, can be programmed.
Page 2 of 15
(page number not for citation purposes)
Radiation Oncology 2007, 2:10
/>
Dynamic thorax phantom designed for studies of the effect of motion on localization and characterization of moving targets
Figure 1
during pretreatment CT
Dynamic thorax phantom designed for studies of the effect of motion on localization and characterization of moving targets
during pretreatment CT. Images A and B are axial and sagittal drawings of the tissue equivalent thorax section depicted in C.
Image B is a cut through the lung equivalent target adapted rod. A computer-controlled actuator applies complex three-dimensional motions to the target within the phantom body through the lung equivalent target adapted rod. S-I motion can be isolated from, or synchronized with, R-L and A-P motion in both frequency and amplitude, enabling sinusoidal and/or other
complex motions to be achieved with sub-millimeter accuracy and reproducibility.
Target and motion parameters
Two spherical targets; 10 and 31.5 mm in diameter, were
used in this investigation. The 10 mm (or small) target
was embedded in the 40 mm diameter lung equivalent
rod and the 31.5 mm (or large) target in the 70 mm rod.
Clinically realistic patient breathing cycles, which may
have complex patterns and non-constant amplitude and
periodicity [4], were approximated by the 3D sinusoidal
Table 1: Physical quantities pertaining to phantom composition.
Phantom Material
Lung
Bone
Plastic Waterđ-Diagnostic/Therapy Range
Soft Tissue Target
Density
(g/cm3)
Electron Density
(ì 1023 cm-3)
Relative Electron Density
ρe
0.21
1.60
1.04
1.06
0.69
5.03
3.35
3.43
0.207
1.506
1.003
1.028
The last column is a comparison of the relative electron densities of the various tissue equivalent materials.
Page 3 of 15
(page number not for citation purposes)
Radiation Oncology 2007, 2:10
model described above. Both targets were programmed to
execute ± 5 mm, ± 10 mm, and ± 15 mm excursions in the
S-I direction about their corresponding reference positions. In addition to programmed longitudinal motion,
by choosing appropriate simultaneous rotation about the
longitudinal axis (S-I), clinically realistic tumor motions
in both the A-P and L-R directions were also programmed
(± 5 mm and ± 2, respectively, for each of the above S-I
motion amplitudes). The 3D motion amplitudes programmed were selected to reflect clinically relevant tumor
motions commonly observed for pulmonary lesions.
Motion cycle period was set at 4 seconds, consistent with
typical human breathing cycles and previously used values [5]. Data was collected for a target in a static mode
(target stationary) and dynamic mode (target undergoing
three-dimensional motion involving simultaneous S-I, AP, and L-R displacements).
Because CT imaging of dynamic targets is highly motion
phase dependent [2], consistent image-acquisition-tomotion-phase synchronization schemes were used in this
study on all scans involving target motion. Phase was
defined as the angle in sinusoidal motion at which the CT
scanner beam was enabled. Phase synchronization was
achieved by initiating beam-on at the same initial scan
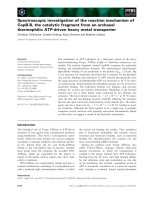
plane and identical motion phase of the target on all studies. Figure 2 is a 2D representation of the target centroid
motion as a function of cycle period. Motion phase π/2
and 3π/2 respectively coincide with the superior- and inferior-most excursions of the target centroid about the reference (0) position.
Imaging modality
A single-slice helical CT scanner (PQ 5000, Philips Medical Systems, Bothell, WA, USA) and a 4-slice multi-slice
helical CT scanner (LightSpeed™ RT, GE Medical Systems,
Milwaukee, WI, USA) were used for image acquisition.
Axial CT imaging is beyond the scope of this work and was
not investigated. All CT scans were acquired along the
couch axis in the superior to inferior direction. Display
field of view was set at 450 mm and a reconstruction
matrix of 512 × 512 was used. Scan parameters used were
typical of thoracic simulation at the Cancer Therapy and
Research Center, San Antonio, TX. These include 1.5
pitch, 120 kVp, 300 mA, and 3 mm slice thickness for the
single-slice technique, and 0.75:1 pitch, 140 kVp, 205 mA
and 2.5 mm slice thickness for the multi-slice technique.
Fast (1 second/rotation) scan speed and a slow (4 second/
rotation) speed scan techniques were used to assess the
effect(s) of imaging speed and motion amplitude on volume aliasing. For each scan speed and target size, the
motion amplitudes specified in Section 2.2 were systematically examined for 8 different initial target motion
phases, each separated by π/4.
/>
Data analysis: target segmentation and aliased data
generation
All studies were transferred electronically to a radiation
treatment planning station (CORVUS version 5.0, North
American Scientific/NOMOS, Cranberry Township, PA)
where treatment planning software inherent tools were
used for target volume delineation and analysis.
Target segmentation was performed on a default window/
level (W = 400 HU and L = -700 HU) in the treatment
planning system, as applicable to thoracic/lung structures.
To eliminate user bias in delineating the target volume, a
software-inherent, semi auto-segmentation technique was
utilized to systematically define the outer boundary of the
target as the most peripheral density voxels which were
readily distinguishable from background. The delineation
process was confirmed to be consistent and reproducible.
The contoured volume for each study involving a moving
target was termed the dynamic gross target volume (dGTV)
to distinguish it from a corresponding static gross target volume (sGTV) generated from a stationary target.
By summing all voxels enclosed within a segmented volume, the volumes of the dGTV and sGTV were computed.
Subsequently, the stereotactic coordinates of the centroid
of both the sGTV and dGTV were automatically computed
by the treatment planning software.
Benchmark volumetric information for aliasing
quantification
1. Volumetric misrepresentation
True physical volumes, or tTVs, of the 10 and 31.5 mm
diameter targets were measured and computed (formula;
see Appendix) and then compared with manufacturer
reported values, with good agreement. These values were
subsequently used to quantify target volume mis-estimation (over/under estimation) in the presence of motion.
The mis-estimation factor was computed as a ratio of the
dGTV to its corresponding known volume (tTV). Mis-estimation factors were not computed for sGTVs (i.e. due to
partial volume effects) as this has been extensively investigated by Winer-Muram and colleagues [1].
Time-averaged motion envelopes were mathematically
computed (formula; see Appendix) for each target for
three known motion amplitudes. The quantitative values
of the motion envelopes (here referred to as tGTV) were
used to analyze the degree to which each dGTV approximated its corresponding motion envelope, reported as the
ratio of a dGTV over its corresponding (true) motion
envelope.
2. Reference centroid misplacement
The location of each delineated structure (sGTV or dGTV)
was defined by its geometric center, or centroid. The refer-
Page 4 of 15
(page number not for citation purposes)
Radiation Oncology 2007, 2:10
/>
smaller target showed a greater percentage overestimation
than the larger one.
Table 3 is a quantitative summary of Fig 3. The key findings were as follows: 1) the mean percentage overestimation of the tTV increased with target motion amplitude
and decreased with increasing target diameter; 2) though
slow scan techniques resulted in greater volume overestimation, slow-scan generated volumes, like fast scan generated ones, were seen to be motion-phase dependent;
and 3) the small-target percentage overestimation was
more susceptible to initial motion phase changes than the
larger target. The mean overestimation for single-slice fast
scan CT technique was as much as 3.38 times (or a 238%
increase) for the small (10 mm diameter) tTV and 1.57
times (or a 57% increase) for the large (31.5 mm diameter) tTV. The mean overestimation for multi-slice fast scan
CT technique was as much as 4.65 times (or a 365%
increase) for the small tTV and 2.08 times (or a 108%
increase) for the large tTV. Finally, the mean overestimation for single-slice slow scan CT technique was as much
as 11.1 times (or a ~1000% increase) for the small tTV and
2.26 times (or a 126% increase) for the large tTV.
Figure
of representation of motion of target centroid as a function
2Dtime 2
2D representation of motion of target centroid as a function
of time. Motion is sinusoidal with period of 4 sec. Motion
amplitude (A) represents the maximum excursion of the target centroid in the S-I direction about a reference position
(0), and takes values ± 5 mm, ± 10 mm, or ± 15 mm. Motion
phases π/2 and 3π/2 respectively coincide with the superiorand inferior-most excursions of the target centroid about the
reference (0) position.
ence centroid position was defined using scan parameters
in Section 2.3, with each target stationary at its reference
position. To quantify the degree of misinterpretation of
the target location as a result of target motion, the 3D displacement vector of the various dGTV centroids were computed.
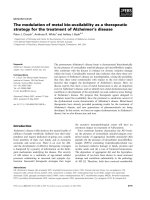
For qualitative appreciation of motion-induced volumetric distortion during CT imaging, frontal views of the
dGTVs for both the small and large targets are presented
in Fig 4. It is apparent that there is little similarity between
the dGTVs and the sGTV (the sGTV being a proxy representation of the true geometry of each corresponding target).
Results
Table 2 summarizes two important parameters for the
small and large targets: 1) true physical volumes, or tTVs
and 2) time-averaged (true) motion envelopes for three
known motion amplitudes, or tGTVs.
True target volume mis-estimation
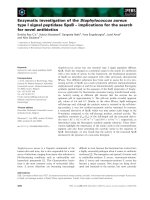
Figure 3 is a graphical representation of the variation of
the target volume mis-estimation (dGTV/corresponding
tTV ratio) as a function of phase and motion amplitude
during single-slice fast scan-, multi-slice fast scan-, and
single-slice slow scan-CT techniques. The plots depict a
general trend of target volume overestimation in the presence of target motion during CT imaging. Overall, the
Reproducibility of time-averaged motion envelope
Table 4 summarizes quantitatively the degree to which
each dGTV approximates its corresponding motion envelope. The key results were as follows: 1) fast scan dGTVs
are generally smaller in magnitude that their corresponding tGTVs, and changing target diameter from 10 mm to
31.5 mm does not result in a significant change in the
dGTV/tGTV ratio. 2) Slow-scan dGTVs may either be
smaller or larger than their corresponding tGTVs, depending on motion amplitude and phase. 3) Changing target
diameter from 10 mm to 31.5 mm did decrease the dGTV/
tGTV ratio, bringing it closer to 1.0.
Table 2: Summary of mathematically computed benchmark quantities.
Target Diameter (mm)
True Physical Volume
(tTV) (cm3)
Motion envelope (tGTV) (cm3) for known motion Amplitude (mm)
± 5 mm
10
31.5
0.52
16.37
± 10 mm
± 15 mm
2.45
34.96
2.88
39.34
3.46
45.20
Page 5 of 15
(page number not for citation purposes)
Radiation Oncology 2007, 2:10
/>
Magnitude of mis-estimation of the true (3) motion amplitudes (tTV) of the 10- and 31.5-mm diameter targets as a function of
Figure
eight (8)3initial motion phases for three physical target volumes
Magnitude of mis-estimation of the true physical target volumes (tTV) of the 10- and 31.5-mm diameter targets as a function of
eight (8) initial motion phases for three (3) motion amplitudes. The mis-estimation magnitude is computed as a ratio of each
CT reconstructed dGTV and its corresponding tTV. Plots A, B, and C correspond to single-slice fast (or 1-sec), multi-slice fast
(or 1-sec), and single-slice slow (or 4-sec) scan imaging techniques, respectively. Each colored line represents a specific motion
amplitude in the S-I direction, synchronized with constant amplitudes of ± 2 and ± 5 mm in the R-L and A-P, respectively.
Phase-synchronization-related centroid misplacement
Figure 5 is an illustration of how much the reference centroid of stationary target (once again, a proxy representation of the true centroid of each corresponding target) is
displaced if imaged while in motion. Table 5 is a quantitative summary of Fig 5. No clear relationship between the
displacement of the reference centroid and initial motion
phase was observed from the analysis. However, the following were key findings: 1) total vector centroid displacements as large as 11 mm, typically in the
longitudinal (S-I) direction, were possible for the fast scan
techniques, 2) centroid misplacement for the slow-scan
technique was greater in the transaxial (AP and L-R) directions with misplacement magnitudes as much as 11 mm,
Page 6 of 15
(page number not for citation purposes)
Radiation Oncology 2007, 2:10
/>
Table 3: Range of volume over/under-estimation as a function of motion amplitude for the three scan modes.
Target Diameter (mm)
S-I Motion Amplitude ± (mm)
Single-slice Fast
Multi-slice Fast
Single-slice Slow
Min
Mean
1σ
Max
Min
Mean
1σ
Max
Min
Mean
1σ
Max
10
5
10
15
0.99
2.35
2.27
2.52
2.68
3.38
1.02
0.21
1.07
3.78
2.92
4.98
1.66
3.07
4.11
2.85
3.61
4.65
0.70
0.37
0.39
3.74
4.2
5.21
3.88
5.71
10.1
4.57
6.84
11.1
0.62
0.99
0.60
5.60
8.42
11.7
31.5
5
10
15
1.22
1.39
1.50
1.35
1.45
1.57
0.08
0.03
0.05
1.44
1.50
1.64
1.54
1.7
2.02
1.56
1.79
2.08
0.03
0.05
0.05
1.62
1.87
2.15
1.52
1.78
2.09
1.60
1.89
2.26
0.06
0.07
0.11
1.67
1.97
2.41
Each target motion in the S-I direction was synchronized with a fixed rotational motion to initiate an R-L and an A-P displacement of ± 2 and ± 5
mm, respectively.
and 3) centroid misrepresentation was greater for the
smaller target.
Discussion
Virtual radiation therapy simulation for lung and abdominal targets typically relies on intermediate-rotationalspeed, helical (or spiral) CT for target volume localization. Most helical CT simulator units, including the ones
used for data acquisition in the present study, are capable
of acquiring images at rotational speeds between 1 and 4
seconds. Slow image acquisition rotation speeds are not
necessarily available for all dedicated devices. The benefit
of increased volume coverage with helical CT comes with
the price tag, in the presence of physiologic motion, of
increased data inconsistency.
Helical CT
During helical CT data acquisition, there exists simultaneous gantry (x-ray tube and detector system) rotation with
continuous table feed. Furthermore, CT projection data
are a measure of the integral absorption along fan beam
lines for all views during (full) gantry rotation. Similar to
axial CT, every subsequent view is acquired at a different
angle. However, in helical CT, the longitudinal position of
a view with respect to the imaged object changes constantly, depending on the preset scan pitch. Under these
circumstances, projections are not collected on a slice-byslice basis. Projections for each corresponding slice are
reconstructed by suitable interpolation between adjacent
projections.
3D target motion
Image reconstruction in helical CT is optimized with the
premise that imaged objects are stationary. However,
tumors are not always stationary, especially those located
in the thorax or abdomen, which typically exhibit periodic 3D motion. In such instances, the targets' cross section and position in the imaging plane varies
continuously as it moves into or out of, as well as within,
the imaging plane. In this study, a spherical target geome-
try was used. The diameter registered by each subsequent
view increases or decreases, depending on the target
motion phase. Thus, as the plane of reconstruction
changes, views from different longitudinal positions in
the target are used for interpolation, hence, influencing
the orientation of the geometry of the reconstructed target.
Motion-induced artifacts
Unlike planar x-ray imaging, where target motion leads to
blurring, or averaging, based on the extent and type of
motion, motion-induced artifacts in CT imaging arise
from the fact that moving objects are at different locations
at different projection angles. During the helical acquisition methodology, the motion induced artifacts are also
influenced by the slice acquisition time, the temporal relationship between data acquisition and target motion
cycle, and the initial angle of the x-ray source. There are
numerous publications in the literature describing techniques to eliminate or, at least, minimize motion-induced
artifacts, but these very interesting works are beyond the
scope of this work. In the present study, true three-dimensional target motion resembling more closely a clinically
observed target motion pattern, albeit an idealized or a
simplified model, was investigated. Despite differences in
study design, the results of the present study can be partially compared with findings in the literature [2,3,6].
Fast (1-s)-scan helical CT
During the fast-scan CT technique for a target moving in/
out and within the imaging plane, a finite but small
number of different phases of target motion are partially
projected within the image plane resulting in misrepresentation of target cross section as is shown in Fig. 6a. It
should be noted that the target cross section is not a disc
with a uniform CT number, as might be expected. Furthermore, the reconstructed intensities from projections from
the S-I poles of the targets are underweighted, whereas
those in the middle are over-weighted. Motion-induced
artifacts occur in small and large targets alike; however,
Page 7 of 15
(page number not for citation purposes)
Radiation Oncology 2007, 2:10
/>
Figure 4 slow-scan distortion of the 10- and 31.5-mm diameter targets as a function of four (4) initial motion phases and three
(3) motion amplitudes
Fast- and
Fast- and slow-scan distortion of the 10- and 31.5-mm diameter targets as a function of four (4) initial motion phases and three
(3) motion amplitudes. The top row of images ("a" and "b") is associated with the 10 mm target, while the bottom row ("c" and
"d") with the 31.5 mm target. The columns of structures labeled "STATIC" are surrogate representations of the respective 10and 31.5-mm diameter targets. Image sets "a" and "c" are reconstructions from single-slice fast techniques, while "b" and "d"
are from single-slice slow scan techniques. The motion amplitudes presented on the figures are for the S-I direction and are
synchronized with constant ± 2 and ± 5 mm displacements in the R-L and A-P directions, respectively.
smaller targets are more susceptible to geometric misses.
When motion amplitude is larger than target diameter,
the probability of a target moving completely out of the
imaging plane, and hence, being "not seen' by a view, is
greater [9]. While there may appear to be a pattern of
some sort in Fig 3, this would not imply that a priori
knowledge of target geometry and of motion and CT
parameters will lead to dGTV prediction.
Recently, a carefully designed experiment- and simulation-based review on motion-induced artifacts as a func-
tion of fast-scan CT acquisition techniques (i.e., short slice
acquisition times relative to motion cycle periods), was
reported by Chen and colleagues [2] from Massachusetts
General Hospital (MGH). The authors concluded that distortions along the axis of motion could result in either a
lengthening or shortening of the target. In addition to
shape distortion, the center of the imaged target can be
displaced by as much as the amplitude of the motion,
similar to findings in the present study (Fig 5). However,
there were some notable differences in their findings and
findings in the current study. While the MGH group
Page 8 of 15
(page number not for citation purposes)
Radiation Oncology 2007, 2:10
/>
Table 4: Ratio of dGTVs and corresponding tGTVs.
Target Diameter (mm)
S-I Motion Amplitude ± (mm)
Single-slice Fast
Multi-slice Fast
Single-slice Slow
Min
Mean
Max
Min
Mean
Max
Min
Mean
Max
10
5
10
15
0.21
0.50
0.51
0.54
0.57
0.76
0.81
0.62
1.07
0.36
0.66
0.88
0.61
0.77
0.99
0.80
0.90
1.11
0.83
1.22
2.17
0.98
1.46
2.38
1.20
1.80
2.50
31.5
5
10
15
0.57
0.65
0.70
0.63
0.68
0.73
0.67
0.70
0.77
0.72
0.80
0.94
0.73
0.84
0.98
0.76
0.88
1.01
0.71
0.83
0.98
0.75
0.88
1.06
0.78
0.93
1.13
Ratio gauges the proximity of the magnitude of a reconstructed dGTV with that of its corresponding time-averaged motion profile (tGTV). Each
target motion in the S-I direction was synchronized with a fixed rotational motion resulting in an R-L and an A-P displacement of ± 2 and ± 5 mm,
respectively.
reported both overestimations and underestimations of
moving target volumes, as did Caldwell and colleagues [3]
and Kini and colleagues [7], only in one instance was a
slight amount of underestimation observed in the present
study. This was an interesting variation in findings, which
may be attributable to several subtle, but important, technical differences in the methods utilized in these related
studies. Studies by both Caldwell and Kini characterized
the ratio of dynamically-imaged-target-volume, referred
to as dGTV in this study, over the target volume derived
from a static image (here referred to as sGTV). This differs
from the ratio reported in our study, namely dGTV/tTV (or
true Target Volume as measured directly from the object).
Given that Weiner-Muram and colleagues [1] have shown
that CT volume averaging effects of imaging static 10- and
31.5-mm diameter objects with a 3 mm CT slice thickness
can result in over-estimation of the true target volumes by
as much as 40% and 12%, respectively, it is not difficult to
understand that the ratio reported by Caldwell and Kini,
with a larger sGTV representation of the true target volume
in the denominator, might be smaller than that observed
in the present study where the true measured target volume was used in the denominator. Regarding the MGH
group findings, it is important to understand that their
work represented a computer simulation study which
characterized the time-varying geometric intersection of a
CT slice dimension with a moving object and, as such, did
not seek to attain Hounsfield number representations of
the resulting image. While valuable in helping to characterize the geometric misrepresentations of shape and position which can result from CT imaging of moving objects,
this study did not attempt to quantify the variation in
dGTV in the same way that this term is defined here.
Reference centroid misplacement as a function of three (3) motion amplitudes and eight (8) initial motion phases for the 10Figure 5
and 31.5-mm diameter targets
Reference centroid misplacement as a function of three (3) motion amplitudes and eight (8) initial motion phases for the 10and 31.5-mm diameter targets. Plots were generated by reconstructing scans from single-slice fast (1-sec), multi-slice fast (1sec), and single-slice slow (4-sec) scan techniques, respectively. The plots in the first, second and third rows represent misplacement of the reference centroid location (0) in the S-I, A-P, and L-R directions, respectively. The blue, pink and teal
colored lines represent motion amplitudes in the S-I direction of ± 5, ± 10, and ± 15 mm, respectively. Each S-I motion is synchronized with an A-P and an L-R motion of ± 2 and ± 5 mm, respectively.
Page 9 of 15
(page number not for citation purposes)
Radiation Oncology 2007, 2:10
/>
Table 5: Range of misrepresentation of the centroid of the 10- and 31.5-mm diameter targets.
Target Diameter (mm)
S-I Motion Amplitude ± (mm)
Centroid mis-placement (mm), single-slice fast scan CT
S-I
A-P
R-L
Mean
95% CI
Mean
95% CI
Mean
95% CI
10
5
10
15
-0.8
-1.1
-0.7
6.2
5.2
7.0
0.2
0.3
0.2
1.0
2.2
1.4
0.6
0.7
1.6
1.2
1.8
3.0
31.5
5
10
15
-2.2
-2.7
-2.5
5.2
4.2
8.8
-0.2
-0.3
-0.5
0.2
1.4
1.0
-0.1
0.4
0.1
0.6
1.6
1.2
Target Diameter (mm)
S-I Motion Amplitude ± (mm)
Centroid mis-placement (mm), multi-slice fast scan CT
S-I
A-P
R-L
Mean
95% CI
Mean
95% CI
Mean
95% CI
10
5
10
15
1.1
0.4
0.4
4.6
3.0
5.4
0.0
0.0
0.1
1.4
1.4
1.6
0.5
0.4
0.2
0.6
1.2
1.0
31.5
5
10
15
0.5
1.2
2.0
3.4
5.4
5.4
0.3
0.1
-0.4
0.8
1.0
0.8
0.7
1.1
0.8
0.8
1.2
1.2
Target Diameter (mm)
S-I Motion Amplitude ± (mm)
Centroid mis-placement (mm), single-slice slow scan CT
S-I
A-P
R-L
Mean
95% CI
Mean
95% CI
Mean
95% CI
10
5
10
15
-0.2
-0.9
-1.3
1.8
2.6
1.4
1.2
3.3
5.9
2.4
1.4
3.6
2.4
4.2
7.1
2.8
1.8
3.6
31.5
5
10
15
-2.2
-1.8
-2.8
3.4
2.6
2.4
0.0
0.0
0.9
1.0
2.4
3.4
1.3
0.8
1.6
3.6
2.2
2.4
From top to bottom, the tables were generated from single-slice fast (or 1-sec), multi-slice fast (or 1-sec), and single-slice slow (or 4-sec) scan
acquisition techniques, respectively. Ranges were computed for three known motion amplitudes.
An additional contributing factor to the lower percentage
of volume under-estimation observed in this study, relative to the Caldwell and colleagues study, is that the Caldwell group stated that the Hounsfield unit threshold used
to define dGTV borders was determined by systematically
matching the geometry of the sGTV with its physical values while at the same time excluding in-air CT image artifacts. This would likely have required an increasing of the
window level settings, which would have subsequently
reduced the volume of visible dGTV, relative to our
method, which did not force such agreement between the
sGTV and tTV. Such an approach would have further con-
tributed to the noted differences between this study and
the Caldwell and colleagues study.
A final, and likely, contributing factor to the differences in
volume underestimation observed by our study, relative
to the previously mentioned studies, would be the presence in our study of 3D target motion. The addition of
volume aliasing effects in the axial plane, second to target
motion in this plane, would certainly contribute to a
growth in the dGTV volumes that we measured. In light of
the fact that the previously mentioned studies utilized linear motion, absent of axial-plane translations, it is under-
Page 10 of 15
(page number not for citation purposes)
Radiation Oncology 2007, 2:10
/>
a
b
Figure 6
Sequential axial slices for the 31.5-mm diameter target
Sequential axial slices for the 31.5-mm diameter target. Images were reconstructed from a fast-scan (a) and slow-scan (b) of the
target to illustrate the effect of motion on data projection.
standable that this increase in value of the dGTV
(numerator) value of the reported ratio would lead to a
further reduction of volume underestimation observed by
our study.
While the 3D sinusoidal model used here to approximate
a complex human respiratory cycle is clearly a simplification, it is still (arguably) a reasonable experimental compromise in the representation of the magnitude of tumor
Figure 7
Four CTs of the phantom with the embedded 10 mm diameter spherical target
Four CTs of the phantom with the embedded 10 mm diameter spherical target. Each image in the series represents a 3-mm
transaxial reconstruction of helically acquired CT data. The first series (STATIC TARGET) depicts image acquisition with the
target stationary, and serves as a reference and a surrogate of the true axial geometry of the imaged target. The second series
depicts the same target scanned with a slice acquisition time of 1 s and moving in 3D. The third and fourth series illustrate the
effect of changing slice acquisition time from 1 s to 4 seconds (acquisitions in series 3) and also changing the initial motion-toscan phase relationships from 0 to π(acquisitions in series 4).
Page 11 of 15
(page number not for citation purposes)
Radiation Oncology 2007, 2:10
/>
Figure 8
Four CT studies of the phantom with the embedded 3.15 cm diameter spherical target
Four CT studies of the phantom with the embedded 3.15 cm diameter spherical target. Each image in the series represents a 3mm transaxial reconstruction of helically acquired CT data. The first series (STATIC TARGET) depicts image acquisition with
the target stationary, and serves as a reference and a surrogate of the true axial geometry of the imaged target. The second
series depicts the same target scanned with a 1-s slice acquisition time and moving in 3D. The third and fourth series illustrate
the effect of changing slice acquisition time from 1 s to 4 seconds (acquisitions in series 3) and also changing the initial motionto-scan phase relationships from 0 to π(acquisitions in series 4).
aliasing errors introduced when imaging moving targets.
The failure of the phantom to accurately model the natural and characteristic pause at the end of the normal
human exhale cycle may well result in somewhat of an
overestimation of the target volume aliasing, relative to a
true human breathing cycle, since the phantom target will
not pause and, thus, not afford the scanner the opportunity to capture at least part of its image in a relatively
motionless state. In contrast however, the simplified sinusoidal model will likely underestimate the potential to misrepresent the centroid location of the moving target,
relative to a true human breathing cycle, due to its failure
to model the very same pause at the end of the exhale
cycle, which subsequently affords the scanner the
increased probability of capturing an image of a real,
human tumor at a point located at its maximum distance
from the central position.
Slow (4-s)-scan helical CT
Wurstbauer and colleagues [6] recently showed that slowscan acquisition CTs result in larger, but highly constant
depictions of lung tumors in comparison to fast-scan techniques, yielding an integral delineation of almost all positions of the moving tumors. The authors concluded that
the use of slow planning CTs enables the drawing of
tighter margins in external beam treatment planning of
lung cancer. Theoretically, slow-scan techniques with slice
acquisition times equal to or greater than the period of
target motion should detect the range of tumor motion
and shape throughout the normal motion cycle. However,
as shown in Fig 4, aliasing errors still exist in the reconstructed projection data. While slow-scan techniques gen-
erate target volumes larger than fast-scan target volumes,
and while slow-scan generated images appear to be more
reproducible and seem to approximate the time-average
motion profile [10,11], this was shown true only from
analytical/simulation studies. Findings in this study
showed a perceptible dependence of reconstructed volume on the temporal relationship between initial target
motion-phase and initial angle of x-ray source, as illustrated in as well as Fig 7 and 8 (acquisitions in series 3 and
4) for two different initial motion phases. Once again, as
the plane of reconstruction changes, different views are
used for helical interpolation. The direction of these views
thus determines the orientation of the reconstructed target
geometry.
Unlike the fast-scan reconstructed images where target-tonormal-tissue interfaces may be more discernible, images
from the slow-scan technique demonstrate shading artifacts (Fig 6b and 7). While a finite, but small, number of
different phases of target motion are partially projected
within the image plane during the fast scan technique, a
finite, but large, number are projected during the slow
scan technique. Thus, many more completely different
longitudinal positions of the moving target are used for
projection reconstruction during slow scanning; hence,
inconsistencies in the views result in significant shading
artifacts.
Finally, while significant deviations were observed in S-I
centroids of dGTVs of the fast-scan acquisitions, such
deviation were observed in the transaxial (A-P and R-L)
directions for the slow-scan technique (Fig 5). This is due,
Page 12 of 15
(page number not for citation purposes)
Radiation Oncology 2007, 2:10
/>
Ratio [dGTV/tTV]
3.0
2.5
1s
1.5 s
2s
3s
4s
2.0
1.5
1.0
1.5
2
3
4
5
Slice Width (mm)
8
10
Figure 9 of mis-estimation of the true physical volumes (tTV) of the 31.5-mm diameter target as a function of slice width for
five (5) different CT slice acquisition times
Magnitude
Magnitude of mis-estimation of the true physical volumes (tTV) of the 31.5-mm diameter target as a function of slice width for
five (5) different CT slice acquisition times. The mis-estimation magnitude is computed as a ratio of each CT reconstructed
dGTV and its corresponding tTV. Geometric variation is illustrated for the reference initial motion-to-scan phase relationship
only.
in part, to the significant influence of longitudinal motion
on fast-scan acquisitions, and both longitudinal and
transversal motion on slow-scan acquisitions, when the
target is being frozen in time. In theory, it is more likely
for the centroid of a slow-scan dGTV to coincide with its
corresponding reference centroid. However, this is rarely
the case in reality due to the complexity of the data acquisition process.
A note on slice thickness
Despite the fact that the slice widths used in the present
study (2.5 and 3 mm for the single-slice and multi-slice
techniques, respectively) are not fully-encompassing of
Table 6: Relevant parameters used to determine benchmark
volumes tTV and tGTV.
Target Diameter
(mm)
a
(radians/sec)
b
(mm)
t
(s)
h
(mm)
10
31.5
π/4
39.4π/180
10, 20, 30
10, 20, 30
0 to 2
0 to 2
14.25
15.75
existing clinical practices, it is worth noting that increasing
slice thickness not only changes the reconstructed dGTV,
but can potentially increase it (Fig 9). This is attributable,
in part, to increasing partial volume averaging in the longitudinal direction, similar to findings by Winer-Muram
and colleagues [1] on static targets.
Conclusions and clinical implications
Accurate appreciation and delineation of target volume in
radiation oncology is not only crucial for designing an
appropriate and clinically effective treatment plan, but
also necessary for accurate dose calculation. Understanding and fully characterizing potential errors caused by target motion is a complex subject that will require future
characterization. Phantom studies such as the present
study using a dynamic anthropomorphic thorax phantom
provide an approximation of the impact of 3D target
motion as a function of specific scan parameters chosen
for pre-treatment planning CT data acquisition. The
present data support one key conclusion during nongated CT acquisitions: when using a single-slice spiral CT,
slow scanning image acquisition appears to be the most
practical method of acquiring data that may (more) relia-
Page 13 of 15
(page number not for citation purposes)
Radiation Oncology 2007, 2:10
bly characterize the time-average position and shape of a
moving target. Fast scanning on such scanners, as well as
on a 4-slice multi-slice scanner, on the other hand, provides for more reliably definition of the boundary
between target and normal tissue. Or, stated conversely,
non-gated spiral CT imaging of dynamic targets, can lead
not only to distortions of target shape and misplacement
of target centroid, but also to complete loss of volumetric
information, as well as information about the motion of
the target. The impact of image misrepresentation and
loss of viable target information introduces a systematic
error in designed treatment plan, and hence, a potential
source of dose misrepresentation. While the present study
did not take into account target deformation, which
would have further complicated interpretation of result in
this study, it is clear that utilization of population-based
planning target volumes might not serve all patients well
in that, even for patients with identical breathing patterns,
there are still significant individual variations in the extent
of deformation of dGTV as a result of variable motion
phase. In any case, a failure in accurate localization and
characterization of target geometry during free breathing,
non-gated CT imaging imposes a limitation on the therapeutic gains of conformally implemented RT techniques.
/>
lar rotation speed (radians/sec) of the target centroid
around the central axis of the target adapted rod, b is the
S-I amplitude, and (b/2) defines the speed of target
motion, and t is a time function. Let L be the arc length of
the path described by the centroid of the target. Relevant
parameters used to determine benchmark volumes are
summarized in Table 6.
t
L=
∫
0
d ( s(t ) )
dt
2
L=
∫
0
2
L=
∫
0
Competing interests
V. Varchena is an employee of CIRS Inc., which has commercialized the dynamic anthropomorphic thorax phantom.
Authors' contributions
JAT participated in the conception and design of the
study, carried out the data acquisition, performed data
analysis, evaluated the results and drafted the manuscript.
MF participated in the design of the study and revised the
manuscript. VV participated in the design of the study,
performed modifications of the phantom relevant to the
conduct of the study, and revised the manuscript. JLL participated in the design of the study and revised the manuscript. BJS participated in the conception and design of the
study, interpretation of data and drafting of the manuscript. All authors read and approved the final manuscript.
2
2
2
⎛ dx ⎞
⎛ dy ⎞
⎛ dz ⎞
⎜
⎟ +⎜
⎟ +⎜
⎟ dt ’
⎝ dt ⎠
⎝ dt ⎠
⎝ dt ⎠
b⎤
⎡
= ⎢ −ah sin(at ), ah cos(at ), ⎥
2⎦
⎣
2
⎛b⎞
(−ah sin(at ))2 + (ah cos(at ))2 + ⎜ ⎟ dt ’
⎝2⎠
(
)
2
⎛b⎞
(ah)2 sin2 (at ) + cos2 (at ) + ⎜ ⎟ dt ’
⎝2⎠
sin2(at)+cos2(at) = 1
2
L=
∫
0
2
⎛b⎞
(ah)2 + ⎜ ⎟ dt ’
⎝2⎠
2
⎛b⎞
L = 2 (ah)2 + ⎜ ⎟
⎝2⎠
The time-averaged volume traced by the target can be
computed using
V =π (r N
)2 L + 4 π r 3
3
where r is the radius of the target, ||N|| is a unit normal
vector defining the perpendicularity of the radius of the
equatorial slice to its path.
Appendix
The path described by the centroid of the equatorial slice
of the target about the central axis of the target-adapted
rod can be modeled by the parametric equation (with rectangular coordinates) s [x(t), y(t), z(t)] where
b ⎤
⎡
s(t ) = ⎢ h cos(at ), h sin(at), t ⎥
2 ⎦
⎣
where h is the distance from the centroid of the target to
the axis of rotation of the target adapted rod, a is the angu-
2
4
⎛b⎞
V = 2π r 2 (ah)2 + ⎜ ⎟ + π r 3
2⎠
3
⎝
Acknowledgements
The authors wish to thank Drs. Charles R. Thomas Jr., Melissa M. Blough,
and David L. Goff for their thoughtful critical review and comments on this
manuscript. The authors also wish to thank Matt Bardwell and Dr. Allen
Holder of Trinity University in San Antonio for their mathematical contributions.
Page 14 of 15
(page number not for citation purposes)
Radiation Oncology 2007, 2:10
/>
References
1.
2.
3.
4.
5.
6.
7.
8.
9.
10.
11.
Winer-Muram HT, Jennings SG, Meyer CA, Liang Y, Aisen A, Tarver
RD, McGarry RC: Effect of varying CT section with on volumetric measurement of lung tumors and application of compensatory equations. Radiology 2003, 229:184-194.
Chen GTY, Kung JH, Beaudette KP: Artifacts in computed tomography scanning of moving objects. Semin Radiat Oncol 2004,
14:19-26.
Caldwell CB, Mah K, Skinner M, Danjoux CE: Can PET provide the
3D extent of tumor motion for individualized internal target
volumes? A phantom study of the limitations of CT and the
promises of PET. Int J Radiat Oncol Biol Phys 2003, 55:1381-1393.
Ozhasoglu C, Murphy MJ: Issues in respiratory motion compensation during external-beam radiotherapy. Int J Radiat Oncol
Biol Phys 2002, 52:1389-1399.
Langen KM, Jones DJ: Organ motion and its management. Int J
Radiat Oncol Biol Phys 2001, 50:265-278.
Wurstbauer K, Deutschmann H, Kopp P, Sedlmayer F: Radiotherapy planning for lung cancer: slow CTs allow the drawing of
tighter margins. Radiother Oncol 2005, 75:165-170.
Kini VR, Keall PJ, Vedam SS, Arthur DW, Kavanagh BD, Cardinale RM,
Mohan R: Preliminary results from a study of a respiratory
motion tracking system: Underestimation of target volume
with conventional CT simulation. Int J Radiat Oncol Biol Phys
2000:164.
Van Hoe L, Haven F, Bellon E, Baert AL, Bosmans H, Feron M, Suetens
P, Marchal G: Factors Influencing the Accuracy of Volume
Measurements in Spiral CT: A Phantom Study. J Comput Assist
Tomogr 1997, 21:332-338.
Wilting JE, Timmer J: Artefacts in spiral-CT images and their
relation to pitch and subject morphology. Eur Radiology 1999,
9:316-322.
Lagerwaard FJ, Van Sörnsen de Koste JR, Nijssen-Visser MRJ, Schuchhard-Schipper RH, Oei SS, Munne A, Senan S: Multiple "slow" CT
scans for incorporating lung tumor mobility in radiotherapy
planning. Int J Radiat Oncol Biol Phys 2001, 51:932-937.
van Sörnsen de Koste JR, Lagerwaard FJ, de Boer HCJ, Nijssen-Visser
MR, Senan S: Are multiple CT scans required for planning curative radiotherapy in lung tumors of the lower lobe? Int J
Radiat Oncol Biol Phys 2003, 55:1394-1399.
Publish with Bio Med Central and every
scientist can read your work free of charge
"BioMed Central will be the most significant development for
disseminating the results of biomedical researc h in our lifetime."
Sir Paul Nurse, Cancer Research UK
Your research papers will be:
available free of charge to the entire biomedical community
peer reviewed and published immediately upon acceptance
cited in PubMed and archived on PubMed Central
yours — you keep the copyright
BioMedcentral
Submit your manuscript here:
/>
Page 15 of 15
(page number not for citation purposes)