Báo cáo y học: " Mucosal administration of α-fodrin inhibits experimental Sjögren''''s syndrome autoimmunity" pps
Bạn đang xem bản rút gọn của tài liệu. Xem và tải ngay bản đầy đủ của tài liệu tại đây (762.57 KB, 8 trang )
Open Access
Available online />Page 1 of 8
(page number not for citation purposes)
Vol 10 No 2
Research article
Mucosal administration of α-fodrin inhibits experimental
Sjögren's syndrome autoimmunity
Jing He, Jinxia Zhao and Zhanguo Li
Department of Rheumatology & Immunology, People's Hospital, Peking University Medical School, 11 Xizhimen South Street, Beijing 100044, China
Corresponding author: Zhanguo Li,
Received: 9 Dec 2007 Revisions requested: 7 Feb 2008 Revisions received: 26 Mar 2008 Accepted: 18 Apr 2008 Published: 18 Apr 2008
Arthritis Research & Therapy 2008, 10:R44 (doi:10.1186/ar2403)
This article is online at: />© 2008 He et al.; licensee BioMed Central Ltd.
This is an open access article distributed under the terms of the Creative Commons Attribution License ( />),
which permits unrestricted use, distribution, and reproduction in any medium, provided the original work is properly cited.
Abstract
Introduction α-Fodrin is an autoantigen in Sjögren's syndrome.
We hypothesized that mucosal administration of α-fodrin might
prevent the disease.
Methods Four-week-old NOD mice were immunized (intranasal)
with a 1 μg or 10 μg dose of α-fodrin every other day. PBS 10
μl/dose and Glutathione transferase (GST 10 μg/dose (control
mice) were intranasally administrated by the same procedure.
The salivary flow was maintained in immunized animals. The
animals were analyzed for the presence of anti-Sjögren's
syndrome A, anti-Sjögren's syndrome B, rheumatoid factor and
antinuclear, anti-α-fodrin, and anti-type 3 muscarinic
acetylcholine receptor polypeptide (anti-M3RP) by
immunofluorescence or ELISA. The cytokines IFNγ and IL-10
were measured by ELISA. Salivary glands were examined by
H&E staining and immunohistochemical analysis. The water-
volume intake was calculated for each group. The induction of
regulatory T cells was assessed by fluorescence-activated cell
sorting analysis for the frequency of Foxp3
+
cells among
peripheral CD4
+
CD25
+
T cells.
Results The appearance of anti-α-fodrin and anti-M3RP
antibodies was delayed in mice immunized with α-fodrin. The
titers of anti-α-fodrin and anti-M3RP antibodies were lower in
immunized mice (P < 0.05), but there was no significant
difference between the low-dose or high-dose immunization
groups. Five out of eight mice in the GST group, five of eight
mice in the PBS group, two of eight mice in the α-fodrin 1 μg/
dose group, and three out of eight mice in the α-fodrin 10 μg/
dose were positive for antinuclear antibodies. The levels of
serum IFNγ in mice immunized with 1 μg/dose or 10 μg/dose α-
fodrin, with PBS, and with GST were 41.9 ± 16.2 pg/ml, 37.1
± 15.4 pg/ml, 86.8 ± 17.8 pg/ml and 71.6 ± 11.1 pg/ml,
respectively, while we found no difference in the levels of serum
IL-10 among the groups. The number of Foxp3
+
CD4
+
CD25
+
regulatory T cells was higher in the α-fodrin groups compared
with the PBS and GST control groups (P < 0.05). Lymphocytic
infiltration and expression of α-fodrin in the salivary glands was
decreased in α-fodrin-treated groups. The fluid intake of mice in
the 1 μg/dose α-fodrin, 10 μg/dose α-fodrin, PBS, and GST
groups was 39.2 ± 2.1 ml, 40.4 ± 2.5 ml, 49.3 ± 3.1 ml and
51.6 ± 2.8 ml, respectively.
Conclusion Mucosal administration of α-fodrin effectively
inhibited the progression of experimental Sjögren's syndrome
autoimmunity.
Introduction
Primary Sjögren's syndrome (SS) is a chronic autoimmune dis-
order of unknown etiology. Lymphocytic infiltration of the lach-
rymal and salivary glands leads to dry mouth (xerostomia) and
dry eyes (xerophthalmia). It has been assumed that a combina-
tion of immunologic, genetic, and environmental factors plays
an important role in the development of autoimmune abnormal-
ities in primary SS.
In 1997 Haneji and colleagues identified a 120 kDa fragment
of the ubiquitous cytoskeletal protein α-fodrin as an autoanti-
gen in the NFS/sld mouse model of human SS [1]. It has been
shown by immunoblotting that anti-α-fodrin antibodies are
present in sera from 93% of primary SS patients and from
63% of secondary SS patients, but not in sera from systemic
lupus erythematosus (SLE) patients or rheumatoid arthritis
patients and normal control individuals [1]. In a previously pub-
lished study we reported similar results, finding that these
BSA = bovine serum albumin; ELISA = enzyme-linked immunosorbent assay; GST = Glutathione transferase; H&E = hematoxylin and eosin; IFN =
interferon; IL = interleukin; M3RP = type 3 muscarinic acetylcholine receptor polypeptide; PBS = phosphate-buffered saline; SLE = systemic lupus
erythematosus; SS = Sjögren's syndrome; Th = T helper.
Arthritis Research & Therapy Vol 10 No 2 He et al.
Page 2 of 8
(page number not for citation purposes)
antibodies are positively correlated with the systemic manifes-
tation of SS [2,3]. In vivo roles of α-fodrin N-terminal portion
peptides were investigated using peripheral blood mononu-
clear cells from patients with SS, from patients with SLE, and
from patients with rheumatoid arthritis. Significant proliferative
T-cell responses of peripheral blood mononuclear cells o α-
fodrin peptide were detected in SS but not in SLE or rheuma-
toid arthritis [4]. We previously identified in vivo immunoregu-
lation of α-fodrin using the same method. Kurien and
colleagues had induced oral tolerance in experimental SS ani-
mal successfully [5]. There have been other reports of nasal
and oral tolerance in SS [6,7], a phenomenon that brings
about systemic immune hyporesponsiveness by the exoge-
nous administration of antigen to the peripheral immune sys-
tem through the mucosal route.
We hypothesized that nasal tolerance could be induced in an
experimental animal model of SS by nasal administration of α-
fodrin, potentially preventing and inhibiting the development of
SS. The present study was undertaken in order to test this
hypothesis.
Materials and methods
Materials
The plasmid (pGEX-4T-2–α-fodrin) was a generous gift from
Professor Hayashi of the Tokushima University School of Den-
tistry in Japan.
Large-scale bacterial expression and fusion protein
purification
A 5 ml saturated culture of pGEX-4T-2–α-fodrin-transformed
bacteria grown in Luria-Bertani(LB) medium supplemented
with ampicillin (100 μg/ml) was used to inoculate 200 ml LB
medium. This culture was allowed to reach the log phase (A
600
= 0.6) before induction with Isopropyl β-D-1-Thiogalactopyra-
noside (IPTG) (1 mM final). The induction was carried out for
4 hours at 37°C (300 rpm), and then the bacteria were har-
vested by centrifugation (1,200 × g for 10 min, 4°C). The
resulting pellets were resuspended in 24 ml ice-cold 10 mM
Tris (pH 7.5), 10% glycerol, 10 mM dithiothreitol. Bacteria
were lysed by sonication, and bacterial inclusion bodies were
collected by centrifugation (40,000 × g for 10 min, 4°C). The
sample was passed over a 5 ml glutathione-Sepharose affinity
column equilibrated with PBS, and the fusion protein was
eluted with 10 ml elution buffer (5 mM glutathione, 50 mM Tris,
pH 8.0) collected in 2 ml fractions. The final yield of purified α-
fodrin was 2 mg.
Mice
Female NOD mice (4 weeks old) were purchased from the
Laboratory Animal Resource Center of the Peking University
Medical Science Center and were acclimatized to the center
for 1 week before starting the experimental protocol. Animals
were maintained in a specific pathogen free environment, and
were fed standard rodent chow and water ad libitum. The
study was approved by the Animal Care and Use Committee
of the Peking University People's Hospital.
Treatment protocol
Four groups, each consisting of eight NOD mice, were used.
Groups I and II were immunized every other day with 1 μg and
10 μg.
Glutathione transferase–α-fodrin fusion protein, respectively.
Group III was immunized with 10 μg Glutathione transferase
every other day, and Group IV was immunized with 10 μl PBS
every other day. Immunization was given by nasal administra-
tion. Preimmune bleeds were collected from all mice. Postim-
mune bleeds were collected every 2 weeks. Mice were killed
at 17 weeks of age by cervical dislocation.
Peptides
The sequence of the type 3 muscarinic acetylcholine receptor
second loop polypeptide (KRTVPPGECFIQFLSE) is a known
M3R epitope based on previous studies [5]. This linear pep-
tide was synthesized using solid-phase techniques on an
Applied Biosystems Peptide Synthesizer (APEX396, AAPP-
PEC, Kentucky, USA) at SBS Gene Technology Company
(Shanghai, China). The peptide was purified by reversed-
phase high-performance liquid chromatography to a purity
>90%.
Quantitation of anti-type 3 muscarinic acetylcholine
receptor polypeptide antibody by ELISA
A solid-phase immunoassay for the type 3 muscarinic acetyl-
choline receptor polypeptide (M3RP) was performed as previ-
ously described. Briefly, 96-well ELISA plates (Costarvinyl,
Cambridge, MA, USA) were coated with 100 μl of 10 μg/ml
M3RP in 0.5 M carbonate buffer, pH 9.6. Coating was per-
formed at 4°C overnight, followed by blocking with 100 μl of
5% milk in PBS (pH 7.4) containing 0.1% BSA. After washing
with PBS–Tween 20, the wells were then loaded with 100 μl
mouse serum (1:100 dilution) and were incubated at room
temperature for 2 hours, at which point the wells were washed
five times with PBS–Tween 20. Then 100 μl goat anti-mouse
IgG conjugated to peroxidase (1:4,000; Zhongshan Technol-
ogy Company, Beijing, China) was added to each well and
incubated for 1 hour at room temperature. After washing five
times with PBS–Tween 20, the bound antibodies were
detected with the substrate, O-phenylenediamine. The reac-
tion was stopped by addition of 100 μl of 2.5 M sulfuric acid
to each well. Plates were read at a wavelength 492 nm
(absorbance, OD
492 nm
) with an ELISA plate reader (BIO-RAD
Model 550; MICROPLATE READER, Hercules California,
USA). Each serum sample was assayed in duplicate. The
results were expressed as optical density units ± standard
deviation. An optical density value greater than two standard
deviations from the mean optical density value of the control
sera was considered positive.
Available online />Page 3 of 8
(page number not for citation purposes)
Autoantibody quantitation
The IgG class autoantibodies against SSA, SSB, rheumatoid
factor (Euroimmun, Lübeck, Germany) and anti-α-fodrin anti-
body (AESKI, Wendelsheim, Germany) were measured by
ELISA. Antinuclear antibodies were measured by immunofluo-
rescence according to the manufacturer's instructions
(Euroimmun).
Preparation of lymphocytes and flow cytometry
Lymphocyte suspensions were prepared from spleens and
lymph nodes. For flow cytometric analysis, 1 × 10
6
cells were
incubated with fluorescein isothiocyanate-labeled anti-CD4
and activated protein C-labeled anti-CD25 (BD Biosciences,
Franklin Lakes, NJ USA). For intracellular staining of Foxp3,
lymphocytes were first surface-labeled (CD4 and CD25),
were then fixed and permeabilized using the Cytofix/Cytoperm
kit (BD Biosciences), and finally were stained with anti-Foxp3-
PE (BD Biosciences). Cells were analyzed by flow cytometry
(BECTONDICKINSON, FACSort, Franklin Lakes, NJ USA).
Analysis of cytokine production
Samples of blood were collected at the end of the experiment.
Serum levels of IFNγ and IL-10 were measured with a commer-
cial ELISA kit (R&D, Minneapolis, Mn. USA) according to the
recommendations of the manufacturer.
Histological and immunohistochemical analysis
After the mice were killed, the submandibular and sublingual
salivary glands were surgically removed, fixed in 10% buffered
formalin, and embedded in paraffin. Four-micrometer sections
were prepared. H&E staining was performed to determine the
degree of inflammation. Infiltrates appear as periductal and
perivascular foci within the glandular architecture of the sali-
vary glands. Focal scores classified as 1 or above, which con-
sist of clusters of >50 lymphocytes in a 4 mm
2
area, are
considered abnormal. Immunostaining was performed by the
avidin–biotin complex method, using anti-α-fodrin polyclonal
antibody (Cell Signaling, Danvers, Boston, USA).
Measurement of the water volume intake of mice
We fed and watered the mice carefully. Each bottle of water
was measured to 200 ml on the first weekday, and the remain-
ing water volume at the end of the week was measured to cal-
culate the volume of water drunk by the mice. Food was given
to the mice separate from the water. Mice were separated and
the volume of water was measured every week. The volumes
of the groups were then compared.
Statistical analysis
Experimental findings were presented using the Mann–Whit-
ney U test (two-tailed, independent). Analyses were carried
out using SPSS 13.0 software (SPSS
®
Base 13.0, Wacker
Drive, Chicago, USA). The statistical significance level was set
at P = 0.05.
Results
Effect of α-fodrin immunization on autoantibody
production
To detect any effect of α-fodrin immunization of NOD mice, we
analyzed the appearance of anti-M3RP, anti-α-fodrin, anti-SSA
and anti-SSB antibodies, as well as rheumatoid factor and
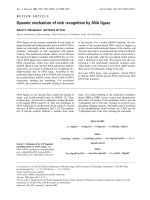
antinuclear antibodies. As shown in Figure 1, the titer of anti-
α-fodrin and anti-M3RP antibodies was lower in mice immu-
nized with α-fodrin (P < 0.05), but there was no significant dif-
ference between the two α-fodrin dosage groups. Five out of
eight mice in the GST control group, five of eight mice in the
PBS group, two of eight mice in the 1 μg/dose α-fodrin group,
and three out of eight mice in the 10 μg/dose α-fodrin group
were positive for antinuclear antibodies (all with speckled pat-
tern). Antibodies against SSA and SSB, and against rheuma-
toid factor, however, were not detected in any of the mice.
These results demonstrate that intranasal administration of α-
fodrin can suppress the production of SS-related antibodies,
while PBS or GST treatment had no dramatic effect on
autoantibody production.
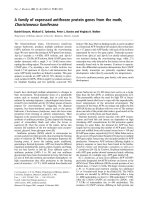
Effect of α-fodrin immunization on cytokine production
The serum levels of IFNγ and IL-10 were detected by ELISA,
as described in a this study. The serum levels of IFNγ in mice
immunized with the 1 μg/dose or 10 μg/dose α-fodrin, with
PBS, and with GST were 41.9 ± 16.2 pg/ml, 37.1 ± 15.4 pg/
ml, 86.8 ± 17.8 pg/ml, and 71.6 ± 11.1 pg/ml, respectively
(Figure 2). The levels of IFNγ in the α-fodrin groups were much
lower than those in control mice (P < 0.05), but there was no
significant difference in the levels of serum IL-10 among the
four groups. This result suggested that nasal administration of
α-fodrin was able to prevent the in vivo production of the
inflammatory cytokine IFNγ, but had little influence on the pro-
duction of the anti-inflammatory cytokine IL-10.
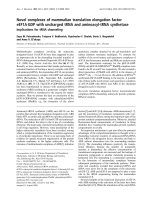
Effects of α-fodrin immunization on Foxp3
+
CD4
+
CD25
+
regulatory T cells
As shown in Figure 3, the frequency of Foxp3
+
regulatory T
cells among the CD4
+
CD25
+
T-cell subset in the mice treated
with 1 μg/dose α-fodrin, 10 μg/dose α-fodrin, PBS, and GST
were 4.01 ± 1.70%, 4.34 ± 0.98%, 2.17 ± 0.60%, and 2.29
± 0.66%, respectively. The number of Foxp3
+
CD4
+
CD25
+
regulatory T cells was higher in the fodrin groups
compared with the PBS and GST controls (P < 0.05), but
there was no difference between the 1 μg/dose and 10 μg/
dose α-fodrin groups.
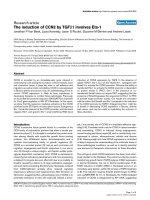
Effects of α-fodrin immunization on the histopathologic
analysis of NOD mice
As shown in Figure 4, the sublingual salivary glands of each
mouse were infiltrated by lymphocytes, and seem to be abnor-
mal. As shown in Figures 4 and 5, however, lymphocytic infil-
tration and expression of α-fodrin was decreased in the
salivary glands of α-fodrin-immunized groups. These results
Arthritis Research & Therapy Vol 10 No 2 He et al.
Page 4 of 8
(page number not for citation purposes)
show that nasal administration of α-fodrin can suppress
destruction of the salivary gland, while the GST and PBS con-
trol treatments failed to interfere with an ongoing SS process.
Effects of α-fodrin immunization on water volume intake
of NOD mice
As shown in Figure 6, at the end of the experiment, when the
mice were 17 weeks old, the volumes of water consumed per
mouse in the 1 μg/dose α-fodrin, 10 μg/dose α-fodrin, PBS,
and GST groups were 39.2 ± 2.1 ml, 40.4 ± 2.5 ml, 49.3 ±
3.1 ml, and 51.6 ± 2.8 ml, respectively. The volume for α-fodrin
groups was significantly lower than that for the control groups
(P < 0.05). These results show that nasal administration of α-
fodrin can maintain function of the salivary gland.
Discussion
There has been much investigation into the different aspects
of the pathogenesis behind human autoimmune diseases,
including SS. The hypofunction of the salivary and lachrymal
glands characteristic of SS is due to lymphocytic infiltration. It
is generally assumed that autoreactive T cells recognize an
unknown self-antigen and play a central role in the pathogen-
esis of this disease.
Various autoantibodies reactive with epitopes expressed in
target organs have been detected in the sera from patients
with autoimmune disease [1,8-11]. These antibodies –
directed against nuclear, cytoplasmic, and cell-surface pro-
teins – have been used as diagnostic tools for disease onset
and progression [1,12,13]. One of the first-described antibod-
ies associated with autoimmune diseases was antinuclear
antibodies, and then SSA and SSB antibodies were found,
especially in SS. Other sets of autoantigens appear to be gen-
erated during the process of apoptosis through the exposure
of potential cryptic antigens following cleavage by activated
caspases. For example, the proteolytic product of autoanti-
bodies in SS is of potential diagnostic value [1], although the
role in disease initiation or progression has yet to be defined.
Fodrin is an actin-binding protein in the cortical cytoskeleton
of most eukaryotic cells that is associated with autoimmune
lesions in thymectomized mice [1,14]. Our previous studies
have shown that α-fodrin antibodies can be detected in the
sera of most primary SS patients and are positively correlated
with the extrasecretory manifestations [2,3,15]. A study by
Haneji and colleagues suggested that serum from an NFS/sld
mouse model of human SS reacted with α-fodrin, specifically
expressed in the lesional salivary glands [1]. Using peripheral
blood mononuclear cells from patients with SS, from patients
Figure 1
α-Fodrin immunization effect on type 3 muscarinic acetylcholine receptor polypeptide antibody and anti-α-fodrin antibody productionα-Fodrin immunization effect on type 3 muscarinic acetylcholine receptor polypeptide antibody and anti-α-fodrin antibody production. Titer
of (a) anti-type 3 muscarinic acetylcholine receptor polypeptide (anti-M3RP) antibodies and (b) anti-α-fodrin antibodies increased in each group of
mice with time. By 17 weeks of age, the titer of (c) anti-M3RP antibodies and (d) anti-α-fodrin antibodies was lower in mice immunized with α-fodrin
(P < 0.05), but there was no significant difference between the two α-fodrin-immunized groups. Glutathione transferase; OD, optical density.
Available online />Page 5 of 8
(page number not for citation purposes)
with SLE, and from patients with rheumatoid arthritis, Miyazaki
and colleagues reported that significant in vitro proliferation of
T cells in response to α-fodrin was detected in SS, but not in
SLE and rheumatoid arthritis [4]. All these studies showed the
role of autoantigen in the development of primary SS.
Studies on the NOD mouse have begun to provide us with
invaluable insights into the pathogenic mechanisms underlying
the development of SS. The NOD mouse revealed the exist-
ence of two phases in the pathogenesis of SS. First, there is
the disruption of homeostasis in the target tissue, resulting in
increased apoptosis as well as cysteine proteinase activity,
aberrant protein expression, and loss of amylase activity. Sec-
ond, the involvement of immune components leading to activa-
tion of T cells and B cells and the generation of autoantibodies
provide the hallmark clinical symptoms of dry eyes and dry
mouth. Studies have, however, shown that only 10% of NOD
mice can be detected as anti-SSA-positive [16,17]. There had
been over 60 mice used in our previous study and the present
study, but no NOD mouse studied presented anti-SSA anti-
body in serum – which may related to the mice we bought and
also to the methods used to detect the antibodies. As we
know, NOD mice can also be used as a diabetic model. In our
study, the blood sugar of two mice in each group elevated by
the end of 16 weeks, so all mice were sacrificed soon after to
avoid the influence of possible diabetic disorder.
Generally, immune tolerance is acquired by various mecha-
nisms during maturation of the immune system. Low doses of
administered antigen favor active suppression [18]. Nasal
administration of autoantigens has been used to treat autoim-
mune diseases in animals and in humans [19,20]. In the
present study, we tried to identify whether nasal tolerance
could be induced in an experimental animal model of SS by
mucosal administration of α-fodrin, thus preventing disease
development. Mucosal tolerance prevents the body from elic-
iting productive immune responses against harmless antigens
that enter the body via the mucosal route, and is mediated by
the induction of regulatory T cells that differentiate in the
mucosa-draining lymph nodes under defined conditions of
antigen presentation [6,7].
In the present study, we noticed that the number of Foxp3
+
CD4
+
CD25
+
regulatory T cells was higher in the α-fodrin
groups than in the PBS and GST control groups, the amount
of water consumed by mice of the α-fodrin groups was lower,
and the titer of SS-related antibodies was lower. These events
may initiate local IgG in the mucosa-draining lymph nodes,
downregulating dendritic cell activation induced by nasally
applied antigen – resulting in those defined conditions of
antigen presentation that lead to regulatory T-cell induction
Figure 2
Effect of α-fodrin immunization on cytokine productionEffect of α-fodrin immunization on cytokine production. Serum levels of IFNγ in mice in the 1 μg/dose α-fodrin, 10 μg/dose α-fodrin, PBS, and
Glutathione transferase groups were 41.9 ± 16.2 pg/ml, 37.1 ± 15.4 pg/ml, 86.8 ± 17.8 pg/ml, and 71.6 ± 11.1 pg/ml, respectively. IFNγ levels of
the α-fodrin groups were much lower than those of the control groups (P < 0.05), but no difference was found of the levels of serum IL-10 among
the four groups.
Figure 3
Effect of α-fodrin immunization on Foxp3
+
CD4
+
CD25
+
regulatory T cellsEffect of α-fodrin immunization on Foxp3
+
CD4
+
CD25
+
regulatory
T cells. Frequency of Foxp3
+
CD4
+
CD25
+
regulatory T cells was
higher in the α-fodrin groups than in the PBS and Glutathione trans-
ferase control groups (P < 0.05), but there was no difference between
the two fodrin groups.
Arthritis Research & Therapy Vol 10 No 2 He et al.
Page 6 of 8
(page number not for citation purposes)
and tolerance; however, this pathway still needs to be further
identified.
Previous reports show that these mice could be measured for
salivary flow directly, but we are less skilled in this area and
cannot measure the salivary flow precisely. So water con-
sumption was calculated to measured salivary flow.
We show here that SS-related antibodies in the serum and the
amount of water consumed can be decreased by mucosal
administration of low doses of α-fodrin. In addition, this protein
can prevent or limit lymphocyte infiltration, as well as the
expression of α-fodrin antigen in the salivary glands, which
may play a role in the salivary flow decrement. Although we
have not seen a clear relevance of salivary flow with the
amount of water consumed and with the antibodies apparent
in the serum, it is possible that antibodies such as anti-M3RP
and anti-α-fodrin antibodies may have a role in the salivary flow
decrement.
The mechanism by which this treatment protects against
impaired gland activity has not yet been elucidated. We pro-
pose that multiple low doses of autoantigen may result in the
generation of antigen-specific regulatory cells, which in turn
secrete immunosuppressive cytokines such as transforming
growth factor beta upon restimulation with the antigen. Our
results indicated that the number of Foxp3
+
CD4
+
CD25
+
reg-
ulatory T cells was higher in the α-fodrin groups than in the
PBS and GST control groups, which supports this idea. In
addition, the Th1/Th2 balance may also contribute to the proc-
esses of disease development or tolerance. As shown above,
the Th1 cytokine IFNγ was increased in the α-fodrin immunized
group, while IL-10, a Th2 cytokine, was not. Even though we
failed to detect a significant increae of IL-10, the role of Th2
cytokines cannot be entirely ruled out, particularly for cytokines
such as IL-10 and transforming growth factor beta, which may
play a role.
Following their generation, antigen-specific regulatory cells
then migrate to the lymphoid organs where they can suppress
immune responses by inhibiting the generation of effecter
cells. They may also migrate to the target organ and suppress
disease by releasing cytokines. We superficially investigated
the regulatory mechanisms controlling SS in this model, but
further studies will be required.
Figure 4
Effect of α-fodrin immunization on the histopathologic analysis of NOD miceEffect of α-fodrin immunization on the histopathologic analysis of NOD mice. Effect of α-fodrin immunization on the histopathologic analysis in
the (a) 1 μg/dose α-fodrin group, (b) 10 μg/dose α-fodrin group, (c) PBS group, and (d) Glutathione transferase group. Tissues were stained with
H&E. Lymphocytic infiltration was decreased in the glands of α-fodrin-administrated groups ((a) and (b) Each red arrow represent the focus of the
lyphocytic infiltration.).
Available online />Page 7 of 8
(page number not for citation purposes)
In conclusion, we were able to demonstrate that nasally admin-
istrated α-fodrin can induce tolerance against this antigen,
blocking the lymphocytic infiltration of the salivary gland, and
influencing salivary dysfunction in this animal model of SS.
Conclusion
Mucosal administration of α-fodrin effectively suppresses the
production of SS-related antibodies, prevents the in vivo pro-
duction of inflammatory cytokines, such as IFNγ, and increases
the number of Foxp3
+
CD4
+
CD25
+
regulatory T cells. The
Figure 5
Effect of α-fodrin expression on histopathologic analysis of NOD miceEffect of α-fodrin expression on histopathologic analysis of NOD mice. Effect of α-fodrin expression on histopathologic analysis in the (a) 1 μg/
dose α-fodrin group, (b) 10 μg/dose α-fodrin group, (c) PBS group, and (d) Glutathione transferase group. Immunohistochemical analysis of sali-
vary gland sections from NOD mice using polyclonal antibodies against α-fodrin. Epithelial duct cells were intensely stained, especially within the
inflammatory lesions. Immunoreactivity was decreased in the salivary glands of α-fodrin-administrated groups ((a) and (b)).
Figure 6
Effect of α-fodrin immunization on water volume intake of NOD miceEffect of α-fodrin immunization on water volume intake of NOD mice. Mice were monitored for water consumption until 17 weeks old. Mice
from the 1 μg/dose α-fodrin, 10 μg/dose α-fodrin, PBS, and Glutathione transferase groups showed water consumption of 39.2 ± 2.1 ml, 40.4 ±
2.5 ml, 49.3 ± 3.1 ml, and 51.6 ± 2.8 ml, respectively. The volume of fluid intake by α-fodrin-immunized groups was therefore lower than in the con-
trol groups (P < 0.05).
Arthritis Research & Therapy Vol 10 No 2 He et al.
Page 8 of 8
(page number not for citation purposes)
present study raised the hypothesis that mucosal administra-
tion of α-fodrin possibly inhibits the progression of experimen-
tal SS autoimmunity.
Competing interests
The authors declare that they have no competing interests.
Authors' contributions
Jing He performed most of the experiments. Jingxia Zhao per-
formed experiments in animal test. Zhanguo Li conceived the
study and participated in the design, in the interpretation of
results. Jing He participated in drafting the manuscript. All
authors read and approved the final manuscript.
Acknowledgements
This work was supported by a grant from the National Natural Science
Foundation of China (No. 30600556).
References
1. Haneji N, Nakamura T, Takio K, Yanagi K, Higashiyama H, Hayashi
Y: Identification of α-fodrin as a candidate autoantigen in pri-
mary Sjögren's syndrome. Science 1997, 276:604-607.
2. He J, Chen Q, Li J, Li ZG: Antibodies to α-fodrin-derived peptide
in Sjögren's syndrome. Ann Rheum Dis 2006, 65:549-550.
3. He J, Li J, Li ZG: The role of anti-α-fodrin-derived peptide in
Sjögren's syndrome. Chin J Rheumatol 2003, 7:600-603.
4. Miyazaki K, Takeda N, Ishimaru N, Omotehara F, Arakaki R, Hay-
ashi Y: Analysis of in vivo role of α-fodrin autoantigen in pri-
mary Sjögren's syndrome. Am J Pathol 2005, 167:1051-1059.
5. Kurien BT, Asfa S, Li CF, Dorri Y, Jonsson R, Scofield RH: Induc-
tion of oral tolerance in experimental Sjögren's syndrome
autoimmunity. Scand J Immunol 2005, 61:418-425.
6. Samsom JN, Marel AP van der, van Berkel LA, van Helvoort JM,
Simons-Oosterhuis Y, Jansen W, Greuter M, Nelissen RL, Meeu-
wisse CM, Nieuwenhuis EE, Mebius RE, Kraal G: Secretory leu-
koprotease inhibitor in mucosal lymph node dendritic cells
regulates the threshold for mucosal tolerance. J Immunol
2007, 179:6588-6595.
7. Samsom JN, van Berkel LA, van Helvoort JM, Unger WW, Jansen
W, Thepen T, Mebius RE, Verbeek SS, Kraal G: Fc gamma RIIB
regulates nasal and oral tolerance: a role for dendritic cells. J
Immunol. 2005, 174:5279-5287.
8. McCarty GA: Autoantibodies and their relation to rheumatic
diseases. Med Clin North Am 1986, 70:237-261.
9. Hardin JA, Mimori T: Autoantibodies to ribonucleoproteins. Clin
Rheum Dis 1985, 11:485-505.
10. Bacman S, Sterin-Borda L, Camusso JJ, Arana R, Hubscher O,
Borda E: Circulating antibodies against rat parotid gland M3
muscarinic receptors in primary Sjögren's syndrome. Clin Exp
Immunol 1996, 104:454-459.
11. Robinson CP, Brayer J, Yamachika S, Esch TR, Peck AB, Stewart
CA, Peen E, Jonsson R, Humphreys-Beher MG: Transfer of
human serum IgG to NOD.Igμ
null
mice reveals a role for
autoantibodies in Sjögren's syndrome. Proc Natl Acad Sci
USA 1998, 95:7538-7543.
12. Tan EM: Antinuclear antibodies: diagnostic markers for
autoimmune diseases and probes for cell biology. Adv
Immunol 1989, 44:93-151.
13. Fox RI, Kang HI: Pathogenesis of Sjögren's syndrome. Rheum
Dis Clin North Am. 1992, 18:517-538.
14. Yanagi K, Ishimaru N, Haneji N, Saegusa K, Saito I, Hayashi Y:
Anti-120-kDa α-fodrin immune response with Th1-cytokine
profile in the NOD mouse model of Sjögren's syndrome. Eur J
Immunol. 1998, 28:3336-3345.
15. Nakamura H, Kawakami A, Eguchi K: Mechanisms of autoanti-
body production and the relationship between autoantibodies
and the clinical manifestations in Sjögren's syndrome. Transl
Res 2006, 148:281-288.
16. Humphreys-Beher MG, Brinkley LL, Purushotham KR, Wang PL,
Nakagawa Y, Dusek D, Kerr M, Chegini N, Chan EK: Characteri-
zation of antinuclear antibodies present in the serum from
nonobese diabetic (NOD) mice. Clin Immunol Immunopathol
1993, 68:350-356.
17. Humphreys-Beher MG, Hu Y, Nakagawa Y, Wang PL, Purush-
otham KR: Utilization of the non-obese diabetic (NOD) mouse
as an animal model for the study of secondary Sjögren's
syndrome. Adv Exp Med Biol 1994, 350:631-636.
18. Gregerson DS, Obritsch WF, Donoso LA: Oral tolerance in
experimental autoimmune uveoretinitis. Distinct mechanisms
of resistance are induced by low dose vs high dose feeding
protocols. J Immunol 1993, 151:5751-5761.
19. Kang HK, Liu M, Datta SK: Low-dose peptide tolerance therapy
of lupus generates plasmacytoid dendritic cells that cause
expansion of autoantigen-specific regulatory T cells and con-
traction of inflammatory Th17 cells. J Immunol 2007,
178:7849-7858.
20. Bardos T, Czipri M, Vermes C, Zhang J, Mikecz K, Glant TT: Con-
tinuous nasal administration of antigen is critical to maintain
tolerance in adoptively transferred autoimmune arthritis in
SCID mice.
Clin Exp Immunol 2002, 129:224-231.