- Trang chủ >>
- Khoa Học Tự Nhiên >>
- Vật lý
The Earth’s Atmosphere Contents Part 3 ppt
Bạn đang xem bản rút gọn của tài liệu. Xem và tải ngay bản đầy đủ của tài liệu tại đây (2.09 MB, 47 trang )
with latitude. Large temperature changes cause most of
this latitudinal variation. For example, high cirriform
clouds are composed almost entirely of ice crystals. In
subtropical regions, air temperatures low enough to
freeze all liquid water usually occur only above about
20,000 feet. In polar regions, however, these same tem-
peratures may be found at altitudes as low as 10,000
feet. Hence, while you may observe cirrus clouds at
12,000 feet over northern Alaska, you will not see them
at that elevation above southern Florida.
Clouds cannot be accurately identified strictly on
the basis of elevation. Other visual clues are necessary.
Some of these are explained in the following section.
CLOUD IDENTIFICATION
High Clouds High clouds in middle and low latitudes
generally form above 20,000 ft (or 6000 m). Because the
air at these elevations is quite cold and “dry,” high
clouds are composed almost exclusively of ice crystals
and are also rather thin.* High clouds usually appear
white, except near sunrise and sunset, when the unscat-
tered (red, orange, and yellow) components of sunlight
are reflected from the underside of the clouds.
The most common high clouds are the cirrus,
which are thin, wispy clouds blown by high winds into
long streamers called mares’ tails. Notice in Fig. 4.18 that
they can look like a white, feathery patch with a faint wisp
of a tail at one end. Cirrus clouds usually move across the
sky from west to east, indicating the prevailing winds at
their elevation.
Cirrocumulus clouds, seen less frequently than
cirrus, appear as small, rounded, white puffs that may
occur individually, or in long rows (see Fig. 4.19). When
in rows, the cirrocumulus cloud has a rippling appear-
ance that distinguishes it from the silky look of the cir-
rus and the sheetlike cirrostratus. Cirrocumulus seldom
cover more than a small portion of the sky. The dappled
cloud elements that reflect the red or yellow light of a
setting sun make this one of the most beautiful of all
clouds. The small ripples in the cirrocumulus strongly
resemble the scales of a fish; hence, the expression “mac-
kerel sky” commonly describes a sky full of cirrocumu-
lus clouds.
The thin, sheetlike, high clouds that often cover the
entire sky are cirrostratus (Fig. 4.20), which are so thin
that the sun and moon can be clearly seen through them.
The ice crystals in these clouds bend the light passing
through them and will often produce a halo. In fact, the
veil of cirrostratus may be so thin that a halo is the only
clue to its presence. Thick cirrostratus clouds give the sky
a glary white appearance and frequently form ahead of an
advancing storm; hence, they can be used to predict rain
or snow within twelve to twenty-four hours, especially if
they are followed by middle-type clouds.
Middle Clouds The middle clouds have bases between
about 6500 and 23,000 ft (2000 and 7000 m) in the mid-
dle latitudes. These clouds are composed of water drop-
lets and—when the temperature becomes low enough—
some ice crystals.
Altocumulus clouds are middle clouds that appear
as gray, puffy masses, sometimes rolled out in parallel
waves or bands (see Fig. 4.21). Usually, one part of the
cloud is darker than another, which helps to separate it
from the higher cirrocumulus. Also, the individual puffs
of the altocumulus appear larger than those of the cir-
rocumulus. A layer of altocumulus may sometimes be
confused with altostratus; in case of doubt, clouds are
94 Chapter 4 Humidity, Condensation, and Clouds
*Studies conducted above Boulder, Colorado, discovered small quantities of
liquid water in cirrus clouds at temperatures as low as –36°C (–33°F).
FIGURE 4.18
Cirrus clouds.
Clouds 95
FIGURE 4.19
Cirrocumulus clouds.
FIGURE 4.20
Cirrostratus clouds with a halo.
FIGURE 4.21
Altocumulus clouds.
called altocumulus if there are rounded masses or rolls
present. Altocumulus clouds that look like “little cas-
tles” (castellanus) in the sky indicate the presence of ris-
ing air at cloud level. The appearance of these clouds on
a warm, humid summer morning often portends thun-
derstorms by late afternoon.
The altostratus is a gray or blue-gray cloud that of-
ten covers the entire sky over an area that extends over
many hundreds of square kilometers. In the thinner
section of the cloud, the sun (or moon) may be dimly
visible as a round disk, which is sometimes referred to as
a “watery sun” (see Fig. 4.22). Thick cirrostratus clouds
are occasionally confused with thin altostratus clouds.
The gray color, height, and dimness of the sun are good
clues to identifying an altostratus. The fact that halos
only occur with cirriform clouds also helps one distin-
guish them. Another way to separate the two is to look
at the ground for shadows. If there are none, it is a good
bet that the cloud is altostratus because cirrostratus
are usually transparent enough to produce them. Alto-
stratus clouds often form ahead of storms having
widespread and relatively continuous precipitation. If
precipitation falls from an altostratus, its base usually
lowers. If the precipitation reaches the ground, the
cloud is then classified as nimbostratus.
Low Clouds Low clouds, with their bases lying below
6500 ft (or 2000 m) are almost always composed of
water droplets; however, in cold weather, they may con-
tain ice particles and snow.
The nimbostratus is a dark gray, “wet”-looking
cloud layer associated with more or less continuously
falling rain or snow (see Fig. 4.23). The intensity of this
precipitation is usually light or moderate—it is never of
96 Chapter 4 Humidity, Condensation, and Clouds
FIGURE 4.22
Altostratus cloud. The appearance of
a dimly visible “watery sun” through
a deck of gray clouds is usually a
good indication that the clouds are
altostratus.
FIGURE 4.23
The nimbostratus is the sheetlike
cloud from which light rain is falling.
The ragged-appearing cloud beneath
the nimbostratus is stratus fractus,
or scud.
the heavy, showery variety. The base of the nimbostra-
tus cloud is normally impossible to identify clearly and
is easily confused with the altostratus. Thin nimbostra-
tus is usually darker gray than thick altostratus, and you
cannot see the sun or moon through a layer of nimbo-
stratus. Visibility below a nimbostratus cloud deck is
usually quite poor because rain will evaporate and mix
with the air in this region. If this air becomes saturated,
a lower layer of clouds or fog may form beneath the
original cloud base. Since these lower clouds drift rap-
idly with the wind, they form irregular shreds with a
ragged appearance called stratus fractus, or scud.
A low, lumpy cloud layer is the stratocumulus. It
appears in rows, in patches, or as rounded masses with
blue sky visible between the individual cloud elements
(see Fig. 4.24). Often they appear near sunset as the
spreading remains of a much larger cumulus cloud. The
color of stratocumulus ranges from light to dark gray. It
differs from altocumulus in that it has a lower base and
larger individual cloud elements. (Compare Fig. 4.21
with Fig. 4.24.) To distinguish between the two, hold
your hand at arm’s length and point toward the cloud.
Altocumulus cloud elements will generally be about the
size of your thumbnail; stratocumulus cloud elements
will usually be about the size of your fist. Rain or snow
rarely fall from stratocumulus.
Stratus is a uniform grayish cloud that often covers
the entire sky. It resembles a fog that does not reach the
ground (see Fig. 4.25). Actually, when a thick fog “lifts,”
the resulting cloud is a deck of low stratus. Normally, no
Clouds 97
FIGURE 4.24
Stratocumulus clouds. Notice that
the rounded masses are larger than
those of the altocumulus.
FIGURE 4.25
A layer of low-lying stratus clouds.
precipitation falls from the stratus, but sometimes it is
accompanied by a light mist or drizzle. This cloud com-
monly occurs over Pacific and Atlantic coastal waters in
summer. A thick layer of stratus might be confused with
nimbostratus, but the distinction between them can be
made by observing the base of the cloud. Often, stratus
has a more uniform base than does nimbostratus. Also,
a deck of stratus may be confused with a layer of alto-
stratus. However, if you remember that stratus clouds
are lower and darker gray, the distinction can be made.
Clouds with Vertical Development Familiar to almost
everyone, the puffy cumulus cloud takes on a variety of
shapes, but most often it looks like a piece of floating
cotton with sharp outlines and a flat base (see Fig. 4.26).
The base appears white to light gray, and, on a humid
day, may be only a few thousand feet above the ground
and a half a mile or so wide. The top of the cloud—
often in the form of rounded towers—denotes the limit
of rising air and is usually not very high. These clouds
can be distinguished from stratocumulus by the fact
that cumulus clouds are detached (usually a great deal
of blue sky between each cloud) whereas stratocumulus
usually occur in groups or patches. Also, the cumulus
has a dome- or tower-shaped top as opposed to the gen-
erally flat tops of the stratocumulus. Cumulus clouds
that show only slight vertical growth (cumulus humilis)
are associated with fair weather; therefore, we call these
clouds “fair weather cumulus.” If the cumulus clouds
are small and appear as broken fragments of a cloud
with ragged edges, they are called cumulus fractus.
Harmless-looking cumulus often develop on warm
summer mornings and, by afternoon, become much
larger and more vertically developed. When the growing
cumulus resembles a head of cauliflower, it becomes a
cumulus congestus, or towering cumulus. Most often, it is
a single large cloud, but, occasionally, several grow into
each other, forming a line of towering clouds, as shown
in Fig. 4.27. Precipitation that falls from a cumulus con-
gestus is always showery.
If a cumulus congestus continues to grow verti-
cally, it develops into a giant cumulonimbus—a thun-
98 Chapter 4 Humidity, Condensation, and Clouds
FIGURE 4.26
Cumulus clouds. Small cumulus clouds such as these are sometimes called fair weather cumulus, or cumulus humilis.
derstorm cloud (see Fig. 4.28). While its dark base may
be no more than 2000 ft above the earth’s surface, its top
may extend upward to the tropopause, over 35,000 ft
higher. A cumulonimbus can occur as an isolated cloud
or as part of a line or “wall” of clouds.
Tremendous amounts of energy are released by the
condensation of water vapor within a cumulonimbus
and result in the development of violent up- and down-
drafts, which may exceed fifty knots. The lower (warmer)
part of the cloud is usually composed of only water
droplets. Higher up in the cloud, water droplets and ice
crystals both abound, while, toward the cold top, there
are only ice crystals. Swift winds at these higher altitudes
can reshape the top of the cloud into a huge flattened
anvil. These great thunderheads may contain all forms of
precipitation—large raindrops, snowflakes, snow pellets,
and sometimes hailstones—all of which can fall to earth
in the form of heavy showers. Lightning, thunder, and
even violent tornadoes are associated with the cumu-
lonimbus. (More information on the violent nature of
thunderstorms and tornadoes is given in Chapter 10.)
Cumulus congestus and cumulonimbus frequently
look alike, making it difficult to distinguish between
them. However, you can usually distinguish them by
looking at the top of the cloud. If the sprouting upper
part of the cloud is sharply defined and not fibrous, it is
usually a cumulus congestus; conversely, if the top of the
cloud loses its sharpness and becomes fibrous in tex-
ture, it is usually a cumulonimbus. (Compare Fig. 4.27
with Fig. 4.28.) The weather associated with these
clouds also differs: lightning, thunder, and large hail
typically occur with cumulonimbus.
So far, we have discussed the ten primary cloud
forms, summarized pictorially in Fig. 4.29. This figure,
along with the cloud photographs and descriptions,
Clouds 99
FIGURE 4.27
Cumulus congestus. This line of cumulus congestus clouds is building along Maryland’s eastern shore.
On July 26, 1959, Colonel William A. Rankin took a
wild ride inside a huge cumulonimbus cloud. Bailing
out of his disabled military aircraft inside a thunderstorm
at 14.5 km (about 47,500 ft), Rankin free-fell for about
3 km (10,000 ft). When his parachute opened, surging
updrafts carried him higher into the cloud, where he
was pelted by heavy rain and hail, and nearly struck
by lightning.
100 Chapter 4 Humidity, Condensation, and Clouds
FIGURE 4.28
A cumulonimbus cloud. Strong upper-level winds blowing from right to left produce a
well-defined anvil. Sunlight scattered by falling ice crystals produces the white (bright) area
beneath the anvil. Notice the heavy rain shower falling from the base of the cloud.
23,000 ft
6500 ft
7000 m
2000 m
HIGH CLOUDS
MIDDLE CLOUDS
LOW CLOUDS
CLOUDS WITH
VERTICAL DEVELOPMENT
Anvil top
Cirrus
Cirrostratus
Cirrocumulus
(mackerel sky)
Steady precipitation
Stratus
Stratocumulus
Cumulus
Showery precipitation
Altostratus
(sun dimly visible)
Altocumulus
Cumulonimbus
Halo around sun
Nimbostratus
FIGURE 4.29
A generalized illustration of basic cloud types based on height above the surface and vertical development.
should help you identify the more common cloud
forms. Don’t worry if you find it hard to estimate cloud
heights. This is a difficult procedure, requiring much
practice. You can use local objects (hills, mountains, tall
buildings) of known height as references on which to
base your height estimates.
To better describe a cloud’s shape and form, a num-
ber of descriptive words may be used in conjunction with
its name. We mentioned a few in the previous section; for
example, a stratus cloud with a ragged appearance is a
stratus fractus, and a cumulus cloud with marked vertical
growth is a cumulus congestus. Table 4.4 lists some of the
more common terms that are used in cloud identification.
SOME UNUSUAL CLOUDS Although the ten basic cloud
forms are the most frequently seen, there are some un-
usual clouds that deserve mentioning. For example, moist
air crossing a mountain barrier often forms into waves.
The clouds that form in the wave crest usually have a lens
shape and are, therefore, called lenticular clouds (see Fig.
4.30). Frequently, they form one above the other like a
stack of pancakes, and at a distance they may resemble a
fleet of hovering spacecraft. Hence, it is no wonder a large
number of UFO sightings take place when lenticular
clouds are present.
Similar to the lenticular is the cap cloud, or pileus,
that usually resembles a silken scarf capping the top of
a sprouting cumulus cloud (see Fig. 4.31). Pileus clouds
form when moist winds are deflected up and over the
top of a building cumulus congestus or cumulonimbus.
If the air flowing over the top of the cloud condenses, a
pileus often forms.
Most clouds form in rising air, but the mammatus
forms in sinking air. Mammatus clouds derive their
name from their appearance—baglike sacks that hang
beneath the cloud and resemble a cow’s udder (see Fig.
4.32). Although mammatus most frequently form on
the underside of cumulonimbus, they may develop be-
neath cirrus, cirrocumulus, altostratus, altocumulus,
and stratocumulus.
Jet aircraft flying at high altitudes often produce a cir-
ruslike trail of condensed vapor called a condensation trail
or contrail (see Fig. 4.33). The condensation may come di-
rectly from the water vapor added to the air from engine ex-
haust. In this case, there must be sufficient mixing of the
hot exhaust gases with the cold air to produce saturation.
Contrails evaporate rapidly when the relative humidity
of the surrounding air is low. If the relative humidity is
high, however, contrails may persist for many hours. Con-
trails may also form by a cooling process as the reduced
Clouds 101
FIGURE 4.30
Lenticular clouds forming on the eastern side of the Sierra Nevada.
pressure produced by air flowing over the wing causes the
air to cool.
Aside from the cumulonimbus cloud that sometimes
penetrates into the stratosphere, all of the clouds de-
scribed so far are observed in the lower atmosphere—in
the troposphere. Occasionally, however, clouds may be
seen above the troposphere. For example, soft pearly look-
ing clouds called nacreous clouds, or mother-of-pearl
clouds, form in the stratosphere at altitudes above 30 km
or 100,000 ft (see Fig. 4.34). They are best viewed in polar
latitudes during the winter months when the sun, being
just below the horizon, is able to illuminate them because
102 Chapter 4 Humidity, Condensation, and Clouds
Lenticularis (lens, lenticula, lentil) Clouds having the shape of a lens; often elongated and usually with well-defined
outlines. This term applies mainly to cirrocumulus, alto-cumulus, and stratocumulus
Fractus (frangere, to break or Clouds that have a ragged or torn appearance; applies only to stratus and cumulus
fracture)
Humilis (humilis, of small size) Cumulus clouds with generally flattened bases and slight vertical growth
Congestus (congerere, to bring Cumulus clouds of great vertical extent that, from a distance, may
together; to pile up) resemble a head of cauliflower
Undulatus (unda, wave; having waves) Clouds in patches, sheets, or layers showing undulations
Translucidus (translucere, to shine Clouds that cover a large part of the sky and are sufficiently translucent
through; transparent) to reveal the position of the sun or moon
Mammatus (mamma, mammary) Baglike clouds that hang like a cow’s udder on the underside of a cloud;
may occur with cirrus, altocumulus, altostratus, stratocumulus, and cumulonimbus
Pileus (pileus, cap) A cloud in the form of a cap or hood above or attached to the upper part
of a cumuliform cloud, particularly during its developing stage
Castellanus (castellum, a castle) Clouds that show vertical development and produce towerlike exten-
sions, often in the shape of small castles
TABLE 4.4 Common Terms Used in Identifying Clouds
Term Latin Root and Meaning Description
FIGURE 4.31
A pileus cloud forming above a
developing cumulus cloud.
Clouds 103
FIGURE 4.32
Mammatus clouds.
FIGURE 4.33
A contrail forming behind a jet
aircraft, flying at about 10 km
(33,000 ft) above the surface.
of their high altitude. Their exact composition is not
known, although they appear to be composed of water in
either solid or liquid (supercooled) form.
Wavy bluish-white clouds, so thin that stars shine
brightly through them, may sometimes be seen in the
upper mesosphere, at altitudes above 75 km (46 mi).
The best place to view these clouds is in polar regions at
twilight. At this time, because of their altitude, the
clouds are still in sunshine. To a ground observer, they
appear bright against a dark background and, for this
reason, they are called noctilucent clouds, meaning
“luminous night clouds” (see Fig. 4.35). Studies reveal
104 Chapter 4 Humidity, Condensation, and Clouds
FIGURE 4.34
The clouds in this
photograph are
nacreous clouds.
They form in the
stratosphere and
are most easily
seen at high
latitudes.
FIGURE 4.35
The wavy clouds
in this photo-
graph are
noctilucent
clouds. They are
usually observed
at high latitudes,
at altitudes
between 75 and
90 km above the
earth’s surface.
that these clouds are composed of tiny ice crystals. The
water to make the ice may originate in meteoroids that
disintegrate when entering the upper atmosphere or
from the chemical breakdown of methane gas at high
levels in the atmosphere.
Questions for Review 105
saturated air
condensation nuclei
humidity
actual vapor pressure
saturation vapor pressure
relative humidity
supersaturated air
dew-point temperature
(dew point)
wet-bulb temperature
heat index (HI)
apparent temperature
psychrometer
hygrometer
dew
frost
haze
fog
radiation fog
advection fog
upslope fog
evaporation (mixing) fog
cirrus clouds
cirrocumulus clouds
cirrostratus clouds
altocumulus clouds
altostratus clouds
nimbostratus clouds
stratocumulus clouds
stratus clouds
cumulus clouds
cumulonimbus clouds
lenticular clouds
pileus clouds
mammatus clouds
contrail
nacreous clouds
noctilucent clouds
Summary
In this chapter, we examined the hydrologic cycle and
saw how water is circulated within our atmosphere.
We then looked at some of the ways of describing
humidity and found that relative humidity does not
tell us how much water vapor is in the air but, rather,
how close the air is to being saturated. A good indica-
tor of the air’s actual water vapor content is the dew-
point temperature. When the air temperature and
dew point are close together, the relative humidity is
high, and, when they are far apart, the relative hu-
midity is low.
When the air temperature drops below the dew
point in a shallow layer of air near the surface, dew
forms. If the dew freezes, it becomes frozen dew. Visi-
ble white frost forms when the air cools to a below
freezing dew-point temperature. As the air cools in a
deeper layer near the surface, the relative humidity in-
creases and water vapor begins to condense upon “wa-
ter seeking” hygroscopic condensation nuclei, forming
haze. As the relative humidity approaches 100 percent,
the air can become filled with tiny liquid droplets (or
ice crystals) called fog. Upon examining fog, we found
that it forms in two primary ways: cooling the air and
evaporating and mixing water vapor into the air.
Condensation above the earth’s surface pro-
duces clouds. When clouds are classified according
to their height and physical appearance, they are di-
vided into four main groups: high, middle, low, and
clouds with vertical development. Since each cloud
has physical characteristics that distinguish it from
all the others, careful observation normally leads to
correct identification.
Key Terms
The following terms are listed in the order they appear in
the text. Define each. Doing so will aid you in reviewing
the material covered in this chapter.
evaporation
condensation
precipitation
hydrologic cycle
Questions for Review
1. Briefly explain the movement of water in the hydro-
logic cycle.
2. How does condensation differ from precipitation?
3. What are condensation nuclei and why are they im-
portant in our atmosphere?
4. In a volume of air, how does the actual vapor pressure
differ from the saturation vapor pressure? When are
they the same?
5. What does saturation vapor pressure primarily de-
pend upon?
6. (a) What does the relative humidity represent?
(b) When the relative humidity is given, why is it also
important to know the air temperature?
(c) Explain two ways the relative humidity may be
changed.
(d) During what part of the day is the relative humid-
ity normally lowest?
7. Why do hot and humid summer days usually feel hot-
ter than hot and dry summer days?
8. Why is cold polar air described as “dry” when the rel-
ative humidity of that air is very high?
9. Why is the wet-bulb temperature a good measure of
how cool human skin can become?
10. (a) What is the dew-point temperature?
(b) How is the difference between dew point and air
temperature related to the relative humidity?
11. How can you obtain both the dew point and the rela-
tive humidity using a sling psychrometer?
12. Explain how dew, frozen dew, and visible frost form.
13. List the two primary ways in which fog forms.
14. Describe the conditions that are necessary for the for-
mation of:
(a) radiation fog
(b) advection fog
15. How does evaporation (mixing) fog form?
16. Clouds are most generally classified by height. List the
major height categories and the cloud types associated
with each.
17. How can you distinguish altostratus clouds from cir-
rostratus clouds?
18. Which clouds are associated with each of the follow-
ing characteristics:
(a) mackerel sky
(b) lightning
(c) halos
(d) hailstones
(e) mares’ tails
(f) anvil top
(g) light continuous rain or snow
(h) heavy rain showers
Questions for Thought
and Exploration
1. Use the concepts of condensation and saturation to
explain why eyeglasses often fog up after coming in-
doors on a cold day.
2. After completing a grueling semester of meteorologi-
cal course work, you call your travel agent to arrange a
much-needed summer vacation. When your agent
suggests a trip to the desert, you decline because of a
concern that the dry air will make your skin feel un-
comfortable. The travel agent assures you that almost
daily “desert relative humidities are above 90 percent.”
Could the agent be correct? Explain.
3. Can the actual vapor pressure ever be greater than the
saturation vapor pressure? Explain.
4. Suppose while measuring the relative humidity using
a sling psychrometer, you accidently moisten both the
dry bulb and the wet bulb thermometer. Will the rel-
ative humidity you determine be higher or lower than
the air’s true relative humidity?
5. Why is advection fog more common on the west coast
of the United States than on the east coast?
6. With all other factors being equal, would you expect a
lower minimum temperature on a night with cirrus
clouds or on a night with stratocumulus clouds? Ex-
plain your answer.
7. Use the Moisture and Stability/Moisture Graph activ-
ity on the Blue Skies CD-ROM to answer the follow-
ing questions.
(a) If the temperature is 30°C, what must the dew-
point temperature be to obtain a relative humid-
ity of 90 percent?
(b) If the dew-point temperature in part (a) de-
creases to 20°C, what is the resulting relative hu-
midity?
(c) At what temperature does a 20°C dew-point tem-
perature result in 90 percent relative humidity?
8. Use the Weather Forecasting/Forecasting section of
the Blue Skies CD-ROM to find the current surface air
temperature and dew-point temperature in your area.
Next, use the Moisture and Stability/Moisture Graph
activity to answer the following questions:
(a) What is the relative humidity?
(b) What is the maximum vapor pressure possible at
this temperature?
(c) How much vapor pressure actually exists at this
moment?
9. Use the Moisture and Stability/Moisture Graph activ-
ity on the Blue Skies CD-ROM to answer the follow-
ing question. If the present surface air temperature
rises 5°C without the addition of more water vapor
(that is, the dew-point temperature remains con-
stant), what will be the resulting relative humidity?
106 Chapter 4 Humidity, Condensation, and Clouds
10. Go to the Sky Identification/Name that Cloud section
on the Blue Skies CD-ROM. Identify the cloud types
presented.
11. Weather Image Gallery ( />Images/i2.html): Explore images of various cloud
types.
For additional readings, go to InfoTrac College
Edition, your online library, at:
Questions forThought and Exploration 107
Atmospheric Stability
Determining Stability
Stable Air
Unstable Air
Conditionally Unstable Air
Cloud Development and Stability
Convection and Clouds
Topography and Clouds
Precipitation Processes
Collision and Coalescence Process
Ice-Crystal Process
Cloud Seeding and Precipitation
Precipitation in Clouds
Focus on a Special Topic:
Does Cloud Seeding Enhance
Precipitation?
Precipitation Types
Rain
Focus on a Special Topic:
Are Raindrops Tear-Shaped?
Snow
Sleet and Freezing Rain
Focus on an Observation:
Aircraft Icing
Snow Grains and Snow Pellets
Hail
Measuring Precipitation
Instruments
Doppler Radar and Precipitation
Summary
Key Terms
Questions for Review
Questions for Thought and Exploration
Contents
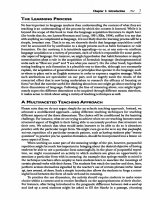
T
he weather is an ever-playing drama before which we
are a captive audience. With the lower atmosphere as
the stage, air and water as the principal characters, and clouds
for costumes, the weather’s acts are presented continuously some-
where about the globe. The script is written by the sun; the
production is directed by the earth’s rotation; and, just as no
theater scene is staged exactly the same way twice, each weather
episode is played a little differently, each is marked with a bit of
individuality.
Clyde Orr, Jr., Between Earth and Space
Cloud Development and Precipitation
109
C
louds, spectacular features in the sky, add beauty
and color to the natural landscape. Yet, clouds are
important for nonaesthetic reasons, too. As they form,
vast quantities of heat are released into the atmosphere.
Clouds help regulate the earth’s energy balance by re-
flecting and scattering solar radiation and by absorbing
the earth’s infrared energy. And, of course, without
clouds there would be no precipitation. But clouds are
also significant because they visually indicate the phys-
ical processes taking place in the atmosphere; to a
trained observer, they are signposts in the sky. In the be-
ginning of this chapter, we will look at the atmospheric
processes these signposts point to, the first of which is
atmospheric stability. Later, we will examine the differ-
ent mechanisms responsible for the formation of most
clouds. Toward the end of the chapter, we will peer into
the tiny world of cloud droplets to see how rain, snow,
and other types of precipitation form.
Atmospheric Stability
We know that most clouds form as air rises, expands,
and cools. But why does the air rise on some occasions
and not on others? And why does the size and shape of
clouds vary so much when the air does rise? To answer
these questions, let’s focus on the concept of atmos-
pheric stability.
When we speak of atmospheric stability, we are re-
ferring to a condition of equilibrium. For example, rock
A resting in the depression in Fig. 5.1 is in stable equi-
librium. If the rock is pushed up along either side of the
hill and then let go, it will quickly return to its original
position. On the other hand, rock B, resting on the top
of the hill, is in a state of unstable equilibrium, as a slight
push will set it moving away from its original position.
Applying these concepts to the atmosphere, we can see
that air is in stable equilibrium when, after being lifted
or lowered, it tends to return to its original position—it
resists upward and downward air motions. Air that is in
unstable equilibrium will, when given a little push,
move farther away from its original position—it favors
vertical air currents.
In order to explore the behavior of rising and sink-
ing air, we must first review some concepts we learned
in earlier chapters. Recall that a balloonlike blob of air is
called an air parcel. (The concept of air parcel is illus-
trated in Fig. 4.4, p. 79.) When an air parcel rises, it
moves into a region where the air pressure surrounding
it is lower. This situation allows the air molecules inside
to push outward on the parcel walls, expanding it. As
the air parcel expands, the air inside cools. If the same
parcel is brought back to the surface, the increasing
pressure around the parcel squeezes (compresses) it
back to its original volume, and the air inside warms.
Hence, a rising parcel of air expands and cools, while a
sinking parcel is compressed and warms.
If a parcel of air expands and cools, or compresses
and warms, with no interchange of heat with its outside
surroundings, this situation is called an adiabatic
process. As long as the air in the parcel is unsaturated
(the relative humidity is less than 100 percent), the rate
of adiabatic cooling or warming remains constant and is
about 10°C for every 1000 meters of change in eleva-
tion, or about 5.5°F for every 1000 feet. Since this rate of
cooling or warming only applies to unsaturated air, it is
called the dry adiabatic rate* (see Fig. 5.2).
As the rising air cools, its relative humidity in-
creases as the air temperature approaches the dew-point
temperature. If the air cools to its dew-point tempera-
ture, the relative humidity becomes 100 percent. Further
lifting results in condensation, a cloud forms, and latent
heat is released into the rising air. Because the heat added
during condensation offsets some of the cooling due to
expansion, the air no longer cools at the dry adiabatic
rate but at a lesser rate called the moist adiabatic rate.
(Because latent heat is added to the rising saturated air,
the process is not really adiabatic.†) If a saturated parcel
containing water droplets were to sink, it would com-
press and warm at the moist adiabatic rate because evap-
oration of the liquid droplets would offset the rate of
compressional warming. Hence, the rate at which rising
or sinking saturated air changes temperature—the moist
adiabatic rate—is less than the dry adiabatic rate.
110 Chapter 5 Cloud Development and Precipitation
Stable equilibrium
Unstable equilibrium
A
A
B
B
A
FIGURE 5.1
When rock A is disturbed, it will return to its original position;
rock B, however, will accelerate away from its original position.
*For aviation purposes, the dry adiabatic rate is sometimes expressed as 3°C
per 1000 ft.
†If condensed water or ice is removed from the rising saturated parcel, the
cooling process is called an irreversible pseudoadiabatic process.
Unlike the dry adiabatic rate, the moist adiabatic
rate is not constant, but varies greatly with temperature
and, hence, with moisture content—as warm saturated
air produces more liquid water than cold saturated air.
The added condensation in warm, saturated air liberates
more latent heat. Consequently, the moist adiabatic rate
is much less than the dry adiabatic rate when the rising
air is quite warm; however, the two rates are nearly the
same when the rising air is very cold. Although the moist
adiabatic rate does vary, to make the numbers easy to
deal with we will use an average of 6°C per 1000 m (3.3°F
per 1000 ft) in most of our examples and calculations.
Determining Stability
We determine the stability of the air by comparing the
temperature of a rising parcel to that of its surround-
ings. If the rising air is colder than its environment, it
will be more dense* (heavier) and tend to sink back to
its original level. In this case, the air is stable because it
resists upward displacement. If the rising air is warmer
and, therefore, less dense (lighter) than the surrounding
air, it will continue to rise until it reaches the same tem-
perature as its environment. This is an example of un-
stable air. To figure out the air’s stability, we need to
measure the temperature both of the rising air and of its
environment at various levels above the earth.
STABLE AIR Suppose we release a balloon-borne in-
strument—a radiosonde (see Fig. 1, p. 11)—and it sends
back temperature data as shown in Fig. 5.3. We measure
the air temperature in the vertical and find that it de-
creases by 4°C for every 1000 m. Remember from Chap-
ter 1 that the rate at which the air temperature changes
with elevation is called the lapse rate. Because this is the
rate at which the air temperature surrounding us would
be changing if we were to climb upward into the atmos-
phere, we refer to it as the environmental lapse rate.
Notice in Fig. 5.3a that (with an environmental lapse
rate of 4°C per 1000 m) a rising parcel of unsaturated,
“dry” air is colder and heavier than the air surrounding it
at all levels. Even if the parcel is initially saturated (Fig.
5.3b), as it rises it, too, would be colder than its environ-
ment at all levels. In both cases, the atmosphere is ab-
solutely stable because the lifted parcel of air is colder and
heavier than the air surrounding it. If released, the parcel
would have a tendency to return to its original position.
Determining Stability 111
2000
1000
0
Compresses
and
warms
Expands
and
cools
10°C
20°C
30°C
Air parcel
Altitude (m)
FIGURE 5.2
The dry adiabatic rate. As long as the air parcel remains unsatu-
rated, it expands and cools by 10°C per 1000 m; the sinking
parcel compresses and warms by 10°C per 1000 m.
*When, at the same level in the atmosphere, we compare parcels of air that
are equal in size but vary in temperature, we find that cold air parcels are
more dense than warm air parcels; that is, in the cold parcel, there are more
molecules that are crowded closer together.
2000
1000
0
Altitude (meters)
3000
Temperature
of lifted
unsaturated
air (°C )
(dry rate)
Environmental
lapse rate
4°C/1000 m
Temperature
of environment
(°C)
Temperature
of lifted
saturated
air (°C )
(moist rate)
Parcel
colder
TENDENCY
Parcel
colder
TENDENCY
Parcel
colder
TENDENCY
30°
20°
10°
0°
18°
12°
24°
30°
Parcel
colder
TENDENCY
Parcel
colder
TENDENCY
Parcel
colder
TENDENCY
(a) Unsaturated “dry”
air parcel is lifted.
(b) Saturated “moist”
air parcel is lifted.
18°
12° 4°
6° 2°
18°
22°
26°
30°
6°
FIGURE 5.3
A stable atmosphere. An absolutely stable atmosphere exists
when a rising air parcel is colder and heavier (i.e., more dense)
than the air surrounding it. If given the chance (i.e., released),
the air parcel in both situations would return to its original
position, the surface.
Since stable air strongly resists upward vertical
motion, it will, if forced to rise, tend to spread out hori-
zontally. If clouds form in this rising air, they, too, will
spread horizontally in relatively thin layers and usually
have flat tops and bases. We might expect to see
clouds— uch as cirrostratus, altostratus, nimbostratus,
or stratus—forming in stable air.
The atmosphere is stable when the environmental
lapse rate is small; that is, when there is a relatively small dif-
ference in temperature between the surface air and the air
aloft. Consequently, the atmosphere tends to become more
stable—it stabilizes—as the air aloft warms or the surface
air cools. The cooling of the surface air may be due to:
1. nighttime radiational cooling of the surface
2. an influx of cold air brought in by the wind
3. air moving over a cold surface
It should be apparent that, on any given day, the air is
generally most stable in the early morning around sun-
rise, when the lowest surface air temperature is recorded.
The air aloft may warm as winds bring in warmer
air or as the air slowly sinks over a large area. Recall that
sinking (subsiding) air warms as it is compressed. The
warming may produce an inversion, where the air aloft is
actually warmer than the air at the surface. An inversion
that forms by slow, sinking air is termed a subsidence in-
version. Because inversions represent a very stable atmo-
sphere, they act as a lid on vertical air motion. When an
inversion exists near the ground, stratus, fog, haze, and
pollutants are all kept close to the surface (see Fig. 5.4).
UNSTABLE AIR The atmosphere is unstable when the
air temperature decreases rapidly as we move up into
the atmosphere. For example, in Fig. 5.5, notice that the
measured air temperature decreases by 11°C for every
1000-meter rise in elevation, which means that the en-
112 Chapter 5 Cloud Development and Precipitation
FIGURE 5.4
Cold surface air, on this morning, produces a stable atmosphere that inhibits vertical
air motions and allows the fog and haze to linger close to the ground.
If you take a walk on a bitter cold, yet clear, winter
morning, when the air is calm and a strong subsidence
inversion exists, the air aloft—thousands of meters above
you—may be more than 17°C (30°F) warmer than the
air at the surface.
vironmental lapse rate is 11°C per 1000 meters. Also no-
tice that a lifted parcel of unsaturated “dry” air in Fig.
5.5a, as well as a lifted parcel of saturated “moist” air in
Fig. 5.5b, will, at each level above the surface, be warmer
than the air surrounding them. Since, in both cases, the
rising air is warmer and less dense than the air around
them, once the parcels start upward, they will continue
to rise on their own, away from the surface. Thus, we
have an absolutely unstable atmosphere.
The atmosphere becomes more unstable as the en-
vironmental lapse rate steepens; that is, as the tempera-
ture of the air drops rapidly with increasing height. This
circumstance may be brought on by either the air aloft
becoming colder or the surface air becoming warmer (see
Fig. 5.6). The warming of the surface air may be due to:
1. daytime solar heating of the surface
2. an influx of warm air brought in by the wind
3. air moving over a warm surface
Generally, then, as the surface air warms during the
day, the atmosphere becomes more unstable—it destabi-
lizes. The air aloft may cool as winds bring in colder air or as
the air (or clouds) emit infrared radiation to space (radia-
tional cooling). Just as sinking air produces warming and
a more stable atmosphere, rising air, especially an entire
layer where the top is dry and the bottom is humid, pro-
duces cooling and a more unstable atmosphere. The lifted
layer becomes more unstable as it rises and stretches out
vertically in the less dense air aloft. This stretching effect
Determining Stability 113
2000
1000
0
Altitude (meters)
3000
Temperature
of lifted
unsaturated
air (°C )
(dry rate)
Environmental
lapse rate
11°C/1000 m
-3°
8°
19°
30°
Temperature
of environment
(°C)
Temperature
of lifted
saturated
air (°C )
(moist rate)
Parcel
warmer
TENDENCY
Parcel
warmer
TENDENCY
Parcel
warmer
TENDENCY
30°
20°
10°
0°
18°
12°
24°
30°
Parcel
warmer
TENDENCY
Parcel
warmer
TENDENCY
Parcel
warmer
TENDENCY
(a) Unsaturated “dry”
air parcel is lifted.
(b) Saturated “moist”
air parcel is lifted.
3°
2°
1°
15°
10°
5°
FIGURE 5.5
An unstable atmosphere. An absolutely unstable atmosphere
exists when a rising air parcel is warmer and lighter (i.e., less
dense) than the air surrounding it. If given the chance (i.e.,
released), the lifted parcel in both (a) and (b) would continue
to move away (accelerate) from its original position.
FIGURE 5.6
Unstable air. The warmth from the forest fire heats the air,
causing instability near the surface. Warm, less-dense air (and
smoke) bubbles upward, expanding and cooling as it rises.
Eventually the rising air cools to its dew point, condensation
begins, and a cumulus cloud forms.
Nature can produce its own fire extinguisher. Forest fires
generate atmospheric instability by heating the air near
the surface. The hot, rising air above the fire contains
tons of tiny smoke particles that act as cloud
condensation nuclei. As the air rises and cools, water
vapor in the atmosphere as well as water vapor released
during the burning of the timber, will often condense
onto the nuclei, producing a cumuliform cloud,
sometimes called a pyrocumulus. If the cloud builds high
enough, and remains over the fire area, its heavy
showers may actually help to extinguish the fire.
steepens the environmental lapse rate as the top of the layer
cools more than the bottom. Instability brought on by the
lifting of air is often associated with the development of se-
vere weather, such as thunderstorms and tornadoes, which
are investigated more thoroughly in Chapter 10.
It should be noted, however, that deep layers in the
atmosphere are seldom, if ever, absolutely unstable. Ab-
solute instability is usually limited to a very shallow
layer near the ground on hot, sunny days. Here, the en-
vironmental lapse rate can exceed the dry adiabatic rate,
and the lapse rate is called superadiabatic.
CONDITIONALLY UNSTABLE AIR Suppose an unsatu-
rated (but humid) air parcel is somehow forced to rise
from the surface, as shown in Fig. 5.7. As the parcel
rises, it expands, and cools at the dry adiabatic rate un-
til its air temperature cools to its dew point. At this level,
the air is saturated, the relative humidity is 100 percent,
and further lifting results in condensation and the for-
mation of a cloud. The elevation above the surface
where the cloud first forms (in this example, 1000 me-
ters) is called the condensation level.
In Fig. 5.7, notice that above the condensation
level, the rising saturated air cools at the moist adiabatic
rate. Notice also that from the surface up to a level near
2000 meters, the rising, lifted air is colder than the air
surrounding it. The atmosphere up to this level is stable.
However, due to the release of latent heat, the rising air
near 2000 meters has actually become warmer than the
air around it. Since the lifted air can rise on its own ac-
cord, the atmosphere is now unstable. The level in the
atmosphere where the air parcel, after being lifted, be-
comes warmer than the air surrounding it, is called the
level of free convection.
The atmospheric layer from the surface up to 4000
meters in Fig. 5.7 has gone from stable to unstable be-
cause the rising air was humid enough to become satu-
rated, form a cloud, and release latent heat, which
warms the air. Had the cloud not formed, the rising air
would have remained colder at each level than the air
surrounding it. From the surface to 4000 meters, we
have what is said to be a conditionally unstable atmos-
phere—the condition for instability being whether or
not the rising air becomes saturated. Therefore, condi-
tional instability means that, if unsaturated stable air is
somehow lifted to a level where it becomes saturated,
instability may result.
In Fig. 5.7, we can see that the environmental lapse
rate is 9°C per 1000 meters. This value is between the
dry adiabatic rate (10°C/1000 m) and the moist adia-
batic rate (6°C/1000 m). Consequently, conditional in-
stability exists whenever the environmental lapse rate is
between the dry and moist adiabatic rates. Recall from
Chapter 1 that the average lapse rate in the troposphere
114 Chapter 5 Cloud Development and Precipitation
Temperature
of environment
(°C)
2000
1000
0
Altitude (meters)
3000
Environmental
lapse rate
9°C/1000 m
3°
12°
21°
30°
14°
8°
20°
30°
Condensation
level
(cloud base)
Moist rate
(6°C/1000 m)
Dry rate
(10°C/1000 m)
2°
–6°
Unstable
air
Stable
air
Rising air
is now
warmer
than its
surroundings
and rises on
its own
Temperature
of rising air
(°C)
Rising air
warmer
Rising air
warmer
Rising air
warmer
Rising air
colder
4000
8°
5°
2°
1°
FIGURE 5.7
Conditionally unstable
air. The atmosphere is
conditionally unstable
when unsaturated, stable
air is lifted to a level
where it becomes
saturated and warmer
than the air surrounding
it. If the atmosphere
remains unstable, vertical
developing cumulus
clouds can build to great
heights.
is about 6.5°C per 1000 m (3.6°F per 1000 ft). Since this
value lies between the dry adiabatic rate and the average
moist rate, the atmosphere is ordinarily in a state of con-
ditional instability.
At this point, it should be apparent that the stabil-
ity of the atmosphere changes during the course of a
day. In clear, calm weather around sunrise, surface air is
normally colder than the air above it, a radiation inver-
sion exists, and the atmosphere is quite stable, as indi-
cated by smoke or haze lingering close to the ground. As
the day progresses, sunlight warms the surface and the
surface warms the air above. As the air temperature near
the ground increases, the lower atmosphere gradually
becomes more unstable, with maximum instability usu-
ally occurring during the hottest part of the day. On a
humid summer afternoon this phenomenon can be
witnessed by the development of cumulus clouds.
Brief Review
Up to this point we have looked briefly at stability as it
relates to cloud development. The next section de-
scribes how atmospheric stability influences the physi-
cal mechanisms responsible for the development of in-
dividual cloud types. However, before going on, here is
a brief review of some of the facts and concepts con-
cerning stability:
■ The air temperature in a rising parcel of unsaturated
air decreases at the dry adiabatic rate, whereas the air
temperature in a rising parcel of saturated air de-
creases at the moist adiabatic rate.
■ The dry adiabatic rate and moist adiabatic rate of
cooling are different due to the fact that latent heat is
released in a rising parcel of saturated air.
■ In a stable atmosphere, a lifted parcel of air will be
colder (heavier) than the air surrounding it. Because
of this fact, the lifted parcel will tend to sink back to
its original position.
■ In an unstable atmosphere, a lifted parcel of air will be
warmer (lighter) than the air surrounding it, and thus
will continue to rise upward, away from its original
position.
■ The atmosphere becomes more stable (stabilizes) as
the surface air cools, the air aloft warms, or a layer of
air sinks (subsides) over a vast area.
■ The atmosphere becomes more unstable (destabi-
lizes) as the surface air warms, the air aloft cools, or a
layer of air is lifted.
■ Layered clouds tend to form in a stable atmosphere,
whereas cumuliform clouds tend to form in a condi-
tionally unstable atmosphere.
Cloud Development and Stability
Most clouds form as air rises, expands, and cools. Basi-
cally, the following mechanisms are responsible for the
development of the majority of clouds we observe:
1. surface heating and free convection
2. topography
3. widespread ascent due to the flowing together (con-
vergence) of surface air
4. uplift along weather fronts (see Fig. 5.8)
CONVECTION AND CLOUDS Some areas of the earth’s
surface are better absorbers of sunlight than others and,
therefore, heat up more quickly. The air in contact with
these “hot spots” becomes warmer than its surround-
ings. A hot “bubble” of air—a thermal—breaks away
from the warm surface and rises, expanding and cooling
as it ascends. As the thermal rises, it mixes with the
cooler, drier air around it and gradually loses its iden-
tity. Its upward movement now slows. Frequently, be-
fore it is completely diluted, subsequent rising thermals
penetrate it and help the air rise a little higher. If the ris-
ing air cools to its saturation point, the moisture will
condense, and the thermal becomes visible to us as a cu-
mulus cloud.
Observe in Fig. 5.9 that the air motions are down-
ward on the outside of the cumulus cloud. The down-
ward motions are caused in part by evaporation around
the outer edge of the cloud, which cools the air, making
it heavy. Another reason for the downward motion is
the completion of the convection current started by the
thermal. Cool air slowly descends to replace the rising
warm air. Therefore, we have rising air in the cloud and
sinking air around it. Since subsiding air greatly inhibits
the growth of thermals beneath it, small cumulus
clouds usually have a great deal of blue sky between
them (see Fig. 5.10).
As the cumulus clouds grow, they shade the
ground from the sun. This, of course, cuts off surface
heating and upward convection. Without the continual
supply of rising air, the cloud begins to erode as
its droplets evaporate. Unlike the sharp outline of a
growing cumulus, the cloud now has indistinct edges,
with cloud fragments extending from its sides. As the
cloud dissipates (or moves along with the wind), surface
Cloud Development and Stability 115
heating begins again and regenerates another thermal,
which becomes a new cumulus. This is why you often
see cumulus clouds form, gradually disappear, then re-
form in the same spot.
The stability of the atmosphere plays an important
part in determining the vertical growth of cumulus
clouds. For example, if a stable layer (such as an inver-
sion) exists near the top of the cumulus cloud, the cloud
would have a difficult time rising much higher, and it
would remain as a “fair-weather” cumulus cloud. How-
ever, if a deep, conditionally unstable layer exists above
the cloud, then the cloud may develop vertically into a
116 Chapter 5 Cloud Development and Precipitation
5 km
Convection
(a)
150 km
Topography
(b)
500 km
Convergence of air
(c)
Low
pressure
Warm
air
1500 km
Lifting along weather fronts
(d)
Cold
air
Cold
air
FIGURE 5.8
The primary ways clouds form:
(a) surface heating and convection;
(b) forced lifting along topographic
barriers; (c) convergence of surface
air; (d) forced lifting along weather
fronts.
Condensation level
FIGURE 5.9
Cumulus clouds form as hot, invisible air
bubbles detach themselves from the
surface, then rise and cool to the conden-
sation level. Below and within the cumu-
lus clouds, the air is rising. Around the
cloud, the air is sinking.
towering cumulus congestus with a cauliflowerlike top.
When the unstable air is several miles deep, the cumulus
congestus may even develop into a cumulonimbus (see
Fig. 5.11).
Notice in Fig. 5.11 that the distant thunderstorm
has a flat anvil-shaped top. The reason for this shape is
due to the fact that the cloud has reached the stable part
of the atmosphere, and the rising air is unable to punc-
ture very far into this stable layer. Consequently, the top
of the cloud spreads laterally as high winds at this alti-
tude (usually above 10,000 m or 33,000 ft) blow the
cloud’s ice crystals horizontally.
TOPOGRAPHY AND CLOUDS Horizontally moving air
obviously cannot go through a large obstacle, such as a
mountain, so the air must go over it. Forced lifting along
a topographic barrier is called orographic uplift. Often,
large masses of air rise when they approach a long chain
of mountains such as the Sierra Nevada and Rockies.
This lifting produces cooling, and if the air is humid,
Cloud Development and Stability 117
FIGURE 5.10
Cumulus clouds building on a
warm summer afternoon. Each
cloud represents a region where
thermals are rising from the
surface. The clear areas between
the clouds are regions where the
air is sinking.
FIGURE 5.11
Cumulus clouds developing into
thunderstorms in a conditionally
unstable atmosphere over the Great
Plains. Notice that, in the distance, the
cumulonimbus with the anvil top has
reached the stable part of the
atmosphere.
clouds form. Clouds produced in this manner are called
orographic clouds.
An example of orographic uplift and cloud devel-
opment is given in Fig. 5.12. Notice that, after having
risen over the mountain, the air at the surface on the lee-
ward (downwind) side is considerably warmer than it
was at the surface on the windward (upwind) side. The
higher air temperature on the leeward side is the result of
latent heat being converted into sensible heat during
condensation on the windward side. In fact, the rising air
at the top of the mountain is considerably warmer than
it would have been had condensation not occurred.
Notice also in Fig. 5.12 that the dew-point temper-
ature of the air on the leeward side is lower than it was
before the air was lifted over the mountain. The lower
dew point and, hence, drier air on the leeward side is the
result of water vapor condensing and then remaining as
liquid cloud droplets and precipitation on the wind-
ward side. This region on the leeward side of a moun-
tain, where precipitation is noticeably low, and the air is
often drier, is called a rain shadow.
Although clouds are more prevalent on the wind-
ward side of mountains, they may, under certain atmos-
pheric conditions, form on the leeward side as well. For
example, stable air flowing over a mountain often moves
in a series of waves that may extend for several hundred
miles on the leeward side. Such waves often resemble the
waves that form in a river downstream from a large boul-
der. Recall from Chapter 4 that wave clouds often have a
characteristic lens shape and are called lenticular clouds.
The formation of lenticular clouds is shown in Fig.
5.13. As moist air rises on the upwind side of the wave,
it cools and condenses, producing a cloud. On the
downwind side, the air sinks and warms—the cloud
evaporates. Viewed from the ground, the clouds appear
motionless as the air rushes through them. When the air
between the cloud-forming layers is too dry to produce
clouds, lenticular clouds will form one above the other,
sometimes extending into the stratosphere and appear-
ing as a fleet of hovering spacecraft. Lenticular clouds
that form in the wave directly over the mountain are
called mountain wave clouds (see Fig. 5.14).
Notice in Fig. 5.13 that beneath the lenticular
cloud, a large swirling eddy forms. The rising part of the
eddy may cool enough to produce rotor clouds. The air
in the rotor is extremely turbulent and presents a major
hazard to aircraft in the vicinity. Dangerous flying con-
ditions also exist near the lee side of the mountain,
where strong downward air motions are present.
Now, having examined the concept of stability and
the formation of clouds, we are ready to see how mi-
nute cloud particles are transformed into rain and
snow. The next section, therefore, takes a look at the
processes that produce precipitation.
118 Chapter 5 Cloud Development and Precipitation
The first modern “sighting” of a flying saucer was made
over Mt. Rainier, Washington, a region where lenticular
clouds commonly form.
d
d
d
d
d
d
d
Air
temperature
(
T
)
Dew-point
temperature
(
T
)
3000
2000
1000
20°C
12°C
Windward side
Leeward side
Rain shadow
Warm,
dry
28°C
4°
C
(
T
) (
T
)
Altitude (m)
T
= 10°C =
T
T
= 4°C =
T
T
= –2°C =
T
T
= 8°C
T
= 0
°C
T
= 18°C
T
= 2°C
–4°C
4°C
12°C
Environmental
temperature
FIGURE 5.12
Orographic uplift, cloud
development, and the
formation of a rain shadow.