mcts training kit 70 - 685 Windows 7 Enterprise Desktop Support Technician phần 6 docx
Bạn đang xem bản rút gọn của tài liệu. Xem và tải ngay bản đầy đủ của tài liệu tại đây (1003.01 KB, 68 trang )
316 CHAPTER 8 Performance
Task Manager has six tabs:
■
Applications A list of applications open by the current user. You can close an
application by clicking it and then clicking End Task. If the Start menu is not working,
you can start a new application by clicking New Task. If the Windows Explorer interface
is not open, you can click New Task and then run Windows Explorer to open it.
■
Processes A list of processes open by the current user. You can view processes open
by all users by clicking Show Processes From All Users. You can quickly identify the
process that is using the most processor time by clicking the CPU column header to
sort the processes by processor utilization. To end a process, select the process and
then click End Process. Ending a process is particularly useful when a non-responsive
application is consuming all the processor time and slowing the computer down.
■
Services Lists all the services on the computer, running or stopped. You can start and
stop services by right-clicking the service. This tab provides similar functionality to the
Services console, but with the convenience of Task Manager.
■
Performance Shows current processor and memory utilization. If a computer seems
slow, open the Performance tab to determine whether processor or memory utilization
is causing the problem. If processor utilization is causing the problem, one or more of
the processors in the CPU Usage History chart will be at 100%, as the fi rst processor
is in Figure 8-5. If memory utilization is causing the problem, the value shown in the
Memory chart will be close to the Total value shown in the Physical Memory group.
FIGURE 8-5 Task Manager shows processor and memory utilization.
■
Networking Charts the network utilization of each network interface. Use this tab
to determine whether a slow network might be caused by an application using all
the available bandwidth. Wired network connections typically do not support more
than 70% utilization; therefore, a wired network at 65% utilization can be considered
C08627093.indd 316C08627093.indd 316 2/18/2010 12:37:12 PM2/18/2010 12:37:12 PM
Lesson 2: Troubleshooting Performance Problems CHAPTER 8 317
completely saturated. Available bandwidth for wireless network connections varies, but
is typically around 35% as shown by the charts on the Networking tab.
■
Users Lists the users currently logged on to the computer.
The sections that follow discuss how to perform different tasks with Task Manager.
How Windows Shares Processor Time Between Applications
To understand how to troubleshoot performance, you must know how applications,
processes, and threads relate. An application or service typically has a single process
associated with it, though some applications or services might start multiple processes.
Processes run within threads. Every application has at least one thread, and it might start
multiple threads. Some applications might use hundreds of threads.
A processor (or processor core) can only run one thread at a time. A computer with
one processor can still run multiple applications, however, because Windows switches the
processor between different processes and threads. Higher-priority threads receive more
processor time than lower-priority threads.
Today, most new computers have processors with multiple cores. Each processor core
functions like a separate processor. If you view the Performance tab of Task Manager, the
CPU Usage graph shows the total utilization across all processors, and the CPU Usage History
graph shows a separate graph for each processor core. If you see only one graph in the CPU
Usage History box, click the View menu, click CPU History, and then click One Graph Per CPU.
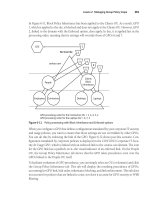
One of the most important tasks Windows performs is distributing processor time. With
multiple applications running, many having multiple threads, and multiple processor cores,
the task of distributing processor time can be very complicated. Fortunately, as Figure 8-6
illustrates, Windows handles it automatically, and you rarely need to adjust the default settings.
Thread 1
Application 1
Thread 2
Thread 3
Application 2
Processor core #1
Thread 3
Thread 2
Thread 2
Thread 1
Thread 2
Thread 1
Processor core #2
Thread 2
Thread 1
Thread 2
Thread 3
Thread 1
Thread 2
FIGURE 8-6 Windows assigns threads processor time.
There are some circumstances that might require you to control processes manually:
■
A single process is using too much processor time, slowing down other processes.
■
Applications are utilizing the processor fully, and you want one application to receive
more or less processor time than other applications.
■
An application is not responding, and you want to end the application’s processes
forcibly.
C08627093.indd 317C08627093.indd 317 2/18/2010 12:37:13 PM2/18/2010 12:37:13 PM
318 CHAPTER 8 Performance
The sections that follow show you how to accomplish each of these.
How to Identify Which Program Is Using the Most Processor Time
You can use Task Manager to identify a process that is using excessive processor time.
Optionally, you can end the process forcibly by performing these steps:
1. Start Task Manager.
2. On the Processes tab, click the CPU column heading.
3. The process consuming the most processor time is shown at the top of the list.
4. With the busiest process identifi ed, you can change the priority of the process (which
might improve the performance of other applications), end the process, or limit the
process to specifi c processor cores by performing either of the following:
■
To change the priority of the process, right-click the process, select Set Priority, and
then click the desired priority. Lower-priority processes receive less processor time,
whereas higher-priority processes receive more processor time. Most processes run
with Normal priority. Task Manager is a notable exception; it runs at High priority
by default so that you can use it if another application is consuming signifi cant
amounts of processor time. Avoid giving any process Realtime priority, because it
might slow the user interface.
■
By default, Windows can assign a process to run on any processor core. To limit the
process to specifi c processor cores on a computer with multiple cores,
right-click the process and then click Set Affi nity. Figure 8-7 shows the Processor
Affi nity dialog box, which allows you to select which processor cores a process can
use. Figure 8-7 shows Iexplore.exe (the Internet Explorer process) limited to two out
of four processor cores, ensuring Internet Explorer never uses more than half the
total processor time. Closing and restarting a process resets the processor affi nity.
FIGURE 8-7 The Processor Affinity dialog box allows you
to limit the processor cores on which a process can run.
C08627093.indd 318C08627093.indd 318 2/18/2010 12:37:13 PM2/18/2010 12:37:13 PM
Lesson 2: Troubleshooting Performance Problems CHAPTER 8 319
■
To end the process, right-click the process and then click End Process. Alternatively,
you can click End Process Tree to end any processes that process started.
How to Stop a Program
Occasionally, a program might not respond. Typically, you can right-click the application
on the task bar and then click Close Window. In a few seconds, Windows prompts you to
terminate the nonresponsive application.
If that approach does not work, you can use Task Manager to close an application as
follows:
1. In Task Manager, on the Applications tab, select the application.
2. Click End Task.
3. If Task Manager cannot end the application, the End Program dialog box appears.
Click End Now.
If you want to identify which process is associated with an application, right-click the
application on the Applications tab, and then click Go To Process.
Performance Monitor
Like earlier versions of Windows, the Performance Monitor snap-in graphically displays
real-time data, as shown in Figure 8-8.
FIGURE 8-8 How Performance Monitor shows real-time data
The sections that follow describe how to monitor real-time data, how to confi gure the
Performance Monitor chart, and how to compare multiple graphs.
C08627093.indd 319C08627093.indd 319 2/18/2010 12:37:13 PM2/18/2010 12:37:13 PM
320 CHAPTER 8 Performance
How to Monitor Real-Time Performance Data
To open Performance Monitor, follow these steps:
1. Click Start, right-click Computer, and then click Manage.
2. Expand System Tools, expand Performance, and then expand Monitoring Tools. Select
Performance Monitor.
3. Add counters to the real-time graph by clicking the green plus button on the toolbar.
You can also display data from other computers on the network.
Each line on the graph appears in a different color. To make it easier to view a specifi c
graph, select a counter and press Ctrl+H. The selected counter appears bold and in black on
the graph.
Performance Monitor automatically assigns line colors and styles to the counters you
select. To confi gure line colors and styles manually, follow these steps:
1. Click the Action menu, and then click Properties.
The Performance Monitor Properties dialog box appears.
2. Click the Data tab.
3. In the Counters list, select the counter you want to confi gure. Then, adjust the Color,
Width, and Style settings.
4. To increase the height of the graph for a counter, click the Scale list and click a higher
number. To decrease the height of a graph, click the Scale list and click a lower number.
5. You can also adjust the scale for all counters by clicking the Graph tab and changing
the Maximum and Minimum values in the Vertical Scale group. Click OK.
If you keep multiple Performance Monitor windows open simultaneously, you can make it
easier to quickly distinguish between the windows by changing the background color on the
chart using the Appearance tab in the Performance Monitor Properties dialog box.
How to Control How Much Data Appears in the Graph
By default, Performance Monitor updates the graphs once per second and displays
100 seconds of data. To display data over a longer period of time, you can increase the
sampling interval or increase the amount of data displayed on the graph at once. To adjust
these settings, follow these steps in Performance Monitor:
1. Click the Action menu, and then click Properties.
The Performance Monitor Properties dialog box appears.
2. In the General tab, in the Graph Elements group, adjust the Sample Every box to
change how frequently the graph updates. Use a longer interval (such as fi ve seconds)
to show a smoother, less jagged graph that is updated less frequently. If you are
connecting to a computer across a network, longer intervals reduce bandwidth usage.
C08627093.indd 320C08627093.indd 320 2/18/2010 12:37:13 PM2/18/2010 12:37:13 PM
Lesson 2: Troubleshooting Performance Problems CHAPTER 8 321
3. Adjust the Duration box to change how much data is displayed in the graph before
Performance Monitor begins overwriting the graph on the left portion of the chart.
To display one full hour of data in the graph, set the duration to 3,600. To display one
full day of data in the graph, set the duration to 86,400. If you increase the Duration
box, you should also increase the Sample Every box. Click OK.
By default, Performance Monitor begins overwriting graphed data on the left portion of
the chart after the specifi ed duration has been reached. When graphing data over a long
period of time, it’s typically easier to see the chart scroll from right to left, similar to the
way Task Manager shows data. To confi gure the Performance Monitor graph to scroll data,
perform these steps:
1. Click the Action menu, and then click Properties.
The Performance Monitor Properties dialog box appears.
2. Click the Graph tab. In the Scroll Style group, select Scroll. Click OK.
Although the line chart shows the most information, you can select from the following
chart types by clicking the Change Graph Type button on the toolbar or by pressing Ctrl+G:
■
Line The default setting, this shows values over time as lines on the chart.
■
Histogram bar This shows a bar graph with the most recent values for each counter
displayed. If you have a large number of values and you’re primarily interested in the
current value (rather than the value of each counter over time), this will be easier to
read than the line chart.
■
Report This text report lists each current value.
Data Collector Sets and Reports
Previous versions of Windows enabled you to log performance counter data and view it later.
Windows Vista and Windows 7 greatly expand this capability. Now you can create a data
collector set to log the following types of information:
■
Performance counters and alerts (just like in previous versions of Windows)
■
Event trace data showing detailed debugging information
■
Registry settings showing system and application confi guration
After running a data collector set, you can view the performance counters in Performance
Monitor and you can view a summary of the other collected information in a report.
The sections that follow describe how to create data collector sets and how to use reports.
C08627093.indd 321C08627093.indd 321 2/18/2010 12:37:13 PM2/18/2010 12:37:13 PM
322 CHAPTER 8 Performance
Built-in Data Collector Sets
Windows 7 includes several built-in data collector sets located at Performance\Data Collector
Sets\System:
■
System Performance Logs processor, disk, memory, and network performance
counters and kernel tracing. Use this data collector set when troubleshooting a slow
computer or intermittent performance problems.
■
System Diagnostics Logs all the information included in the System Performance
data collector set, plus detailed system information. Use this data collector set when
troubleshooting reliability problems such as problematic hardware, driver failures,
or Stop errors. As shown in Figure 8-9, the report generated by the data collector set
provides a summary of error conditions on the system without requiring you to browse
Event Viewer and Device Manager manually.
FIGURE 8-9 The System Diagnostics Report
To use a data collector set, right-click it, and then click Start. The System Performance data
collector set stops automatically after a minute, and the System Diagnostics data collector set
stops automatically after 10 minutes. To stop a data collector set manually, right-click it, and
then click Stop.
C08627093.indd 322C08627093.indd 322 2/18/2010 12:37:13 PM2/18/2010 12:37:13 PM
Lesson 2: Troubleshooting Performance Problems CHAPTER 8 323
After running a data collector set, you can view a summary of the data gathered in the
Performance\Reports node. To view the most recent report for a data collector set, right-click
the data collector set, and then click Latest Report. Reports are named automatically using
the format <Computer_Name>_yyyymmdd-######.
To minimize the performance impact of data logging, log the least amount of information
required. For example, you should use System Performance instead of System Diagnostics
whenever possible because System Performance includes fewer counters.
When a problem is diffi cult to reproduce and is not performance-related, you should err
on the side of logging too much data to minimize the chance that you will miss important
information.
How to Create a Data Collector Set Using a Standard Template
You can save performance data to a log and then view and analyze the data in Performance
Monitor at any time. It’s important to create a baseline by logging performance data before
making changes that you think might have a performance impact. After making the changes,
you can compare new performance data to the original performance data to determine
whether your changes were benefi cial. If you don’t have a baseline available when a problem
appears, you can create one using a different computer with a similar confi guration that does
not have the problem.
To save performance data, follow these steps:
1. Under Performance, expand Data Collector Sets.
2. Right-click User Defi ned, click New, and then click Data Collector Set.
The Create New Data Collector Set Wizard appears.
3. On the How Would You Like To Create This New Data Collector Set? page, type a name
for the set. Make sure Create From A Template is selected. Then, click Next.
4. On the Which Template Would You Like To Use? page, choose from one of the three
standard templates (or Browse to select a custom template) and click Next:
■
Basic Logs all Processor performance counters, stores a copy of the HKLM\
Software\Microsoft\Windows NT\CurrentVersion registry key, and performs
a Windows Kernel Trace.
■
System Diagnostics Logs 13 useful performance counters (including processor,
disk, memory, and network counters), stores a copy of dozens of important
confi guration settings, and performs a Windows Kernel Trace. By default, System
Diagnostics logs data for one minute, giving you a snapshot of the computer’s status.
■
System Performance Logs 14 useful performance counters (including the same
counters logged by the System Diagnostics template) and performs a Windows
Kernel Trace. System Performance logs data for one minute.
5. On the Where Would You Like The Data To Be Saved? page, click Next to accept the
default location for the data (%Systemdrive%\Perfl ogs\Admin).
C08627093.indd 323C08627093.indd 323 2/18/2010 12:37:13 PM2/18/2010 12:37:13 PM
324 CHAPTER 8 Performance
6. On the Create The Data Collector Set page, leave Run As set to <Default> to run it
using the current user’s credentials, or click Change to specify other administrative
credentials. Select one of three options before clicking Finish:
■
Open Properties For This Data Collector Set Immediately customize the Data
Collector Set.
■
Start This Data Collector Set Now Immediately begin logging data without
customizing the Data Collector Set.
■
Save And Close Close the Data Collector Set without starting it. You can edit the
properties and start it at any time after saving it.
Custom data collector sets are always available under the User Defi ned node within Data
Collector Sets.
How to Create a Custom Data Collector Set
After creating a new data collector set, you can modify it to log additional data sources by
right-clicking the data collector set, clicking New, and then clicking Data Collector to open
the Create New Data Collector wizard. On the What Type Of Data Collector Would You Like
To Create? page, type a name for the data collector, select the type, and then click Next.
You can choose from the following types of data collectors (each of which provides
different options in the Create New Data Collector wizard):
■
Performance Counter Data Collector Logs data for any performance counter
available when using the Performance Monitor console. You can add as many counters
as you like to a data collector. You can assign a sample interval (15 seconds, by default)
to the data collector.
■
Event Trace Data Collector Stores events from an event trace provider that match
a particular fi lter. Windows 7 provides dozens of event trace providers that are
capable of logging even the most minute aspects of the computer’s behavior. For best
results, simply add all event trace providers that might relate to the problem you are
troubleshooting. If the data collector logs a large amount of unnecessary data, you can
use the provider properties to fi lter which trace events are stored.
■
Confi guration Data Collector Stores a copy of specifi c registry keys, management
paths, fi les, or the system state. If you are troubleshooting application problems
or if you need to be aware of application settings, add the registry keys using
a confi guration data collector. To add a management path, fi le, or system state, create
the data collector without specifying a registry key using the wizard. Then, view the
new data collector properties, and select the Management Paths, File Capture, or State
Capture tab.
■
Performance Counter Alert Generates an alert when a performance counter is above
or below a specifi ed threshold.
You can add as many data collectors to a data collector set as required.
C08627093.indd 324C08627093.indd 324 2/18/2010 12:37:14 PM2/18/2010 12:37:14 PM
Lesson 2: Troubleshooting Performance Problems CHAPTER 8 325
How to Save Performance Data
After creating a data collector set, you can gather the data specifi ed in the Data Collector
Set by right-clicking it and clicking Start. Depending on the settings confi gured in the Stop
Condition tab of the data collector set’s Properties dialog box, the logging might stop after
a set amount of time or it might continue indefi nitely. If it does not stop automatically, you
can manually stop it by right-clicking it and clicking Stop.
How to View Saved Performance Data in a Report
After using a data collector set to gather information and then stopping the data collector
set, you can view the gathered information. To view a summary of the data saved using
a data collector set, right-click the data collector set and then click Latest Report. The console
expands the Reports node and selects the report generated when the data collector set ran.
You can expand each section to fi nd more detailed information.
If the data collector set included performance counters, you can also view them using the
Performance Monitor snap-in by following these steps:
1. Under Performance, expand Monitoring Tools, and then select Performance Monitor.
2. Click the Action menu, and then click Properties. In the Performance Monitor
Properties dialog box, click the Source tab. You can also click the View Log Data button
on the toolbar or press Ctrl+L.
3. Under Data Source, select Log Files. Then, click Add. By default, Windows 7 stores data
collector set data in the C:\Perfl ogs\ folder. Browse to select the data collector set data
(the folder corresponds to the report name), and then click Open.
4. If you want, click Time Range and narrow the range of data you want to analyze.
5. Click OK.
6. In Performance Monitor, click the green Add button on the toolbar and add counters
to the chart. Because you specifi ed a data source, you can add only counters that were
logged.
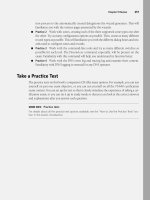
7. Performance Monitor shows the logged data instead of real-time data. To narrow the
time range shown, click and drag your cursor over the graph to select a time range.
Then, right-click the graph and click Zoom To, as shown in Figure 8-10.
8. The horizontal bar beneath the graph illustrates the currently selected time range.
Drag the left and right sides of the bar to expand the selected time range. Then,
right-click the graph and click Zoom To again to change the selection.
C08627093.indd 325C08627093.indd 325 2/18/2010 12:37:14 PM2/18/2010 12:37:14 PM
326 CHAPTER 8 Performance
FIGURE 8-10 Using the Zoom To feature to analyze a narrow time span
Troubleshooting Disk Performance Problems
For many common tasks on a computer, the hard disk limits overall performance. Opening
and saving fi les requires reading from and writing to the hard disk, which is much slower than
accessing system RAM. In addition, if Windows needs to allocate more memory than it has
physical RAM available, Windows uses the hard disk as virtual memory, reducing performance
for any task that requires the memory stored on the hard disk.
Fortunately, there are several things you can do to improve performance without
upgrading to a faster hard disk. The sections that follow discuss fragmentation and virtual
memory.
Fragmentation and Free Space
To reduce fragmentation, increase the amount of free disk space. When a disk begins to
run out of space, Windows needs to divide fi les into several different fragments, a process
known as fragmentation. Because hard disks perform best when a fi le is not fragmented,
fragmentation slows disk performance. As a general rule, you should keep at least 15 percent
of a disk’s space free, but having more free disk space can further improve performance.
C08627093.indd 326C08627093.indd 326 2/18/2010 12:37:14 PM2/18/2010 12:37:14 PM
Lesson 2: Troubleshooting Performance Problems CHAPTER 8 327
NOTE
FRAGMENTATION AND FLASH DRIVES
Traditional, magnetic hard disks have a drive head that must move across several spinning
round platters to read data, much like a record player. These drives perform best when
reading and writing sequentially, which does not require the drive head to move to
a different part of the disk. To read a fragmented fi le, the drive head must move several
times, slowing performance.
Flash drives do not have a drive head, and fragmentation does not reduce their
performance. Therefore, you never have to worry about fragmentation with a fl ash drive.
Windows 7 automatically disables defragmentation for fl ash drives.
You can use the Windows 7 Disk Cleanup tool to free up disk space automatically by
following these steps:
1. Click Start, and then click Computer.
2. Right-click the drive you want to clean, and then click Properties.
3. On the General tab, click Disk Cleanup.
4. To remove system fi les (a task that requires administrative privileges), click Clean Up
System Files.
5. Select the fi les that you want to delete. You can click each fi le type for a description of
the fi les that will be removed. Click OK.
The Disk Cleanup tool removes the fi les you specifi ed.
Windows 7 automatically defragments your fi les, so you should never need to defragment
manually. If you would like to defragment fi les manually, perform these steps:
1. Click Start, and then click Computer.
2. Right-click the drive you want to defragment, and then click Properties.
3. On the Tools tab, click Defragment Now.
4. To confi gure the defragmentation schedule, click Confi gure Schedule.
5. In the Disk Defragmenter tool, select the disk you want to defragment, and then click
Defragment Disk.
The Disk Defragmenter begins defragmenting the drive. You don’t have to wait for it to
complete before closing the window, however.
6. Click Close, and then click OK.
Virtual Memory
Depending on the disk confi guration, you can maximize the performance of virtual memory
by storing virtual memory on a different physical hard disk from other fi les. For example, if
a computer has a separate C: and D: drive, Windows by default uses the C: drive for virtual
memory. By moving the virtual memory to the D: drive, Windows might be able to read and
write fi les stored on the C: drive at the same time it accesses virtual memory.
N
OT
E
FRAGMENTATION AND FLASH DRIVES
E
Traditional, m
ag
netic hard disks have a drive head that must move across several s
pi
nnin
g
round platters to read data, much like a record player. These drives per
f
orm best when
readin
g
and writin
g
sequentiall
y
, which does not require the drive head to move to
a
di
ff
erent part o
f
the disk. To read a
f
ragmented
fi
le, the drive head must move several
times, slowin
g
per
f
ormance
.
Flash drives do not have a drive head, and
f
ragmentation does not reduce their
performance. Therefore,
y
ou never have to worr
y
about fra
g
mentation with a fl ash drive.
W
indows 7 automatically disables de
f
ragmentation
f
or
fl
ash drive
s.
C08627093.indd 327C08627093.indd 327 2/18/2010 12:37:14 PM2/18/2010 12:37:14 PM
328 CHAPTER 8 Performance
NOTE
STORING VIRTUAL MEMORY ON A SEPARATE DISK
Although you can achieve performance benefi ts by storing virtual memory on a separate
hard disk, you will not see any benefi ts by storing virtual memory on a different volume
or partition of a single hard disk. For best performance with multiple disks, confi gure the
disks in a redundant array of independent disks (RAID) array, and store all data on that
RAID array.
To confi gure which disk Windows stores virtual memory on, perform these steps:
1. Click Start, right-click Computer, and then click Properties.
2. Click Advanced System Settings.
3. On the Advanced tab of the System Properties dialog box, click Settings in the
Performance group.
4. On the Advanced tab of the Performance Options dialog box, click Change.
5. Clear the Automatically Manage Paging File Size For All Drives check box.
6. Select the drive that you want to use to store virtual memory (also known as a paging
fi le). Click System Managed Size, and then click OK.
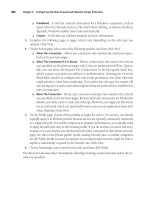
7. Select the system drive which currently has the paging fi le assigned to it. Click No
Paging File, and then click Set. Figure 8-11 shows a computer that has had virtual
memory assigned to the G: drive and removed from the default C: drive. Click Yes
when prompted.
FIGURE 8-11 Configuring virtual memory storage
8. Click OK four times, and then click Restart Now to restart your computer.
NOT
E
STORING VIRTUAL MEMORY ON A SEPARATE DISK
E
A
lthough you can achieve performance benefi ts by storing virtual memory on a separat
e
h
ard disk, you will not see any bene
fi
ts by storing virtual memory on a di
ff
erent volume
o
r partition of a sin
g
le hard disk. For best performance with multiple disks, confi
g
ure th
e
d
isks in a redundant array o
f
independent disks (RAID) array, and store all data on that
R
AID arra
y.
C08627093.indd 328C08627093.indd 328 2/18/2010 12:37:15 PM2/18/2010 12:37:15 PM
Lesson 2: Troubleshooting Performance Problems CHAPTER 8 329
Confi guring Power Settings
Some aspects of a computer are a compromise between performance and power usage. For
mobile computers running on battery power, the greater the power usage, the shorter the
battery life. To maximize battery life, Windows 7 provides different power plans and switches
between them automatically when a computer is plugged in or running on battery.
However, the default battery power plan can reduce performance. To set the power plan
manually, perform these steps:
1. Click the power icon in the system tray, and then click More Power Options.
2. Click Change Plan Settings.
3. Click Change Settings That Are Currently Unavailable.
4. Change the display and sleep settings for times when the computer is plugged in or
running on battery.
5. To change other settings, click Change Advanced Power Settings. Adjust the settings,
and then click OK. Some of the more useful performance-related settings include:
■
Turn Off Hard Disk After Windows can turn the hard disk off to save power if it is
not used for a specifi c amount of time. Realistically, though, applications continue
to use the hard disk even if the user is not actively working with the computer.
■
Wireless Adapter Settings Wireless adapters can use a signifi cant amount of battery
power because they must transmit and receive radio signals. By default, Windows 7
enables power saving for wireless connections when running on battery power.
If wireless performance signifi cantly decreases while on battery power, you can
change the power saving mode to Maximum Performance while on battery power.
■
Sleep In Windows Vista and Windows 7, Sleep is a power-saving mode that combines
both Standby (a low-power state that allows the computer to recover in a few seconds)
and Hibernation (a zero-power state that stores the computer’s memory to disk, but
takes longer to recover). By default, Sleep in Windows 7 initially enters Standby mode
and then enters Hibernation 20 minutes later. Adjust this setting to change that default.
■
USB Settings USB devices draw power from a computer. With USB selective
suspend, Windows 7 can reduce the power usage of some USB devices. By default,
USB selective suspend is enabled while Windows 7 is on battery power.
■
Power Buttons And Lid By default, Windows 7 automatically enters sleep mode
when the lid of a mobile computer is closed. You can change this setting and
confi gure how the power button functions.
■
PCI Express Some mobile computers have a PCI Express interface. This setting
confi gures the power savings mode used for the PCI Express interface when on
battery power or plugged in.
■
Processor Power Management Most modern processors can run at different
speeds depending on the current processing requirements. When less processor
time is needed, the processor runs slower, requiring less power. You can use these
settings to change the minimum and maximum speed of the processor.
C08627093.indd 329C08627093.indd 329 2/18/2010 12:37:15 PM2/18/2010 12:37:15 PM
330 CHAPTER 8 Performance
■
Multimedia Settings You can use this setting to adjust video quality when on
battery power. Enabling a higher video quality increases battery usage.
■
Battery Adjust how Windows responds when a battery begins to run out of power.
6. Click Save Changes.
System Confi guration
Troubleshooting often involves experimentation. For example, when troubleshooting
a performance problem, you might stop a program or service from starting automatically
and then test the computer to determine if the performance problem has been resolved.
The challenge with this, however, is that you might disable useful applications and services
not related to the problem.
The System Confi guration Utility (Msconfi g.exe) allows you to disable startup programs
and system services individually or several at a time. Once you identify the source of the
problem, you can easily re-enable the startup programs and services. To disable a startup
program or service by using the System Confi guration Utility, use these steps:
1. Click Start, type msconfi g, and then press Enter.
2. To disable a service at startup, select the Services tab and clear the check box for the
service.
3. To disable a startup program, select the Startup tab and clear the check box for the
application.
4. Click OK. When prompted, click Restart.
When Windows restarts, the changes you have made take effect.
5. When the computer restarts, determine whether your changes improved the
computer’s performance. If disabling the startup program or service did solve the
problem, you can investigate it further. If there was no benefi t, use the System
Confi guration utility to re-enable the startup program or service.
You can remove a startup program permanently using Control Panel. To prevent a service
from starting automatically, use the Services console.
Quick Check
1. Which tool would you use to adjust the processor affi nity of a process, and why
would you adjust it?
2. On which volume does Windows 7 store virtual memory by default?
Quick Check Answers
1. Task Manager. You would adjust processor affi nity to limit the processor cores
a process can run on.
2. On the system volume.
Q
uic
k
C
h
ec
k
1.
Which tool would
y
ou use to ad
j
ust the processor affi nit
y
of a process, and wh
y
would you adjust it
?
2.
O
n which volume does Windows 7 store virtual memory by de
f
ault
?
Q
uick Check Answers
1
.
T
ask Manager. You would adjust processor a
ffi
nity to limit the processor cores
a process can run on.
2
.
O
n the s
y
stem volume.
Q
1
C08627093.indd 330C08627093.indd 330 2/18/2010 12:37:15 PM2/18/2010 12:37:15 PM
Lesson 2: Troubleshooting Performance Problems CHAPTER 8 331
PRACTICE Collect and Analyze Performance Data
In this practice, you collect performance data using a data collector set and then analyze it
using a report and Performance Monitor.
EXERCISE 1 Perform System Diagnostics
In this exercise, you collect performance data by using a built-in data collector set.
1. Click Start, right-click Computer, and then click Manage.
2. In the Computer Management console, expand System Tools, Performance, Data
Collector Sets, and then System.
3. Right-click System Diagnostics, and then click Start. Notice that a green arrow appears
on the System Diagnostics icon.
4. While the System Diagnostics data collector set is running, click System Diagnostics.
Browse through the various data collectors. In particular, view the properties of the
following data collectors:
■
Performance Counter
■
NT Kernel
■
Operating System
■
UAC Settings
■
Windows Update Settings
5. The green arrow disappears from the System Diagnostics icon after the data collector
set has fi nished running in one minute. Now, right-click System Diagnostics, and click
Latest Report.
6. Examine the Diagnostic Results section and investigate any error or warning
conditions. Then, investigate each of the other sections of the report to identify the
following pieces of information:
■
Processor utilization
■
The number of processors and whether the processors are hyperthreaded or not
■
Memory utilization
■
Total physical memory
■
Whether the operating system architecture is 32-bit or 64-bit
■
The name of the workgroup or domain the computer is a member of
■
The name of the anti-spyware, antivirus, and fi rewall software installed, if any
■
Whether User Access Control (UAC) is enabled
■
Whether the Computer Browser, Server, Workstation, and Windows Update services
are running
■
Which service is using the most processor time
C08627093.indd 331C08627093.indd 331 2/18/2010 12:37:16 PM2/18/2010 12:37:16 PM
332 CHAPTER 8 Performance
■
Whether IRQ 3 is in use
■
The Windows Experience Index rating for the processor, memory, and hard disk
■
Basic input/output system (BIOS) type and version
■
The Internet Protocol (IP) address that is sending the most bytes to the local
computer
■
The number of IPv4 and IPv6 connections
■
The fi le causing the most disk input/output (I/O)
■
The application with the largest working set
EXERCISE 2 Create a Performance Graph
In this exercise, you use Performance Monitor to analyze graphically the data you gathered in
Exercise 1.
1. In the Computer Management console, select the System Tools\Performance\
Monitoring Tools\Performance Monitor node.
2. Click the View Log Data button on the toolbar to open the Source tab of the
Performance Monitor Properties dialog box.
3. Select Log Files. Then, click Add. Select the C:\Perfl ogs\System\Diagnostics\
<Computer_Name>_yyyymmdd-######\Performance Counter.blg fi le to open the
performance counter log created when you ran the System Diagnostics data collector
set. Click Open.
4. Click OK to return to Performance Monitor.
Now you are viewing the logged performance data. However, because you have not
added any counters to the chart, nothing is visible.
5. Click the Add button on the toolbar. Add the following counters to the chart, and then
click OK:
■
IPv4\Datagrams/sec
■
IPv6\Datagrams/sec
■
Memory\% Committed Bytes In Use
■
PhysicalDisk\Disk Bytes/sec
■
Processor\% Processor Time
■
System\Processes
6. Press Ctrl+H to highlight the selected counter. Browse through the available counters
and examine their performance during the one minute log period.
7. Drag your mouse horizontally across the middle of the chart to select about 30 seconds
of the chart. Then, right-click the chart and click Zoom To. Notice that the chart
displays a smaller period of time.
8. Use the slider below the chart to select the entire chart time period. Then, right-click
the chart and click Zoom To.
C08627093.indd 332C08627093.indd 332 2/18/2010 12:37:16 PM2/18/2010 12:37:16 PM
Lesson 2: Troubleshooting Performance Problems CHAPTER 8 333
EXERCISE 3 Disable a Service Temporarily with the System Confi guration Utility
In this exercise, you temporarily disable a service with the System Confi guration utility.
1. Click Start, type msconfi g, and then press Enter.
2. In the System Confi guration Utility dialog box, on the Services tab, clear the check box
next to the Computer Browser service.
3. Click OK.
4. In the System Confi guration dialog box, click Restart. Windows restarts.
5. Log back on to Windows. Click Start, type msconfi g, and then press Enter.
6. On the Services tab, is the Computer Browser service stopped or started?
Stopped.
7. Select the check box next to the Computer Browser service, and then click OK.
8. In the System Confi guration dialog box, click Restart.
Lesson Summary
■
Task Manager provides a quick way to examine a computer’s performance and solve
some performance problems. With Task Manager, you can identify which processes are
consuming the most resources and either lower the priority of those processes or end
them.
■
You can use Performance Monitor to analyze system statistics in real time or you can
use it to analyze data logged using a data collector set.
■
Data collector sets and reports gather performance and confi guration data about
a computer and enable you to analyze that information easily using reports or
Performance Monitor.
■
Disk performance problems are most often caused by low disk space and
fragmentation. Windows 7 automatically defragments disks that need it, but if disk
space is too low, some fragmentation occurs anyway. To free up wasted disk space, you
can use the Disk Cleanup tool.
■
If a startup program is causing performance problems, you can use the System
Confi guration (Msconfi g.exe) tool to prevent it from starting. The System Confi guration
tool provides a convenient way to re-enable applications if you later determine that
they are not the source of the problem.
Lesson Review
You can use the following questions to test your knowledge of the information in Lesson 2,
“Troubleshooting Performance Problems.” The questions are also available on the companion
CD if you prefer to review them in electronic form.
C08627093.indd 333C08627093.indd 333 2/18/2010 12:37:16 PM2/18/2010 12:37:16 PM
334 CHAPTER 8 Performance
NOTE
ANSWERS
Answers to these questions and explanations of why each answer choice is correct or
incorrect are located in the “Answers” section at the end of the book.
1. You are a systems administrator for an enterprise company. A user calls to complain
that his computer is responding very slowly, and that Microsoft Offi ce Word is not
responding. He has attempted to close Word, but it has not stopped. What can
you do?
A. Press Ctrl+Alt+Del, and then click Start Task Manager. On the Applications tab, click
Word, and then click End Task.
B. Press Ctrl+Alt+Del, and then click Start System Confi guration Utility. On the Startup
tab, click Microsoft Word, and then click OK.
C. Press Alt+Tab, and then click Start Task Manager. On the Applications tab, click
Word, and then click End Task.
D. Press Alt+Tab, and then click Start System Confi guration Utility. On the Startup tab,
click Microsoft Word, and then click OK.
2. Which of the following factors most increases disk fragmentation?
A. Running from battery power
B. A large paging fi le
C. Low free disk space
D. Using a fl ash drive
3. Which of the following performance problems might occur on a mobile computer
using battery power? (Choose all that apply.)
A. Increased use of virtual memory
B. Slower memory access
C. Slower wireless networking
D. Lower-quality video
NOT
E
ANSWERS
E
A
nswers to these questions and explanations of why each answer choice is correct or
in
co
rr
ect
a
r
e
l
ocated
in
t
h
e
“An
s
w
e
r
s
”
sect
i
o
n
at
t
h
e
e
n
d
of
t
h
e
boo
k
.
C08627093.indd 334C08627093.indd 334 2/18/2010 12:37:16 PM2/18/2010 12:37:16 PM
Key Terms CHAPTER 8 335
Chapter Review
To further practice and reinforce the skills you learned in this chapter, you can perform the
following tasks:
■
Review the chapter summary.
■
Review the list of key terms introduced in this chapter.
■
Complete the case scenarios. These scenarios set up real-world situations involving the
topics of this chapter and ask you to create a solution.
■
Complete the suggested practices.
■
Take a practice test.
Chapter Summary
■
The Windows 7 event log contains a great deal of valuable information, including
events that describe problems that have already occurred or might occur soon.
By monitoring these events using event forwarding, you can respond to problems
more quickly or prevent them from becoming critical.
■
Using Task Manager, Performance Monitor, and data collector sets, you can identify
the cause of performance problems quickly. Task Manager can even solve some
performance problems by changing the priority of a running process or closing
an application. If a startup program or service seems to be causing the performance
problem, use the System Confi guration tool to disable different programs temporarily
during troubleshooting.
Key Terms
Do you know what these key terms mean? You can check your answers by looking up the
terms in the glossary at the end of the book.
■
Collecting computer
■
Event forwarding
■
Forwarding computer
■
Hibernation
■
Listener
■
Pull delivery mode
■
Push delivery mode
■
Standby
C08627093.indd 335C08627093.indd 335 2/18/2010 12:37:16 PM2/18/2010 12:37:16 PM
336 CHAPTER 8 Performance
Case Scenarios
In the following case scenarios, you apply what you’ve learned about subjects of this chapter.
You can fi nd answers to these questions in the “Answers” section at the end of this book.
Case Scenario 1: Monitoring Kiosk Computers
You are a systems administrator at the Baldwin Museum of Science. In addition to managing
computers used by internal staff, you manage several computers running Windows Vista that
are confi gured as kiosks in the museum’s front lobby. Visitors to the museum can use these
computers to browse a limited number of Web sites with science-related content. Desktop
security restrictions limit the applications that users can run and the Web sites they can visit.
The museum attracts a large audience of intelligent, computer-savvy visitors.
Unfortunately, some of them have taken it as a challenge to break into the kiosk computers.
For example, you recently happened upon an attacker using an internal wireless connection
to attack a kiosk computer across the network. You noticed the attack because you happened
to discover an event in the event log, as shown in Figure 8-12.
FIGURE 8-12 An event indicating an active attack in your organization
Questions
Answer the following questions for your manager:
1. You manage several kiosk computers. How can you monitor all their event logs easily
to check for this particular event?
2. Which bandwidth optimization technique should you use for event forwarding?
3. If this event appears, you need to know about it immediately. How can you be actively
notifi ed of an attack?
C08627093.indd 336C08627093.indd 336 2/18/2010 12:37:16 PM2/18/2010 12:37:16 PM
Suggested Practices CHAPTER 8 337
Case Scenario 2: Troubleshooting a Performance Problem
You are the lead systems administrator at Woodgrove Bank. Several times a day your
organization’s IT support staff receives support requests from users who are experiencing
a slow computer. However, the support staff has been unable to identify the cause of the
performance problem, and resolves the problem by having the users restart their computer.
Interviews
Following is a list of company personnel interviewed and their statements:
■
Stuart Railson, Desktop Support Technician “These users are so hard to help. This
guy complained that his computer was slow, and he has this attitude like it’s my fault.
I think the cause of the problem is that the computer is too old. We should upgrade
the processor or memory or something. I just have the users restart the computer.
I think more users experience the slowdowns than actually call us, but they’ve fi gured
out that they should just restart the computer to fi x it.”
■
Angela Barbariol, IT Manager “As you know, all our computers are running
Windows 7 with modern, dual-core processors and at least 3 GB of RAM. For the types
of applications these users run, that should be plenty. Proof of this is that the computers
perform fi ne when they’re initially restarted. Frankly, I’m embarrassed that we’ve
been solving the problem by restarting the computers because that interrupts user
productivity. Let’s fi nd the source of the performance problems so we can fi x them.”
Questions
Answer the following questions for your manager:
1. Which tools would you use to identify the source of the problem? How would you use
those tools?
2. What do you think the problem might be? Why would restarting the computer fi x it
temporarily?
Suggested Practices
To help you master the exam objectives presented in this chapter, complete the following
tasks.
Identify and Resolve Performance Issues
For this task, you should complete at least Practices 1 and 2 to gain more experience with
event forwarding. If you want a better understanding of how to confi gure event forwarding
in an enterprise, complete Practice 3 as well. Completing these confi guration tasks also helps
you with your troubleshooting skills because problems are bound to arise when confi guring
non-default event forwarding.
C08627093.indd 337C08627093.indd 337 2/18/2010 12:37:16 PM2/18/2010 12:37:16 PM
338 CHAPTER 8 Performance
Next, complete Practices 4 through 7 to get more experience monitoring computer
performance. Finally, complete Practice 8 to get a better understanding of how much
real-world disk space is wasted.
■
Practice 1 Confi gure a workgroup computer to forward events to another workgroup
computer.
■
Practice 2 Confi gure a forwarding computer to send events to a collecting computer
using each of the three standard bandwidth optimization techniques. Then, customize
the event forwarding confi guration by reducing the time required to forward events by
half.
■
Practice 3 Use Group Policy to confi gure multiple client computers to forward events
to a collecting computer. For the greatest scalability, use logon scripts to confi gure
the forwarding computers—it would be too time-consuming to confi gure forwarding
computers manually in an enterprise.
■
Practice 4 Run both standard data collector sets on several production computers.
Analyze the report generated by each.
■
Practice 5 Leave the Performance of Task Manager open while you do other work
on your computer. If you see utilization increase, use the Processes tab to identify the
process causing the extra utilization. Repeat this practice with the Networking tab.
■
Practice 6 Start an application, such as Notepad, and then end the process using the
Processes tab of Task Manager.
■
Practice 7 In Performance Monitor, add the Network Interface\Bytes Total/sec
counter for your primary network interface. Then, copy a fi le across the network. Make
note of the maximum bytes per second. Multiply that value times eight to determine
the maximum bandwidth used in bits per second. What percentage of the total
network bandwidth did the fi le transfer use?
■
Practice 8 Run the Disk Cleanup tool on several production computers. How much
space are you able to free, on average?
Take a Practice Test
The practice tests on this book’s companion CD offer many options. For example, you can test
yourself on just one exam objective, or you can test yourself on all the 70-685 certifi cation
exam content. You can set up the test so that it closely simulates the experience of taking
a certifi cation exam, or you can set it up in study mode so that you can look at the correct
answers and explanations after you answer each question.
MORE INFO PRACTICE TESTS
For details about all the practice test options available, see the section entitled “How to
Use the Practice Tests,” in the Introduction of this book.
MORE INFO PRACTICE TEST
S
F
or details about all the practice test options available, see the section entitled “How to
U
se the Practice Tests,” in the Introduction o
f
this book.
C08627093.indd 338C08627093.indd 338 2/18/2010 12:37:17 PM2/18/2010 12:37:17 PM
CHAPTER 9 339
CHAPTER 9
Troubleshooting Software
Issues
S
oftware errors can appear during the installation process, immediately after installation,
or long afterwards. Those that appear during installation tend to result from policy
or permission constraints, availability issues, or installation settings. Those that appear
immediately after installation tend to be associated with policy restrictions or compatibility
problems. Those that appear long after installation tend to result from confi guration
changes.
In this chapter, we look at the various causes of software errors and provide strategies for
how to resolve them.
Exam objectives in this chapter:
■
Identify and resolve new software installation issues.
■
Identify and resolve software confi guration issues.
■
Identify cause of and resolve software failure issues.
Lessons in this chapter:
■
Lesson 1: Understanding and Resolving Installation Failures 340
■
Lesson 2: Resolving Software Confi guration and Compatibility Issues 355
Before You Begin
To perform the exercises in this chapter, you need:
■
A domain controller running Windows Server 2008 R2
■
A client running Windows 7 Enterprise that is a member of the domain
C09627093.indd 339C09627093.indd 339 2/18/2010 12:39:37 PM2/18/2010 12:39:37 PM
340 CHAPTER 9 Troubleshooting Software Issues
Lesson 1: Understanding and Resolving
Installation Failures
To troubleshoot installation failures, you need to understand the requirements of a successful
installation. These requirements include—among other factors—administrator privileges,
compatibility with Windows 7, availability of installation code and data, and the status of
application dependencies. You also need to understand how administrative features such
as Software Restriction Policies (SRP) and AppLocker can block an installation even when
these requirements are met. This lesson provides an overview of issues such as these that are
related both to successful and unsuccessful installations.
After this lesson, you will be able to:
■
Troubleshoot software installation failures by verifying a number of well-known
installation requirements.
■
Understand how AppLocker can prevent software installations.
■
Understand many of the feature improvements of AppLocker over Software
Restriction Policies .
■
Use AppLocker to block a Windows Installer program from running.
Estimated lesson time: 30 minutes
Verifying Software Installation Requirements
You can install new software on clients running Windows 7 in two general ways. First, you can
push applications to clients by means of a software deployment technology such as Group
Policy, Microsoft System Center Confi guration Manager, or a third-party solution. The second
option is to install a program manually.
Although some of the requirements for successful software installation are particular
to the way in which the software is deployed, most requirements apply to all software
installation methods. To begin troubleshooting a failed installation, therefore, you can verify
the general requirements described in the following section.
Verifying Administrator Rights
One of the most basic requirements for a successful software installation is that the user
account running the installer program needs local administrator privileges, and to have these
local administrator privileges on a particular computer, the account needs to be a member of
the Administrators group on that computer.
If you are not able to get past the User Account Control prompt when you attempt to install
a program, therefore, you should verify that the account used for installation is granted local
administrator privileges on the computer in question. Typically, having domain administrator
privileges is suffi cient because by default, domain administrators are members of the local
A
f
ter this lesson,
y
ou will be able to
:
■
T
roubleshoot software installation failures b
y
verif
y
in
g
a number of well-known
i
nstallation re
q
uirements
.
■
U
nderstand how AppLocker can prevent software installations.
■
U
nderstand many o
f
the
f
eature improvements o
f
AppLocker over So
f
tware
Res
tri
c
ti
o
n P
o
li
c
i
es
.
■
U
se AppLocker to block a Windows Installer program
f
rom running
.
E
sti
m
ated
l
esso
n
ti
m
e:
30
m
i
n
utes
C09627093.indd 340C09627093.indd 340 2/18/2010 12:39:41 PM2/18/2010 12:39:41 PM