mcts training kit 70 - 685 Windows 7 Enterprise Desktop Support Technician phần 10 ppsx
Bạn đang xem bản rút gọn của tài liệu. Xem và tải ngay bản đầy đủ của tài liệu tại đây (753.54 KB, 74 trang )
588 APPENDIX E Troubleshooting Network Issues
To reproduce this problem (and test whether you have fi xed it), open a command prompt
and run the following command.
net use \\<server from above>\ipc$ /u:<account used for join> <password>
To determine whether the edition of Windows supports joining a domain, search for the
keyword NetpDomainJoinLicensingCheck (most recent entries are at the bottom of the log
fi le). If the ulLicenseValue is anything other than 1, it indicates that the edition of Windows
cannot join a domain. To join a domain, a computer must be running the Windows 7
Professional, Windows 7 Enterprise, or Windows 7 Ultimate operating systems. The following
shows a log fi le entry for a computer running a supported version of Windows (as indicated
by ulLicenseValue=1).
NetpDomainJoinLicensingCheck: ulLicenseValue=1, Status: 0x0
How to Verify Requirements for Joining a Domain
To join or log on to a domain successfully, you must meet several different requirements.
When troubleshooting a problem joining a domain, verify each of these requirements:
■
The client computer must be able to resolve the IP address for a domain
controller
In most enterprise networks, client computers receive an IP address
assignment from a DHCP server, and the DHCP server provides addresses for
AD DS–enabled DNS servers that can resolve the domain controller IP address.
If another DNS server is confi gured, you should update the client computer’s
IP confi guration to use an AD DS–enabled DNS server. If this is not possible, you can add
two records to your existing DNS server that resolve to a domain controller’s IP address:
••
The _ldap._tcp.dc._msdcs.DNSDomainName SRV resource record, which identifi es
the name of the domain controller that hosts the AD DS domain. DNSDomainName
is the DNS name of the AD DS domain the computer is attempting to join.
••
A corresponding address (A) resource record that identifi es the IP address for the
domain controller listed in the _ldap._tcp.dc._msdcs.DNSDomainName SRV resource
record.
■
The client computer must be able to exchange traffi c with the domain controller
on several different TCP and UDP ports
These ports include:
••
TCP port 135 for RPC traffi c
••
TCP port 389 and UDP port 389 for LDAP traffi c
••
TCP port 636 for LDAP over SSL traffi c
••
TCP port 3268 for LDAP Global Catalog (GC) traffi c
••
TCP port 3269 for LDAP GC SSL traffi c
••
TCP port 53 and UDP port 53 for DNS traffi c
••
TCP port 88 and UDP port 88 for Kerberos traffi c
••
TCP port 445 for SMB (also known as CIFS) traffi c
Z05A627093.indd 588Z05A627093.indd 588 2/18/2010 2:10:26 PM2/18/2010 2:10:26 PM
The Process of Troubleshooting Network Problems APPENDIX E 589
NOTE
For information about determining whether specifi c ports are available, see the
section titled “How to Troubleshoot Application Connectivity Problems” earlier in this
appendix. The easiest way to test for all of these ports at one time is to use Portqueryui.
exe and the “Domains and Trusts” predefi ned service.
■
The administrator must have privileges to add a computer to
a domain
Administrators who add a computer to a domain must have the
Add Workstations To Domain user right.
■
The computer must be running Windows 7 Professional, Windows 7 Enterprise,
or Windows 7 Ultimate
Windows 7 Starter, Windows 7 Home Basic, and Windows 7
Home Premium operating systems cannot join a domain.
How to Troubleshoot Network Discovery
With Network Discovery, users can browse shared network resources from the Network
window. On private networks, this is convenient because users can connect to resources
without knowing the names of other computers on the network. On public networks, however,
Network Discovery is a security concern because it will announce the presence of the computer
on the public network and users might use it to connect to a potentially malicious computer.
For these reasons, Network Discovery is enabled on private networks but disabled on
public networks by default. When connected to an AD DS domain, Network Discovery is
controlled by Group Policy settings but is disabled by default. Therefore, if the Network
window does not display shared resources on the local network, it is almost certainly because
Network Discovery is disabled. To remedy this, follow these steps (all of which require
administrator privileges and can increase your computer’s exposure to security attacks):
1. Verify that the Function Discovery Provider Host service is running.
2. Verify that Windows Firewall has exceptions enabled for Network Discovery.
3. Change the type of network from public to private. Alternatively, you can manually
enable Network Discovery by opening the Network And Sharing Center window and
enabling Network Discovery.
How to Troubleshoot File and Printer Sharing
Several different factors can cause problems with connecting to shared fi les and printers
(which use the same communications protocols):
■
Windows Firewall or another software fi rewall is blocking traffi c at the client or server.
■
A network fi rewall between the client and server is blocking traffi c.
■
The client is providing invalid credentials, and the server is rejecting the client’s
connection attempt.
■
Name resolution problems prevent the client from obtaining the server’s IP address.
NOT
E
For information about determining whether specifi c ports are available, see the
E
section titled “How to Troubleshoot Application Connectivit
y
Problems” earlier in this
appendix. The easiest way to test
f
or all o
f
these ports at one time is to use Portqueryui.
e
xe and the “Domains and Trusts”
p
rede
fi
ned service.
Z05A627093.indd 589Z05A627093.indd 589 2/18/2010 2:10:26 PM2/18/2010 2:10:26 PM
590 APPENDIX E Troubleshooting Network Issues
First, start troubleshooting from the client computer. If the server is a computer running
Windows 7 and you have administrator access to it, you can also troubleshoot from the
server. The two sections that follow assume that the client and server belong to a domain.
How to Troubleshoot File and Printer Sharing from the Client
Follow these steps to troubleshoot problems connecting to shared fi les and printers:
1. If you can connect to the shared folder but receive an Access Is Denied message
when attempting to open the folder, your user account has permission to access the
share but lacks NTFS File System (NTFS) permissions for the folder. Contact the server
administrator to grant the necessary NTFS fi le permissions. If the server is a computer
running Windows 7, see the section titled “How to Troubleshoot File and Printer
Sharing from the Server” later in this appendix.
2. Verify that you can resolve the server’s name correctly. At a command prompt, type
ping hostname. If Ping displays an IP address, as shown here, you can resolve the
server’s name correctly. It does not matter whether the server replies to the pings.
If this step fails, it indicates a name resolution problem. Contact your AD DS or DNS
administrator.
ping server
Pinging server [10.1.42.22] with 32 bytes of data:
3. Attempt to connect using the server’s IP address, as identifi ed in the previous step,
rather than the server’s host name. For example, instead of connecting to
\\server\printer, you might connect to \\10.1.42.22\printer.
4. From a command prompt, attempt to establish a connection to a server using the
net use \\ip_address command. If it succeeds, you have suffi cient network connectivity,
but your user account lacks privileges to connect to the folder or printer share. Have
the server administrator grant your account the necessary share permissions. Share
permissions are separate from NTFS fi le permissions.
5. Use Telnet or PortQry to test whether your computer can connect to TCP port 445 of
the remote computer. If you cannot connect using TCP port 445, test TCP port 139.
For instructions on how to test for connectivity using a specifi c port, see the section
titled “How to Troubleshoot Application Connectivity Problems” earlier in this
appendix. If you cannot connect using either TCP port 139 or TCP port 445, verify
that File And Printer Sharing is enabled on the server. Then, verify that the server
has a fi rewall exception for TCP ports 139 and 445 or that an exception in Windows
Firewall is enabled for File And Printer Sharing.
6. Attempt to connect to the server using an account with administrative credentials
on the server. If you can connect with a different account, your normal account lacks
suffi cient credentials. Have the server administrator grant your account the necessary
Pin
g
in
g
server [10.1.42.22] with 32 bytes o
f
data:
Z05A627093.indd 590Z05A627093.indd 590 2/18/2010 2:10:26 PM2/18/2010 2:10:26 PM
The Process of Troubleshooting Network Problems APPENDIX E 591
privileges. Depending on the server confi guration, you might be able to identify
authentication problems by viewing the Security Event Log. However, logon failure
auditing must be enabled on the server for the events to be available.
If you are still unable to connect, continue troubleshooting from the server. If you do not
have access to the server, contact the server administrator for assistance.
How to Troubleshoot File and Printer Sharing from the Server
To troubleshoot fi le and printer sharing from a server running Windows 7 that is sharing the
folder or printer, follow these steps:
1. Verify that the folder or printer is shared. Right-click the object and then click Sharing.
If it does not indicate that the object is already shared, share the object and then
attempt to connect from the client.
2. If you are sharing a folder and it is not already shared, right-click the folder and click
Share. In the File Sharing Wizard, click Change Sharing Permissions. If the File Sharing
Wizard does not appear, the Server service is not running. Continue with the next step.
Otherwise, verify that the user account attempting to connect to the share appears on
the list or that the user account is a member of a group that appears on the list. If the
account is not on the list, add it to the list. Click Share and then click Done.
3. Verify that the Server service is running. The Server service should be started and set
to start automatically for fi le and printer sharing to work.
4. Verify that users have the necessary permission to access the resources. Right-click the
object and then click Properties. In the Properties dialog box, click the Security tab.
Verify that the user account attempting to connect to the share appears on the list,
or that the user account is a member of a group that appears on the list. If the account
is not on the list, add it to the list.
5. Check the Windows Firewall exceptions to verify that it is confi gured properly by
following these steps:
a. Click Start and then click Control Panel.
b. Click Security and then click Windows Firewall.
c. In the Windows Firewall dialog box, note the Network Location. Click Change
Settings.
d. In the Windows Firewall Settings dialog box, click the Exceptions tab. Verify that
the File And Printer Sharing check box is selected.
e. If the File And Printer Sharing exception is enabled, it applies only for the current
network profi le. For example, if Windows Firewall indicated your Network Location
was Domain Network, you might not have the File And Printer Sharing exception
enabled when connected to private or public networks. Additionally, Windows
Firewall will, by default, allow fi le and printer sharing traffi c from the local network
only when connected to a private or public network.
Z05A627093.indd 591Z05A627093.indd 591 2/18/2010 2:10:26 PM2/18/2010 2:10:26 PM
592 APPENDIX E Troubleshooting Network Issues
How to Troubleshoot Wireless Networks
Wireless networks are now very common. However, users often have problems connecting
to wireless networks, because these networks are more complex than wired networks.
To troubleshoot problems connecting to a wireless network, follow these steps.
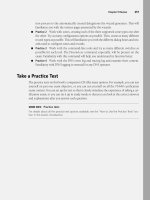
1. Verify that the wireless network adapter is installed and has an active driver. From
Network And Sharing Center, click Change Adapter Settings. If your wireless network
connection does not appear as shown in Figure E-10, your network adapter or driver is
not installed. See Appendix F, “Troubleshooting Stop Messages,” for more information.
FIGURE E-10 Network Connections will display the adapter if your wireless network
adapter and driver are properly installed.
2. If a wireless network adapter is installed, right-click it in Network Connections and then
click Diagnose. Follow the prompts that appear. Windows might be able to diagnose
the problem.
Network Diagnostics
Tim Rains, Program Manager ; Windows Networking
N
etwork Diagnostics is capable of diagnosing more than 180 different issues
related to wireless networking. To get the most from network diagnostics for
wireless networks, ensure that you are using native WiFi drivers instead of legacy
WiFi drivers. To determine which type of driver(s) is installed on a system, run the
following command at a command prompt.
netsh wlan show drivers
In the resulting output, look for the line labeled “Type.” It should be either legacy
WiFi Driver or Native Wi-Fi Driver. If a legacy WiFi driver is installed, contact the
manufacturer of the wireless network adapter to see whether a native WiFi driver
for the adapter is available.
N
etwor
k
Dia
g
nostics
Ti
m Ra
i
ns, Pro
g
ram Mana
g
er
;
Wi
ndows Network
i
n
g
N
etwork Dia
g
nostics is capable of dia
g
nosin
g
more than 180 different issues
related to wireless networking. To get the most
f
rom network diagnostics
f
or
w
ireless networks, ensure that
y
ou are usin
g
native WiFi drivers instead of le
g
ac
y
W
iFi drivers. To determine which type of driver(s) is installed on a system, run the
f
ollowin
g
command at a command prompt.
n
ets
h
w
l
an s
h
ow
d
r
i
vers
I
n the resultin
g
output, look for the line labeled “T
y
pe.” It should be either le
g
ac
y
W
iFi Driver or Native Wi-Fi Driver. I
f
a legacy WiFi driver is installed, contact the
m
anufacturer of the wireless network adapter to see whether a native WiFi driver
f
or the ada
p
ter is available.
Z05A627093.indd 592Z05A627093.indd 592 2/18/2010 2:10:26 PM2/18/2010 2:10:26 PM
The Process of Troubleshooting Network Problems APPENDIX E 593
3. Open Event Viewer and view the System Event Log. Filter events to view only those
events with a Source of Diagnostics-Networking. Examine recent events and analyze
the information provided by the Windows Troubleshooting Platform for the possible
source of the problem.
4. Verify that wireless networking is enabled on your computer. To save power, most
portable computers have the ability to disable the wireless network radio. Often,
this is controlled by a physical switch on the computer. Other times, you must press
a special, computer-specifi c key combination (such as Fn+F2) to enable or disable the
radio. If the wireless radio is disabled, the network adapter will appear in Network
Connections but it will not be able to view any wireless networks.
5. If the wireless network adapter shows Not Connected, attempt to connect to a wireless
network. Within Network Connections, right-click the Network Adapter and then click
Connect. In the Connect To A Network dialog box, click a wireless network and then
click Connect.
6. If the wireless network is security enabled and you are prompted for the passcode
but cannot connect (or the wireless adapter indefi nitely shows a status of Identifying
or Connected With Limited Access), verify that you typed the passcode correctly.
Disconnect from the network and reconnect using the correct passcode.
7. If you are still unable to connect to a wireless network, perform a wireless network
trace and examine the details of the report for a possible cause of the problem,
as described in the section titled “How to Troubleshoot Performance Problems and
Intermittent Connectivity Issues” earlier in this appendix.
If the wireless network adapter shows the name of a wireless network (rather than Not
Connected), you are currently connected to a wireless network. This does not, however,
necessarily assign you an IP address confi guration, grant you access to other computers on
the network, or grant you access to the Internet. First, disable and re-enable the network
adapter by right-clicking it, clicking Disable, right-clicking it again, and then clicking Enable.
Then, reconnect to your wireless network. If problems persist, move the computer closer
to the wireless access point to determine whether the problem is related to signal strength.
Wireless networks have limited range, and different computers can have different types
of antennas and therefore different ranges. If the problem is not related to the wireless
connection itself, read the section titled “How to Troubleshoot Network Connectivity
Problems” earlier in this appendix.
NOTE This section focuses only on confi guring a wireless client running Windows 7;
it does not discuss how to confi gure a wireless network infrastructure. For more
information, refer to Chapter 10 of Windows Server 2008 Networking and Network Access
Protection by Joseph Davies and Tony Northrup (Microsoft Press, 2008).
NO
T
E
This section focuses only on confi guring a wireless client running Windows 7;
E
it does not discuss how to confi
g
ure a wireless network infrastructure. For more
in
f
ormation, re
f
er to Cha
p
ter 10 o
f
W
i
n
d
ows Server 2008 Networ
ki
ng an
d
Networ
k
Access
P
rotection b
y
Joseph Davies and Ton
y
Northrup (Microsoft Press, 2008)
.
Z05A627093.indd 593Z05A627093.indd 593 2/18/2010 2:10:27 PM2/18/2010 2:10:27 PM
594 APPENDIX E Troubleshooting Network Issues
How to Troubleshoot Firewall Problems
Many attacks are initiated across network connections. To reduce the impact of those
attacks, Windows Firewall by default blocks unrequested, unapproved incoming traffi c and
unapproved outgoing traffi c. Although Windows Firewall will not typically cause application
problems, it has the potential to block legitimate traffi c if not properly confi gured. When
troubleshooting application connectivity issues, you will often need to examine and possibly
modify the client’s or server’s Windows Firewall confi guration.
Misconfi guring Windows Firewall can cause several different types of connectivity
problems. On a computer running Windows 7 that is acting as the client, Windows Firewall
might block outgoing communications for the application (though blocking outgoing
communications is not enabled by default). On a computer running Windows 7 that is
acting as the server (for example, a computer that is sharing a folder), Windows Firewall
misconfi guration might cause any of the following problems:
■
Windows Firewall blocks all incoming traffi c for the application.
■
Windows Firewall allows incoming traffi c for the LAN but blocks incoming traffi c
for other networks.
■
Windows Firewall allows incoming traffi c when connected to a domain network but
blocks incoming traffi c when connected to a public or private network.
The symptoms of client- or server-side fi rewall misconfi guration are the same: application
communication fails. To make troubleshooting more complex, network fi rewalls can cause the
same symptoms. Answer the following questions to help identify the source of the problem:
1. Can you connect to the server from other clients on the same network? If the answer
is yes, you have a server-side fi rewall confi guration problem that is probably related
to the confi gured scope of a fi rewall exception. If adjusting the scope of the fi rewall
exception does not solve the problem, it is probably caused by a network fi rewall, and
you should contact your network administrators for further assistance.
2. Can you connect to the server when the client is connected to one type of network
location (such as a home network or a domain network), but not when it is connected
to a different type of network location? If the answer is yes, you have a client-side
fi rewall confi guration problem that is probably caused by having an exception
confi gured for only one network location type.
3. Can other clients on the same network connect to the server using the same
application? If the answer is yes, you have a client-side fi rewall confi guration problem
that is probably caused by having a rule that blocks outgoing traffi c for the application.
4. Can the client connect to other servers using the same application? If the answer is yes,
you have a server-side fi rewall confi guration problem, and the server needs a fi rewall
exception added. If adding an exception does not solve the problem, it is probably
caused by a network fi rewall, and you should contact your network administrators for
further assistance.
Z05A627093.indd 594Z05A627093.indd 594 2/18/2010 2:10:27 PM2/18/2010 2:10:27 PM
The Process of Troubleshooting Network Problems APPENDIX E 595
Summary
Windows 7 can automatically diagnose many common network problems. Other
problems are more complicated and require you as an administrator to perform additional
troubleshooting to isolate the source of the problem. When you have isolated the source of
the problem, you may be able to fi x the problem yourself. If the problem is related to a failed
network circuit or another factor outside of your control, isolating the problem allows you
to escalate the issue to the correct support team and allow the support team to resolve the
problem as quickly as possible.
Z05A627093.indd 595Z05A627093.indd 595 2/18/2010 2:10:27 PM2/18/2010 2:10:27 PM
Z05A627093.indd 596Z05A627093.indd 596 2/18/2010 2:10:27 PM2/18/2010 2:10:27 PM
APPENDIX F 597
APPENDIX F
Troubleshooting Stop
Messages
NOTE This material was originally published in a slightly different form in Windows 7
Resource Kit by Mitch Tulloch, Tony Northrup, Jerry Honeycutt, Ed Wilson, and the
Windows 7 Team at Microsoft (Microsoft Press, 2010).
W
hen Windows detects an unexpected problem from which it cannot recover,
a Stop error occurs. A Stop error serves to protect the integrity of the system by
immediately stopping all processing. Although it is theoretically possible for Windows to
continue functioning when it detects that a core feature has experienced a serious problem,
the integrity of the system would be questionable, which could lead to security violations,
system corruption, and invalid transaction processing.
When a Stop error occurs, Windows displays a Stop message, sometimes referred to
as a blue screen, which is a text-mode error message that reports information about the
condition. A basic understanding of Stop errors and their underlying causes improves your
ability to locate and understand technical information or perform diagnostic procedures
requested of you by technical support personnel.
Stop Message Overview
Stop errors occur only when a problem cannot be handled by using the higher-level
error-handling mechanisms in Windows. Normally, when an error occurs in an application,
the application interprets the error message and provides detailed information to the
system administrator. However, Stop errors are handled by the kernel, and Windows is only
able to display basic information about the error, write the contents of memory to the disk
(if memory dumps are enabled), and halt the system. This basic information is described
in more detail in the section titled “Stop Messages” later in this appendix.
As a result of the minimal information provided in a Stop message and the fact that
the operating system stops all processing, Stop errors can be diffi cult to troubleshoot.
Fortunately, they tend to occur very rarely. When they do occur, they are almost always
caused by driver problems, hardware problems, or fi le inconsistencies.
N
O
T
E
This material was originally published in a slightly different form in
E
W
indows 7
R
esou
r
ce
K
it
by Mitch Tulloch, Tony Northrup, Jerry Honeycutt, Ed Wilson, and the
t
Windows 7 Team at Microsoft
(
Microsoft Press, 2010
).
Z06A627093.indd 597Z06A627093.indd 597 2/8/2010 12:02:07 PM2/8/2010 12:02:07 PM
598 APPENDIX F Troubleshooting Stop Messages
Identifying the Stop Error
Many different types of Stop errors occur. Each has its own possible causes and requires
a unique troubleshooting process. Therefore, the fi rst step in troubleshooting a Stop error is
to identify the Stop error. You need the following information about the Stop error to begin
troubleshooting:
■
Stop error number This number uniquely identifi es the Stop error.
■
Stop error parameters These parameters provide additional information about the
Stop error. Their meaning is specifi c to the Stop error number.
■
Driver information When available, the driver information identifi es the most likely
source of the problem. Not all Stop errors are caused by drivers, however.
This information is often displayed as part of the Stop message. If possible, write it down
to use as a reference during the troubleshooting process. If the operating system restarts
before you can write down the information, you can often retrieve the information from the
System Event Log in Event Viewer.
If you are unable to gather the Stop error number from the Stop message and the System
Log, you can retrieve it from a memory dump fi le. By default, Windows is confi gured to
create a memory dump whenever a Stop error occurs. If no memory dump fi le was created,
confi gure the system to create a memory dump fi le. Then, if the Stop error reoccurs, you will
be able to extract the necessary information from the memory dump fi le.
Finding Troubleshooting Information
Each Stop error requires a different troubleshooting technique. Therefore, after you
identify the Stop error and gather the associated information, use the following sources for
troubleshooting information specifi c to that Stop error:
■
Microsoft Debugging Tools For Windows Help Install Microsoft Debugging Tools
For Windows and consult Help for that tool. This Help contains the defi nitive list of
Stop messages, including many not covered in this appendix, and explains how to
troubleshoot a wide variety of Stop errors. To install Debugging Tools For Windows,
visit
■
Microsoft Knowledge Base The Knowledge Base includes timely articles about
a limited subset of Stop errors. Stop error information in the Knowledge Base is often
specifi c to a particular driver or hardware feature and generally includes step-by-step
instructions for resolving the problem.
■
Microsoft Help and Support For related information, see Microsoft Help and
Support at .
■
Microsoft Product Support Services If you cannot isolate the cause of the Stop
error, obtain assistance from trained Microsoft Product Support Services personnel.
You might need to furnish specifi c information and perform certain procedures to help
technical support investigate your problem. For more information about Microsoft
product support, visit />srv_ enterprise.mspx.
Z06A627093.indd 598Z06A627093.indd 598 2/8/2010 12:02:16 PM2/8/2010 12:02:16 PM
Stop Message Overview APPENDIX F 599
Stop Messages
Stop messages report information about Stop errors. The intention of the Stop message is to
assist the system administrator in isolating and eventually resolving the problem that caused
the Stop error. Stop messages provide a great deal of useful information to administrators
who understand how to interpret the information in the Stop message. In addition to other
information, the Stop message includes the Stop error number, or bugcheck code, that you
can use to fi nd or reference troubleshooting information about the specifi c Stop error at
.
When examining a Stop message, you need to have a basic understanding of the problem
so that you can plan a course of action. Always review the Stop message and record as much
information about the problem as possible before searching through technical sources. Stop
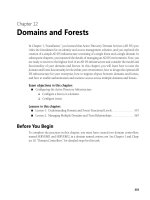
messages use a full-screen character mode format, as shown in Figure F-1.
FIGURE F-1 Stop messages display information to help you troubleshoot the Stop error.
As shown in Figure F-1, a Stop message screen has several major sections, which display
the following information:
■
Bugcheck Information
■
Recommended User Action
■
Technical Information
■
Driver Information (if available)
■
Debug Port and Dump Status Information
Z06A627093.indd 599Z06A627093.indd 599 2/8/2010 12:02:16 PM2/8/2010 12:02:16 PM
600 APPENDIX F Troubleshooting Stop Messages
NOTE
If the video display drivers have stopped functioning, the kernel might not be able
to fully display the entire Stop message. In such a case, only the fi rst line may be visible,
or the screen may be black. Wait several minutes to allow the memory dump fi le to be
created and then use the standard troubleshooting techniques described in this appendix.
Bugcheck Information
The Bugcheck Information section lists the Stop error descriptive name. Descriptive names are
directly related to the Stop error number listed in the Technical Information section.
Recommended User Action
The Recommended User Action section informs the user that a problem has occurred
and that Windows was shut down. It also provides the symbolic name of the Stop error. In
Figure F-1, the symbolic name is BUGCODE_USB_DRIVER. It also attempts to describe the
problem and lists suggestions for recovery. In some cases, restarting the computer might be
suffi cient because the problem is not likely to recur. But if the Stop error persists after you
restart the operating system, you must determine the root cause to return the operating
system to an operable state. This process might involve undoing recent changes, replacing
hardware, or updating drivers to eliminate the source of the problem.
Technical Information
The Technical Information section lists the Stop error number, also known as the bugcheck
code, followed by up to four Stop error–specifi c codes (displayed as hexadecimal numbers
enclosed in parentheses), which identify related parameters. Stop error codes contain a 0x
prefi x, which indicates that the number is in hexadecimal format. For example, in Figure F-1,
the Stop error hexadecimal code is 0x000000FE (often written as 0xFE).
Driver Information
The Driver Information section identifi es the driver associated with the Stop error. If a fi le
is specifi ed by name, you can use safe mode to verify that the driver is signed or has a
date stamp that coincides with other drivers. If necessary, you can replace the fi le manually
(in Startup Repair or in safe mode) or use Roll Back Driver to revert to a previous version.
For more information about Startup Repair and safe mode, see Appendix C, “Confi guring
Startup and Troubleshooting Startup Issues.” For more information about troubleshooting
drivers, see Appendix D, “Troubleshooting Hardware, Driver, and Disk Issues.” Figure F-1 does
not display a driver name.
Debug Port and Dump Status Information
The Debug Port and Dump Status Information section lists Component Object Model (COM)
port parameters that a kernel debugger uses, if enabled. If you have enabled memory dump
fi le saves, this section also indicates whether one was successfully written. As a dump fi le is
NOT
E
If the video display drivers have stopped functioning, the kernel might not be able
E
to full
y
displa
y
the entire Stop messa
g
e. In such a case, onl
y
the fi rst line ma
y
be visible,
o
r the screen may be black. Wait several minutes to allow the memory dump
fi
le to be
created and then use the standard troubleshooti
ng
techn
iq
ues described in this
ap
pe
ndix
.
Z06A627093.indd 600Z06A627093.indd 600 2/8/2010 12:02:16 PM2/8/2010 12:02:16 PM
Stop Message Overview APPENDIX F 601
being written to the disk, the percentage shown after Dumping physical memory to disk is
incremented to 100. A value of 100 indicates that the memory dump was successfully saved.
For more information about installing and using kernel debuggers, see the section titled
“Using Symbol Files and Debuggers” later in this appendix.
Types of Stop Errors
A hardware or software problem can cause a Stop error, which causes a Stop message to
appear. Stop messages typically fi t into one of the following categories:
■
Stop errors caused by faulty software A Stop error can occur when a driver, service,
or system feature running in Kernel mode introduces an exception. For example,
a driver attempts to perform an operation above its assigned interrupt request level
(IRQL) or tries to write to an invalid memory address. A Stop message might seem to
appear randomly, but through careful observation, you might be able to associate the
problem with a specifi c activity. Verify that all installed software (especially drivers) in
question is fully Windows 7–compatible and that you are running the latest versions.
Windows 7 compatibility is especially important for applications that might install
drivers.
■
Stop errors caused by hardware issues This problem occurs as an unplanned event
resulting from defective, malfunctioning, or incorrectly confi gured hardware. If you
suspect a Stop error is caused by hardware, fi rst install the latest drivers for that
hardware. Failing hardware can cause Stop errors regardless of the stability of the
driver, however. For more information about how to troubleshoot hardware issues, see
Appendix D.
■
Executive initialization Stop errors Executive initialization Stop errors occur only
during the relatively short Windows executive initialization sequence. Typically, these
Stop errors are caused by corrupted system fi les or faulty hardware. To resolve them,
run Startup Repair as described in Appendix C. If problems persist, verify that all
hardware features have the latest fi rmware and then continue troubleshooting as
described in Appendix D.
■
Installation Stop errors that occur during setup For new installations, installation
Stop errors typically occur because of incompatible hardware, defective hardware, or
outdated fi rmware. During an operating system upgrade, Stop errors can occur when
incompatible applications and drivers exist on the system. Update the computer’s
fi rmware to the version recommended by the computer manufacturer before installing
Windows. Consult your system documentation for information about checking and
upgrading your computer’s fi rmware.
Z06A627093.indd 601Z06A627093.indd 601 2/8/2010 12:02:16 PM2/8/2010 12:02:16 PM
602 APPENDIX F Troubleshooting Stop Messages
Memory Dump Files
When a Stop error occurs, Windows displays information that can help you analyze the root
cause of the problem. Windows writes the information to the paging fi le (Pagefi le.sys) on the
%SystemDrive% root by default. When you restart the computer in normal or safe mode after
a Stop error occurs, Windows uses the paging fi le information to create a memory dump fi le
in the %SystemRoot% folder. Analyzing dump fi les can provide more information about the
root cause of a problem and lets you perform offl ine analysis by running analysis tools on
another computer.
You can confi gure your system to generate three types of dump fi le:
■
Small memory dump fi les Sometimes referred to as minidump fi les, these dump fi les
contain the least amount of information but are very small. Small memory dump fi les
can be written to disk quickly, which minimizes downtime by allowing the operating
system to restart sooner. Windows stores small memory dump fi les (unlike kernel
and complete memory dump fi les) in the %SystemRoot%\Minidump folder, instead
of using the %SystemRoot%\Memory.dmp fi le name.
■
Kernel memory dump fi les These dump fi les record the contents of kernel memory.
Kernel memory dump fi les require a larger paging fi le on the boot device than small
memory dump fi les and take longer to create when a failure has occurred. However,
they record signifi cantly more information and are more useful when you need to
perform in-depth analysis. When you choose to create a kernel memory dump fi le,
Windows also creates a small memory dump fi le.
■
Complete memory dump fi les These dump fi les record the entire contents of
physical memory when the Stop error occurred. A complete memory dump fi le’s size
will be slightly larger than the amount of physical memory installed at the time of the
error. When you choose to create a complete memory dump fi le, Windows also creates
a small memory dump fi le.
By default, Windows is confi gured to create kernel memory dump fi les. By default, small
memory dump fi les are saved in the %SystemRoot%\Minidump folder, and kernel and complete
memory dump fi les are saved to a fi le named %SystemRoot%\Memory.dmp. To change the
type of dump fi le Windows creates or to change their location, follow these steps:
1. Click Start, right-click Computer, and then select Properties.
2. Click Advanced System Settings.
3. In the System Properties dialog box, click the Advanced tab. Under Startup And
Recovery, click Settings.
4. Use the drop-down Write Debugging Information list and then select the
debugging type.
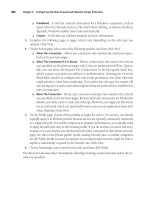
5. If desired, change the path shown in the Dump File box. Figure F-2 shows the Startup
And Recovery dialog box.
Z06A627093.indd 602Z06A627093.indd 602 2/8/2010 12:02:16 PM2/8/2010 12:02:16 PM
Memory Dump Files APPENDIX F 603
FIGURE F-2 Use the Startup And Recovery dialog box to change dump types and locations.
6. Click OK twice and then restart the operating system if prompted.
The sections that follow describe the different types of dump fi les in more detail.
Confi guring Small Memory Dump Files
Small memory dump fi les contain the least amount of information, but they also consume
the least amount of disk space. By default, Windows stores small memory dump fi les in the
%SystemRoot%\Minidump folder.
Windows always creates a small memory dump fi le when a Stop error occurs, even when
you choose the kernel dump fi le or complete memory dump fi le options. Small memory
dump fi les can be used by both Windows Error Reporting (WER) and debuggers. These tools
read the contents of a small memory dump fi le to help diagnose problems that cause Stop
errors. For more information, see the sections titled “Using Memory Dump Files to Analyze
Stop Errors” and “Using Windows Error Reporting” later in this appendix.
A small memory dump fi le records the smallest set of information that might identify the
cause of the system stopping unexpectedly. For example, the small memory dump includes
the following information:
■
Stop error information Includes the error number and additional parameters that
describe the Stop error.
■
A list of drivers running on the system Identifi es the modules in memory when
the Stop error occurred. This device driver information includes the fi le name, date,
version, size, and manufacturer.
Z06A627093.indd 603Z06A627093.indd 603 2/8/2010 12:02:16 PM2/8/2010 12:02:16 PM
604 APPENDIX F Troubleshooting Stop Messages
■
Processor context information for the process that stopped Includes the processor
and hardware state, performance counters, multiprocessor packet information,
deferred procedure call information, and interrupts.
■
Kernel context information for the process that stopped Includes offset of the
directory table and the page frame number database, which describes the state of
every physical page in memory.
■
Kernel context information for the thread that stopped Identifi es registers
and IRQLs and includes pointers to operating system data structures.
■
Kernel-mode call stack information for the thread that stopped Consists of a series
of memory locations and includes a pointer to the initial location. Developers might
be able to use this information to track the source of the error. If this information is
greater than 16 kilobytes (KB), only the topmost 16 KB is included.
A small memory dump fi le requires a paging fi le of at least 2 megabytes (MB) on the
boot volume. The operating system saves each dump fi le with a unique fi le name every time
a Stop error occurs. The fi le name includes the date the Stop error occurred. For example,
Mini011007-02.dmp is the second small memory dump generated on January 10, 2007.
Small memory dump fi les are useful when space is limited or when you are using a slow
connection to send information to technical support personnel. Because of the limited
amount of information that can be included, these dump fi les do not include errors that were
not directly caused by the thread that was running when the problem occurred.
Confi guring Kernel Memory Dump Files
By default, Windows systems create kernel memory dump fi les. The kernel memory dump fi le
is an intermediate-size dump fi le that records only kernel memory and can occupy several
megabytes of disk space. A kernel memory dump fi le takes longer to create than a small
dump fi le and thus increases the downtime associated with a system failure. On most systems,
the increase in downtime is minimal.
Kernel memory dumps contain additional information that might assist troubleshooting.
When a Stop error occurs, Windows saves a kernel memory dump fi le to a fi le named
%SystemRoot%\Memory.dmp and creates a small memory dump fi le in the
%SystemRoot%\Minidump folder.
A kernel memory dump fi le records only kernel memory information, which expedites
the dump fi le creation process. The kernel memory dump fi le does not include unallocated
memory or any memory allocated to user-mode programs. It includes only memory allocated
to the Executive, kernel, Hardware Abstraction Layer (HAL), and fi le system cache, in addition
to nonpaged pool memory allocated to kernel-mode drivers and other kernel-mode routines.
The size of the kernel memory dump fi le will vary, but it is always less than the size of the
system memory. When Windows creates the dump fi le, it fi rst writes the information to the
paging fi le. Therefore, the paging fi le might grow to the size of the physical memory. Later,
the dump fi le information is extracted from the paging fi le to the actual memory dump fi le.
To ensure that you have suffi cient free space, verify that the system drive would have free
Z06A627093.indd 604Z06A627093.indd 604 2/8/2010 12:02:17 PM2/8/2010 12:02:17 PM
Memory Dump Files APPENDIX F 605
space greater than the size of physical memory if the paging fi le were extended to the size
of physical memory. Although you cannot exactly predict the size of a kernel memory dump
fi le, a good rule of thumb is that roughly 50 MB to 800 MB, or one-third the size of physical
memory, must be available on the boot volume for the paging fi le.
For most purposes, a kernel memory dump fi le is suffi cient for troubleshooting Stop errors.
It contains more information than a small memory dump fi le and is smaller than a complete
memory dump fi le. It omits those portions of memory that are unlikely to have been involved
in the problem. However, some problems do require a complete memory dump fi le for
troubleshooting.
NOTE By default, a new kernel memory dump fi le overwrites an existing one. To change
the default setting, clear the Overwrite Any Existing File check box. You can also rename or
move an existing dump fi le prior to troubleshooting.
Confi guring Complete Memory Dump Files
A complete memory dump fi le, sometimes referred to as a full dump fi le, contains everything
that was in physical memory when the Stop error occurred. This includes all the information
included in a kernel memory dump fi le, plus user-mode memory. Therefore, you can examine
complete memory dump fi les to fi nd the contents of memory contained within applications,
although this is rarely necessary or feasible when troubleshooting application problems.
If you choose to use complete memory dump fi les, you must have available space on the
systemdrive partition large enough to hold the contents of the physical RAM. Additionally,
you must have a paging fi le equal to the size of your physical RAM.
When a Stop error occurs, the operating system saves a complete memory dump fi le to
a fi le named %SystemRoot%\Memory.dmp and creates a small memory dump fi le in the
%SystemRoot%\Minidump folder. A Microsoft technical support engineer might ask you to
change this setting to facilitate data uploads over slow connections. Depending on the speed
of your Internet connection, uploading the data might not be practical, and you might be
asked to provide the memory dump fi le on removable media.
NOTE By default, new complete memory dump fi les overwrite existing fi les. To change
this, clear the Overwrite Any Existing File check box. You can also choose to archive or
move a dump fi le prior to troubleshooting.
How to Manually Initiate a Stop Error
and Create a Dump File
To be absolutely certain that a dump fi le will be created when a Stop error occurs, you can
manually initiate a Stop error by creating a registry value and pressing a special sequence of
characters. After Windows restarts, you can verify that the dump fi le was correctly created.
To initiate a crash dump manually, follow these steps:
1. Click Start and type Regedit. On the Start menu, right-click Regedit and click Run As
Administrator. Respond to the User Account Control (UAC) prompt that appears.
NO
T
E
By default, a new kernel memory dump fi le overwrites an existing one. To change
E
the default settin
g
, clear the Overwrite An
y
Existin
g
File check box. You can also rename or
move an existing dump
fi
le prior to troubleshooting.
N
OT
E
By default, new complete memory dump fi les overwrite existing fi les. To change
E
this, clear the Overwrite An
y
Existin
g
File check box. You can also choose to archive or
move a dump fi le prior to troubleshooting.
Z06A627093.indd 605Z06A627093.indd 605 2/8/2010 12:02:17 PM2/8/2010 12:02:17 PM
606 APPENDIX F Troubleshooting Stop Messages
2. In the Registry Editor, navigate to HKEY_LOCAL_MACHINE\SYSTEM\CurrentControlSet\
Services\i8042prt\Parameters.
3. On the Edit menu, click New, DWORD (32-bit) Value, and then add the following
registry value:
■
Value Name: CrashOnCtrlScroll
■
Value: 1
4. Close the Registry Editor and then restart the computer.
5. Log on to Windows. While holding down the right Ctrl key, press the Scroll Lock key
twice to initiate a Stop error.
You cannot manually initiate a Stop error on a virtual machine that has virtual machine
extensions installed.
Using Memory Dump Files to Analyze Stop Errors
Memory dump fi les record detailed information about the state of your operating system
when the Stop error occurred. You can analyze memory dump fi les manually by using
debugging tools or by using automated processes provided by Microsoft. The information
you obtain can help you understand more about the root cause of the problem.
You can use WER to upload your memory dump fi le information to Microsoft. You can also
use the following debugging tools to analyze your memory dump fi les manually:
■
Microsoft Kernel Debugger (Kd.exe)
■
Microsoft WinDbg Debugger (WinDbg.exe)
You can view information about the Stop error in the System Log after a Stop error occurs.
For example, the following information event (with a source of Bugcheck and an Event ID
of 1001) indicates that a 0xFE Stop error occurred.
The computer has rebooted from a bugcheck. The bugcheck was: 0x000000fe (0x00000008,
0x00000006, 0x00000001, 0x87b1e000). A dump was saved in: C:\Windows\MEMORY.DMP.
Using Windows Error Reporting
When enabled, the WER service monitors your operating system for faults related to
operating system features and applications. By using the WER service, you can obtain more
information about the problem or condition that caused the Stop error.
When a Stop error occurs, Windows displays a Stop message and writes diagnostic
information to the memory dump fi le. For reporting purposes, the operating system also
saves a small memory dump fi le. The next time you start your system and log on to Windows
as Administrator, WER gathers information about the problem and performs the following
actions:
1. Windows displays the Windows Has Recovered From An Unexpected Shutdown dialog
box, as shown in Figure F-3. To view the Stop error code, operating system information,
and dump fi le locations, click View Problem Details. Click Check For Solution to submit the
minidump fi le information and possibly several other temporary fi les to Microsoft.
Z06A627093.indd 606Z06A627093.indd 606 2/8/2010 12:02:17 PM2/8/2010 12:02:17 PM
Memory Dump Files APPENDIX F 607
FIGURE F-3 Windows prompts you to check for a solution after recovering from a Stop error.
2. You might be prompted to collect additional information for future errors. If
prompted, click Enable Collection, as shown in Figure F-4.
FIGURE F-4 Windows might prompt you to collect additional information for future error reports.
3. You might also be prompted to enable diagnostics. If prompted, click Turn On
Diagnostics, as shown in Figure F-5.
FIGURE F-5 Windows might prompt you to enable diagnostics to gather more troubleshooting
information.
4. If prompted to send additional details, click View Details to review the additional
information being sent. Then, click Send Information.
5. If prompted to automatically send more information about future problems, choose
Yes or No.
6. When a possible solution is available, Action Center displays an icon in the system tray
with a notifi cation message.
7. Open Action Center to view the solution. Alternatively, you can search for View All
Problem Reports in Control Panel.
Z06A627093.indd 607Z06A627093.indd 607 2/8/2010 12:02:17 PM2/8/2010 12:02:17 PM
608 APPENDIX F Troubleshooting Stop Messages
If WER does not identify the source of an error, you might be able to determine that a
specifi c driver caused the error by using a debugger, as described in the next section.
Using Symbol Files and Debuggers
You can also analyze memory dump fi les by using a kernel debugger. Kernel debuggers are
primarily intended to be used by developers for in-depth analysis of application behavior.
However, kernel debuggers are also useful tools for administrators troubleshooting Stop
errors. In particular, kernel debuggers can be used to analyze memory dump fi les after a Stop
error has occurred.
A debugger is a program that users with the Debug Programs user right (by default, only
the Administrators group) can use to step through software instructions, examine data, and
check for certain conditions. The following two examples of kernel debuggers are installed by
installing Debugging Tools For Windows:
■
Kernel Debugger Kernel Debugger (Kd.exe) is a command-line debugging tool that
you can use to analyze a memory dump fi le written to disk when a Stop message
occurs. Kernel Debugger requires that you install symbol fi les on your system.
■
WinDbg Debugger WinDbg Debugger (WinDbg.exe) provides functionality similar to
Kernel Debugger, but it uses a graphical user interface (GUI).
Both tools allow users with the Debug Programs user right to analyze the contents of a
memory dump fi le and debug kernel-mode and user-mode programs and drivers. Kernel
Debugger and WinDbg Debugger are just a few of the many tools included in the Debugging
Tools For Windows installation. For more information about these and other debugging tools
included with Debugging Tools For Windows, see Help in Debugging Tools For Windows.
To use WinDbg to analyze a crash dump, fi rst install the debugging tools available at
To gather the most information from a memory dump fi le, provide the debugger access to
symbol fi les. The debugger uses symbol fi les to match memory addresses to human-friendly
module and function names. The simplest way to provide the debugger access to symbol fi les
is to confi gure the debugger to access the Microsoft Internet-connected symbol server.
To confi gure the debugger to use the Microsoft symbol server, follow these steps:
1. Click Start, point to All Programs, point to Debugging Tools For Windows, right-click
WinDbg, and then click Run As Administrator.
2. Select Symbol File Path from the File menu.
3. In the Symbol Path box, type
SRV*localpath*
where localpath is a path on the hard disk that the debugger will use to store the
downloaded symbol fi les. The debugger will automatically create localpath when you
analyze a dump fi le.
For example, to store the symbol fi les in C:\Websymbols, set the symbol fi le path to
“SRV*c:\websymbols*
Z06A627093.indd 608Z06A627093.indd 608 2/8/2010 12:02:17 PM2/8/2010 12:02:17 PM
Memory Dump Files APPENDIX F 609
4. Click OK.
Debuggers do not require access to symbol fi les to extract the Stop error number
and parameters from a memory dump fi le. Often, the debugger can also identify the
source of the Stop error without access to symbols.
NOTE You can also download symbol fi les for offl ine use from />whdc/devtools/debugging/.
To analyze a memory dump fi le, follow these steps:
1. Click Start, point to All Programs, point to Debugging Tools For Windows, right-click
WinDbg, and then click Run As Administrator.
2. Select Open Crash Dump from the File menu.
3. Type the location of the memory dump fi le and then click Open. By default, this
location is %SystemRoot%\Memory.dmp.
4. In the Save Workspace Information dialog box, click No.
5. Select the Command window.
As shown in Figure F-6, the Bugcheck line tells you the Stop error number. The Probably
Caused By line indicates the fi le that was being processed at the time of the Stop error.
FIGURE F-6 WinDbg displays the Stop error code and the driver that caused the Stop error.
The Command window displays feedback from the debugger and allows you to issue
additional commands. When a crash dump is opened, the Command window automatically
displays the output of the !analyze command. In many cases, this default information is
suffi cient to isolate the cause of the Stop error.
N
OT
E
You can also download symbol fi les for offl ine use from
E
h
tt
p
://www.microsoft.com
/
whdc/devtools/debugging/
/
/
Z06A627093.indd 609Z06A627093.indd 609 2/8/2010 12:02:17 PM2/8/2010 12:02:17 PM
610 APPENDIX F Troubleshooting Stop Messages
If the default analysis does not provide all the information you need for troubleshooting,
run the following command in the Command window.
!analyze –v
This command will display the stack, which contains a list of method calls preceding the
Stop error. This might give clues to the source of a Stop error. For example, the following
stack trace output, created by calling !analyze –v, correctly indicates that the Stop error was
related to the removal of a universal serial bus (USB) device, as shown by the bold text.
STACK_TEXT:
WARNING: Frame IP not in any known module. Following frames may be wrong.
ba4ffb2c ba26c6ff 89467df0 68627375 70646f52 0x8924ed33
ba4ffb5c ba273661 88ffade8 8924eae0 89394e48 usbhub!USBH_PdoRemoveDevice+0x41
ba4ffb7c ba26c952 88ffaea0 89394e48 00000002 usbhub!USBH_PdoPnP+0x5b
ba4ffba0 ba26a1d8 01ffaea0 89394e48 ba4ffbd4 usbhub!USBH_PdoDispatch+0x5a
ba4ffbb0 804eef95 88ffade8 89394e48 88eac2e0 usbhub!USBH_HubDispatch+0x48
ba4ffbc0 ba3f2db4 88eac228 88eac2e0 00000000 nt!IopfCallDriver+0x31
ba4ffbd4 ba3f4980 88eac228 89394e48 89394e48 USBSTOR!USBSTOR_FdoRemoveDevice+0xac
ba4ffbec b9eed58c 88eac228 89394e48 89394f48 USBSTOR!USBSTOR_Pnp+0x4e
Being Prepared for Stop Errors
Some useful software- and hardware-related techniques can help you prepare for Stop errors
when they occur. Stop messages do not always pinpoint the root of the problem, but they
do provide important clues that you or a trained support technician can use to identify and
troubleshoot the cause.
Prevent System Restarts After a Stop Error
When a Stop error occurs, Windows displays a Stop message related to the problem. By
default, Windows automatically restarts after a Stop error occurs unless the system becomes
unresponsive. If Windows restarts your system immediately after a Stop error occurs, you
might not have enough time to record Stop message information that can help you analyze
the cause of a problem. Additionally, you might miss the opportunity to change startup
options or start the operating system in safe mode.
Disabling the default restart behavior allows you to record Stop message text, information
that can help you analyze the root cause of a problem if memory dump fi les are not
accessible. To disable the Automatically Restart option, follow these steps:
1. Click Start, right-click Computer, and then select Properties.
2. Click Advanced System Settings.
3. In the System Properties dialog box, click the Advanced tab. Then, under Startup
And Recovery, click Settings.
4. In the System Failure box, clear the Automatically Restart check box.
Z06A627093.indd 610Z06A627093.indd 610 2/8/2010 12:02:17 PM2/8/2010 12:02:17 PM
Being Prepared for Stop Errors APPENDIX F 611
If you cannot start your computer in normal mode, you can perform the preceding steps
in safe mode.
Record and Save Stop Message Information
With the automatic restart behavior disabled, you must restart your computer manually
after a Stop message appears. Stop messages provide diagnostic information, such as Stop
error numbers and driver names, which you can use to resolve the problem. However, this
information disappears from the screen when you restart your computer. Generally, you can
retrieve this information after the system is restarted by examining the memory dump fi le, as
described in the section titled “Using Memory Dump Files to Analyze Stop Errors” earlier in this
appendix. In some situations, Stop error information is not successfully logged; therefore, it is
important to record the information displayed in the Stop message for future reference. Before
restarting the system, take the following actions to ensure that you have saved important
information, which you can refer to when using the resources listed in this appendix.
To record and save Stop message information, follow these steps:
1. Record data that is displayed in the Technical Information and Driver Information
sections of the Stop message for later reference. These sections are described in the
section titled “Stop Messages” earlier in this appendix.
2. Record and evaluate suggestions in the Recommended User Action section. Stop
messages typically provide troubleshooting tips relevant to the error.
3. Check the Debug Port and Dump File Status sections to verify that Windows
successfully created a memory dump fi le.
4. If a memory dump fi le does exist, copy the fi le to removable media, another disk
volume, or a network location for safekeeping. You can use Startup Repair to copy the
dump fi le if you are not able to start Windows in normal mode or safe mode.
Analyzing memory dump fi les can assist you with identifying root causes by providing you
with detailed information about the system state when the Stop error occurred. By following
the preceding steps, you can save important information that you can refer to when using
the resources listed in the section titled “Stop Messages” earlier in this appendix. For more
information about creating and analyzing memory dump fi les, see the section titled “Memory
Dump Files” earlier in this appendix.
Check Software Disk Space Requirements
Verify that adequate free space exists on your disk volumes for virtual memory paging
fi les and application data fi les. Insuffi cient free space might cause Stop errors and other
symptoms, including disk corruption. To determine the amount allocated to paging fi les, see
the section titled “Memory Dump Files” earlier in this appendix.
You can move, delete, or compress unused fi les manually or by using Disk Cleanup to
increase free space on disk volumes.
Z06A627093.indd 611Z06A627093.indd 611 2/8/2010 12:02:17 PM2/8/2010 12:02:17 PM
612 APPENDIX F Troubleshooting Stop Messages
To run Disk Cleanup, click Start, type Cleanmgr, and then press Enter. Follow the prompts
to increase free disk space on your system drive. Note that Disk Cleanup provides you with
the option to delete memory dump fi les.
Install a Kernel Debugger and Symbol Files
You can use a kernel debugger to gather more information about the problem. For more
information about installing and using debugging tools, see the section titled “Using Memory
Dump Files to Analyze Stop Errors” earlier in this appendix.
Hardware Malfunction Messages
Stop messages also take the form of hardware malfunction messages. Like all Stop messages,
they are displayed in non-windowed text mode. These Stop messages occur after the
processor detects a hardware malfunction; the fi rst one or two lines of the message contain
a description. The error description typically points to a hardware problem, as shown in this
example.
Hardware malfunction.
Call your hardware vendor for support.
Prior to proceeding with the recommendation provided by the message, it is best to
contact the manufacturer for technical support. Record the information displayed after the
fi rst two lines of the message, which might prove useful to the support technician.
Under certain circumstances, driver problems can generate Stop messages that appear to
be related to a hardware malfunction. For example, if a driver writes to the wrong I/O port,
the device at the destination port might respond by generating a hardware malfunction
message. Errors of this kind, which are typically detected and debugged in advance of public
release, underscore the need to periodically check for updated drivers.
Stop Message Checklist
Stop messages provide diagnostic information, such as Stop codes and driver names, that you
can use to resolve the problem. However, this information disappears when you restart your
computer. Therefore, for future reference, it is important to record the information displayed.
When a Stop message appears, follow these steps before restarting the system:
1. Record any data found in the Bugcheck Information and Driver Information sections
for future reference.
2. Record and evaluate suggestions found in the Recommended User Action section.
Stop messages typically provide troubleshooting tips relevant to the error.
Z06A627093.indd 612Z06A627093.indd 612 2/8/2010 12:02:17 PM2/8/2010 12:02:17 PM