Báo cáo y học: "Amino acid racemization reveals differential protein turnover in osteoarthritic articular and meniscal cartilages" docx
Bạn đang xem bản rút gọn của tài liệu. Xem và tải ngay bản đầy đủ của tài liệu tại đây (430.28 KB, 9 trang )
Open Access
Available online />Page 1 of 9
(page number not for citation purposes)
Vol 11 No 2
Research article
Amino acid racemization reveals differential protein turnover in
osteoarthritic articular and meniscal cartilages
Thomas V Stabler
1
, Samuel S Byers
2
, Robert D Zura
3
and Virginia Byers Kraus
1
1
Department of Medicine, Duke University Medical Center, Box 3416, Durham, NC 27710, USA
2
Department of Dentistry, Case Western Reserve University, 10900 Euclid Avenue, Cleveland, OH 44104, USA
3
Department of Surgery, Duke University Medical Center, Box 3205, Durham, NC 27710, USA
Corresponding author: Thomas V Stabler,
Received: 1 May 2008 Revisions requested: 29 May 2008 Revisions received: 24 Dec 2008 Accepted: 6 Mar 2009 Published: 6 Mar 2009
Arthritis Research & Therapy 2009, 11:R34 (doi:10.1186/ar2639)
This article is online at: />© 2009 Stabler et al.; licensee BioMed Central Ltd.
This is an open access article distributed under the terms of the Creative Commons Attribution License ( />),
which permits unrestricted use, distribution, and reproduction in any medium, provided the original work is properly cited.
Abstract
Introduction Certain amino acids within proteins have been
reported to change from the
L form to the D form over time. This
process is known as racemization and is most likely to occur in
long-lived low-turnover tissues such as normal cartilage. We
hypothesized that diseased tissue, as found in an osteoarthritic
(OA) joint, would have increased turnover reflected by a
decrease in the racemized amino acid content.
Methods Using high-performance liquid chromatography
methods, we quantified the
L and D forms of amino acids
reported to racemize in vivo on a biological timescale: alanine,
aspartate (Asp), asparagine (Asn), glutamate, glutamine,
isoleucine, leucine (Leu), and serine (Ser). Furthermore, using a
metabolically inactive control material (tooth dentin) and a
control material with normal metabolism (normal articular
cartilage), we developed an age adjustment in order to make
inferences about the state of protein turnover in cartilage and
meniscus.
Results In the metabolically inactive control material (n = 25,
ages 13 to 80 years) and the normal metabolizing control
material (n = 19, ages 17 to 83 years), only Asp + Asn (Asx),
Ser, and Leu showed a significant change (increase) in
racemization with age (P < 0.01). The age-adjusted proportions
of racemized to total amino acid (
D/D+L expressed as a
percentage of the control material) for Asx, Ser, and Leu when
compared with the normal articular cartilage control were 97%,
74%, and 73% in OA meniscal cartilage and 97%, 70%, and
78% in OA articular cartilage. We also observed lower amino
acid content in OA articular and meniscal cartilages compared
with normal articular cartilage as well as a loss of total amino
acids with age in the OA meniscal but not the OA articular
cartilage.
Conclusions These data demonstrate comparable anabolic
responses for non-lesioned OA articular cartilage and OA
meniscal cartilage but an excess of catabolism over anabolism
for the meniscal cartilage.
Introduction
Amino acids, with the exception of glycine, can occur in two
stereoisomeric forms:
D and L. However, only the L forms are
incorporated into mammalian proteins. Certain
L amino acids
within proteins are prone to racemization over time [1]. In pro-
teins with low turnover, this racemization leads to an age-
dependent increase of
D amino acids. Racemization has been
observed in a variety of human tissues, including cartilage,
lens, brain, lung, aorta, skin, tooth, and bone [2-10]. In non-
metabolizing tissues, racemization, as reflected by the
D/D+L
aspartate (Asp) ratio, increases linearly with age. All methods
of
D and L Asp measurement involve high-temperature acid
hydrolysis that induces a certain time- and temperature-
dependent background racemization; this hampers the ready
comparison of results across studies. However, successful
management of background variability is possible by employ-
ing a precise experimental protocol for all samples.
Tissue catabolism alone leads to no apparent change in the
rate of
D amino acid accumulation and would be manifested as
a linear increase of tissue
D/D+L amino acid content per unit of
tissue mass over time with age. This would be analogous to
cutting off a wedge of cheese from a large wheel, which would
not affect the properties of the remaining portion. Alternatively,
an increase in tissue anabolism alone should lead to no
change in the age-related rate of
D amino acid accumulation
Ala: alanine; ANOVA: analysis of variance; Asn: asparagine; Asp: aspartate; Asx: asparagine + aspartate; Gln: glutamine; Glu: glutamate; Glx: gluta-
mate + glutamine; HPLC: high-performance liquid chromatography; Ile: isoleucine; Leu: leucine; OA: osteoarthritic; Ser: serine.
Arthritis Research & Therapy Vol 11 No 2 Stabler et al.
Page 2 of 9
(page number not for citation purposes)
but a reduction in the rate of D/D+L amino acid accumulation
per unit of tissue mass due to additions of newly synthesized
L amino acids. The combination of catabolism and anabolism
could lead to the replacement of
D amino acids for L amino
acids, resulting in a reduction of the rate of
D/D+L amino acid
accumulation. Thus, a study of the changes in protein aging
within a tissue, reflected by racemization rates and quantities
of racemized material, has the potential to yield valuable
insights into tissue turnover and the condition of molecules
that are being released into the general circulation as biomar-
kers of a given disease process. Moreover, the quantification
of 'aged' circulating biochemical markers, which we call
'biomarker dating', might further improve their predictive capa-
bilities for pathological tissue turnover states.
The purpose of this study was to examine protein turnover of
osteoarthritic (OA) articular hyaline cartilage and meniscal
fibrocartilage compared with normal articular hyaline cartilage
through the analysis of racemization of Asp, asparagine (Asn),
glutamate (Glu), glutamine (Gln), serine (Ser), alanine (Ala),
leucine (Leu), and isoleucine (Ile). To validate our method, we
also examined racemization of these amino acids in human
dentin, a tissue shown by radiochemical methodology to be
metabolically inactive and hence not subject to protein turno-
ver [11]. The control materials (normal articular hyaline carti-
lage and tooth dentin) provided benchmarks for comparison of
racemization rates since they had the same inherent back-
ground. Moreover, we have innovated the application of age-
adjusted racemization data, based upon control values, to
compare metabolism rates across tissues and amino acids.
These data further underscored the benefit and utility of
including a range of age-matched non-metabolizing controls in
any study of the racemization of metabolizing tissue.
Materials and methods
Tissue procurement
According to the institutional review boards at Duke University
Medical Center (Durham, NC, USA) and Case Western
Reserve University (Cleveland, OH, USA), our protocol for
using anonymous waste tissue met the definition of research
not involving human subjects and satisfied the Privacy Rule.
Osteoarthritic knee joint tissue preparation
Surgical waste tissues were obtained from 30 osteoarthritis
patients who were undergoing total knee joint replacement at
Duke University Medical Center. Ages ranged from 43 to 85
years, and there were 17 females and 13 males. Articular and
meniscal cartilages were isolated from sections of the joint
which showed no apparent macroscopic damage. Tissues
were frozen at -80°C until analysis.
Normal cartilage tissue preparation
Surgical waste tissues from acute joint trauma and human
cadaveric normal articular cartilages were obtained from 19
subjects through Duke University Medical Center and the
National Disease Research Interchange (Philadelphia, PA,
USA). Ages ranged from 17 to 83 years, and there were 13
males and 6 females. Normal cartilage was defined as carti-
lage from subjects with no joint disease of any kind. Tissues
were frozen at -80°C until analysis.
Tooth root dentin preparation
Non-deciduous teeth (molars) were obtained as surgical
waste tissue from 25 individuals (13 females and 12 males)
undergoing tooth extraction, with ages ranging from 13 to 80
years. The roots were separated from the crown, cleaned, ster-
ilized with bleach, and then demineralized at room temperature
in a solution of 0.5 M EDTA (ethylenediaminetetraacetic acid)
for approximately 3 months with one change of solution during
that time. Root dentin was dissected out from the demineral-
ized tooth, and great care was taken to exclude pulp and
enamel.
Sample hydrolysis
The articular and meniscal cartilages and dentin samples were
first pulverized under liquid nitrogen using a Bio-Pulverizer
(BioSpec Products Inc., Bartlesville, OK, USA), followed by
homogenization in cold 6 M HCl for 3 minutes using a Mini-
Beadbeater-8 (BioSpec Products Inc.). Samples were imme-
diately transferred to glass tubes and adjusted to a final con-
centration of 20 mg of tissue per milliliter of 6 M HCl. All
proteins in the samples were hydrolyzed into their individual
amino acids by heating for 8 hours at 105°C, followed by rapid
neutralization on ice with 6 N NaOH. The hydrolyzed samples
were stored at -80°C until analysis. We found in preliminary
studies (data not shown) that the acid hydrolysis procedure
induced racemization and that the rate of this methodologically
induced racemization was dependent on not only time and
temperature, but also the amount of tissue. Rather than use a
correction factor for this artifactual racemization, we chose to
exercise great care in treating all samples identically in regard
to time, temperature, and amount of tissue used and to report
the values without correction.
Amino acid derivatization
The amino acids within the hydrolyzed samples were deriva-
tized using a previously described method [12]. Specifically,
10 L of the neutralized sample hydrolysate, to which 10 L of
an internal standard had been added, was buffered with 155
L of 0.4 M boric acid (pH 9.0), followed by the addition of 25
L of derivatization reagent. The derivatization reagent con-
sisted of 20 mg/mL each of o-phthaldialdehyde and N-tertiary-
butyloxycarbonyl-
L-cysteine, both purchased from Sigma-
Aldrich (St. Louis, MO, USA) and made fresh daily in methanol.
Samples were mixed, and after a 1-minute incubation, the
resulting fluorescent diasterioisomeric isoindolyl derivatives
were separated and quantified using reversed-phase high-per-
formance liquid chromatography (HPLC).
Available online />Page 3 of 9
(page number not for citation purposes)
High-performance liquid chromatography analysis
We used the HPLC method of Hashimoto and colleagues [12]
with modifications. The HPLC system consisted of an
HP1090 II liquid chromatograph (Agilent Technologies Inc.,
Santa Clara, CA, USA) and a Jasco FP-1520 fluorescence
detector (Jasco Inc., Easton, MD, USA) set to an excitation of
344 nM and an emission of 443 nM. A Chromolith RP-18e
100 × 4.6 mm column (VWR International LLC, West Chester,
PA, USA) was used for the separation with an injection volume
of 20 L and a constant flow rate of 1 mL/minute. Two injec-
tions were required per sample with different mobile phases
and gradients. The separation of
D and L forms of Asp, Glu,
Ser, and Ala was accomplished using a mobile phase consist-
ing of 0.2 M acetic acid adjusted to a pH of 6.0 with NaOH
and acetonitrile. The acetonitrile gradient was as follows: ini-
tially 8%, increasing 0.2%/minute for the first 30 minutes,
0.33%/minute for the next 18 minutes, and 0.66%/minute for
the final 12 minutes for a concentration of acetonitrile of 28%
at 60 minutes. All mobile phases were degassed using helium
sparging. We found that the hydrolysis procedure converted
all
D and L Asn and Gln to D and L Asp and Glu. All results for
Asp and Glu are therefore measurements of Asp + Asn (Asx)
and Glu + Gln (Glx).
The separation of
D and L forms of Leu and Ile required substi-
tution of methanol for the acetonitrile and a methanol gradient
as follows: initially 35%, increasing 0.454%/minute for the first
55 minutes and then 3.33%/minute for the next 3 minutes to a
final concentration of methanol of 70% and holding at that
concentration for an additional 2 minutes. The time from deri-
vatization of sample to injection was kept constant at 5 min-
utes for all samples.
Several different concentrations of each individual
D and L
amino acid standard (Sigma-Aldrich) were run, and the result-
ing peak areas were used to construct calibration curves using
a linear regression model. These calibration curves were then
used to quantify the unknown samples.
The detection limit for this method, as defined by a peak height
of twice the baseline noise, was determined to be 0.005 nmol/
mg for all
D and L amino acids. The lowest level of D or L amino
acid detected within any sample (tooth, cartilage, or meniscus)
was 0.03 nmol/mg.
Statistical analysis
Analyses were performed using GraphPad Prism4 software
(GraphPad Software Inc., San Diego, CA, USA). Linear
regression was used to compare amino acid concentrations
and
D/D+L ratios versus age. Age-adjusted proportions of
racemized amino acids were calculated based on the dentin
control material as well as the normal articular cartilage mate-
rial in order to evaluate the relative turnover of articular carti-
lage versus individually matched meniscal cartilages,
assessed by paired t test, and to evaluate the relative turnover
of the various amino acids, assessed by analysis of variance
(ANOVA). A P value of less than 0.05 was considered statis-
tically significant.
Results
Analyses of dentin from non-deciduous teeth were performed
to determine the maximal rates of racemization with biological
aging for Asx, Glx, Ser, Ala, Leu, and Ile and thereby to deter-
mine the amino acids that might be of value for biomarker-dat-
ing purposes. We found the relative mean ratios of
D to total
(
D+L) amino acids in our control material (dentin) to be Asx >
Ser > Ala Glx > Leu > Ile (Table 1) (age-related rates of
accumulation by slope were Asx > Ser > Leu > Ala Glx > Ile).
However, only Asx, Ser, and Leu showed a significant increase
with age, thereby validating the analysis of these three amino
acids for the purposes of evaluating tissue turnover. Just as in
the dentin control, only Asx, Ser, and Leu showed a significant
increase with age in normal articular cartilage and with the
same rank order of age-related accumulation as for dentin (Asx
> Ser > Leu).
To measure the change in protein composition within articular
and meniscal cartilages, we first analyzed total amino acid con-
tent (amount of
D+L forms normalized to tissue wet weight) for
all six amino acids. In meniscal cartilage, the concentrations of
total Asx, Glx, Ser, Ala, Leu, and Ile all decreased significantly
with age. The mean amino acid content did not vary signifi-
cantly with age for normal or OA articular cartilage (Table 2).
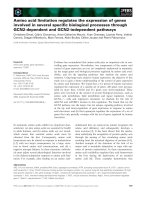
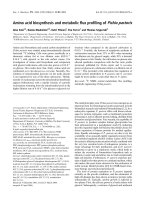
However, when the mean total amino acid contents between
age-matched normal articular cartilage and OA articular and
meniscal cartilages were compared, there was a significantly
lower mean concentration of each of the amino acids in the
OA cartilages (Figure 1).
We next analyzed the
D/D+L ratios of only those amino acids
that showed a significant change with age in the control mate-
rials (dentin and normal articular cartilage) (Table 1). Although
the complements of tissue proteins in teeth are different from
those in hyaline articular cartilage and meniscal fibrocartilage,
it is nevertheless possible across tissues to compare rates of
amino acid racemization as estimated by the
D/D+L ratio of
these amino acids in individuals of various ages. As for the
dentin control material and normal articular cartilage, the OA
cartilages (articular and meniscal) showed the same relative
rates of age-related racemization as the control tissues (Asx >
Ser > Leu). However, there was no significant age-related
accumulation of racemized amino acids in the OA cartilages
as there was for the normal cartilage.
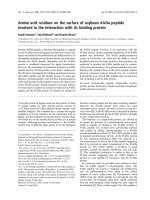
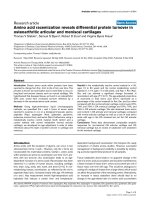
The age-related racemization (linear regression slopes) of
articular and meniscal cartilage extracellular matrix proteins (
D/
D+L ratio by age) was compared with the dentin standard.
Compared with Asx in dentin, joint tissue Asx racemized at
54% (normal articular cartilage), 14% (OA meniscal cartilage),
and 28% (OA articular cartilage) of the rate in dentin (Figure
Arthritis Research & Therapy Vol 11 No 2 Stabler et al.
Page 4 of 9
(page number not for citation purposes)
2). Compared with Ser in dentin, joint tissue Ser racemized at
60% (normal articular cartilage), 3% (OA meniscal cartilage),
and 26% (OA articular cartilage) of the rate in dentin. Com-
pared with Leu in dentin, joint tissue Leu racemized at 168%
(normal articular cartilage), -43% (OA meniscal cartilage), and
97% (OA articular cartilage) of the rate in dentin. The age-
related racemization (linear regression slope) of OA articular
cartilage and OA meniscal cartilage extracellular matrix pro-
teins (
D/D+L ratio by age) was also compared with the normal
articular cartilage using linear regression slopes. Compared
with Asx in normal articular cartilage, joint tissue racemized at
23% (OA meniscal cartilage) and 46% (OA articular cartilage)
of the rate in normal articular cartilage (Figure 2). Compared
with Ser in normal articular cartilage, joint tissue racemized at
5% (OA meniscal cartilage) and 38% (OA articular cartilage)
of the rate in normal articular cartilage. Compared with Leu in
normal articular cartilage, joint tissue racemized at -26% (OA
meniscal cartilage) and 52% (OA articular cartilage) of the rate
in normal articular cartilage.
Age-adjusted
D/D+L ratios for OA articular cartilage and OA
meniscal cartilage were derived using the regression equa-
tions of the lines for the amino acid in the dentin control mate-
rial and the normal articular cartilage control material as
standard curves (Figure 2). Specifically, age (x) of an articular
cartilage or meniscal cartilage sample was input into the equa-
tion (y = a + bx) to generate a theoretical maximal
D/D+L value
(y) for a non-metabolizing tissue (dentin) and a normally metab-
olizing tissue (normal articular cartilage). Measured
D/D+L was
then divided by this theoretical control value to give an age-
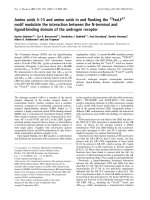
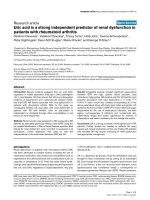
adjusted percentage of control. The age-adjusted proportions
of racemized amino acids (
D/D+L expressed as a percentage
of the control material) were compared using paired t analysis
between OA articular cartilage and matched OA meniscal car-
tilage (Figure 3). An age-adjusted
D/D+L ratio of 100% would
indicate a maximal rate of racemization for that amino acid
when compared with dentin and, in our interpretation, would
represent no tissue turnover. An age-adjusted
D/D+L ratio of
100% when compared with normal articular cartilage would
represent normal tissue turnover. Values of less than 100%
Table 1
Association of
D/D+L amino acid ratios with age in tooth dentin, normal cartilage, and paired osteoarthritic articular and meniscal
cartilages
Amino acid
Asx Ser Leu Ile Glx Ala
Tooth
dentin
Mean D/D+L ratio 0.0599 0.0198 0.0105 0.0077 0.0137 0.0135
r
2
0.961 0.827 0.349 0.018 0.014 0.002
Slope e-10
5
65.2 30.5 6.9 -3.4 0.5 0.6
P value <0.0001
a
<0.0001
a
0.0019
a
0.5246 0.5740 0.8497
Normal articular cartilage Mean D/D+L ratio 0.0463 0.0142 0.0117 0.0125 0.0125 0.0283
r
2
0.778 0.470 0.287 0.060 0.194 0.001
Slope e-10
5
35.2 18.4 11.6 0.7 2.3 -0.6
P value <0.0001
a
0.0012
a
0.0181
a
0.3136 0.0590 0.9410
OA
articular cartilage
Mean D/D+L ratio 0.0506 0.0120 0.0105
r
2
0.126 0.173 0.053
Slope e-10
5
16.0 7.0 6.0
P value 0.081 0.055 0.221
OA
meniscal cartilage
Mean D/D+L ratio 0.0506 0.0127 0.0099
r
2
0.021 0.002 0.0099
Slope e-10
5
8.0 1.0 -3.0
P value 0.442 0.802 0.595
Dentin: n = 25 human tooth samples from subjects ranging in age from 13 to 80 years. Normal cartilage: n = 19 human surgical waste and
autopsy samples from subjects ranging in age from 17 to 83 years. Osteoarthritic (OA) articular and meniscal cartilages: n = 30 paired human
surgical waste samples from subjects ranging in age from 43 to 85 years.
a
Denotes significant age-related increase at P < 0.05. Ala, alanine; Asx,
asparagine + aspartate; Glx, glutamate + glutamine; Ile, isoleucine; Leu, leucine; Ser, serine.
Available online />Page 5 of 9
(page number not for citation purposes)
are taken as an indicator of increased amino acid turnover rel-
ative to the control. Whether adjusted to dentin or normal artic-
ular cartilage, the age-adjusted
D/D+L ratios in OA articular
cartilage were similar (P > 0.05) to those of OA meniscal car-
tilage; however, these ratios differed significantly by amino
acid when compared by ANOVA (P < 0.0001). Bonferroni
post test showed significant differences (P < 0.001) between
all three amino acids (Asx, Ser, and Leu), demonstrating accel-
erated turnover for Ser and Leu in OA cartilages compared
with normal cartilage.
Discussion
We found significant age-dependent accumulation of D amino
acids (slight increase in
D/D+L ratio) in a metabolically inactive
control material (dentin) as well as in a control material with
normal metabolism (normal articular cartilage) to be Asx > Ser
> Leu, with no age-dependent accumulation seen for Ile, Glx,
or Ala, even though measurable amounts of the
D and L forms
of all six amino acids were present in all samples. We therefore
could not confirm previous reports of measurable age-related
racemization of all six amino acids during the timescale of
human biological aging [13,14]. The presence of readily meas-
urable amounts of these amino acids in dentin and normal
articular cartilage rules out scarcity of a particular amino acid
in these tissues as a confounding factor. The strong correla-
tions in dentin of Asx (r
2
= 0.961) and Ser (r
2
= 0.8266) with
age were in agreement with a previous report [15] and verify
the utility of our method for measuring protein aging and turn-
over in biological materials.
The significant age-related differential accumulation of
D
amino acids (slight increase in D/D+L ratio) we observed in
normal articular cartilage (Asx > Ser > Leu) was somewhat
similar to other reports in that Asx was greater than Ser or Leu
[13,14]. For instance, in one previous report, the differential
rates of accumulation of the
D forms in proteins, as measured
by the
D/D+L ratio, were previously reported as Asx > Glx >
Ser > Ala > other amino acids (tyrosine and histidine) [13]. For
bone, artificially aged using either elevated temperatures or
fossil bones, the rates were found to be Asp > Ala Glu > Leu
Ӎ Ile [14]. The negative rate of racemization we observed for
Leu in OA meniscal cartilage when compared with dentin or
normal articular cartilage is likely due to the much weaker cor-
relation of this particular amino acid with age. While still signif-
icant, the correlation of Leu with age was much weaker than
for Asx or Ser.
The age-related accumulation of
D-Asx we observed in normal
articular cartilage (
D/D+L versus age, r
2
= 0.778) is consistent
with previous reports [2,3,10] describing a strong association
of
D-Asp with age in normal articular cartilage (r
2
= 0.903) and
normal rib cartilage (r
2
= 0.58 to 0.94) but stands in contrast
to a recent report [16] showing very little association with age
(r
2
= 0.123) in normal articular cartilage. The results of this last
study are perhaps not surprising given the fact that it evaluated
only
D-Asp versus age, instead of the ratio of either D/L or D/
D+L, which are the accepted methods of comparison in the lit-
erature. The age-related rate of racemization (slope of
D/D+L
versus age) we observed for Asx from normal articular carti-
lage was 35% higher than previously reported for healthy unaf-
fected articular cartilage [2]. This difference is possibly due to
Table 2
Change in total (L+D) amino acid composition with age in normal cartilage, osteoarthritic articular, and meniscal cartilages
Amino acid
Asx Ser Leu Ile Glx Ala
Normal articular cartilage Mean (nmol/mg) 157.3 104.8 87.4 37.2 252.5 262
r
2
0.054 0.037 0.042 0.065 0.060 0.090
Slope -0.456 -0.233 -0.203 -0.120 -0.796 -1.040
P value 0.327 0.418 0.399 0.293 0.297 0.198
OA articular cartilage Mean (nmol/mg) 99.5 67.7 56.0 23.2 159.1 165.7
r
2
0.076 0.070 0.028 0.081 0.056 0.059
Slope 0.419 0.278 0.237 0.196 0.532 0.645
P value 0.141 0.157 0.377 0.129 0.208 0.196
OA meniscal cartilage Mean (nmol/mg) 100.4 74.6 53.4 23.7 140.5 180.4
r
2
0.208 0.194 0.143 0.144 0.194 0.232
Slope -1.11 -0.78 -1.06 -0.458 -1.59 -2.57
P value 0.011
a
0.015
a
0.040
a
0.039
a
0.015
a
0.007
a
Composition is presented in nanomoles per milligram of tissue wet weight.
a
Denotes significant value. Ala, alanine; Asx, asparagine + aspartate;
Glx, glutamate + glutamine; Ile, isoleucine; Leu, leucine; OA, osteoarthritic; Ser, serine.
Arthritis Research & Therapy Vol 11 No 2 Stabler et al.
Page 6 of 9
(page number not for citation purposes)
differences in the relative health of the cartilages used for the
studies. Our normal articular cartilages were derived from non-
arthritic joints at the time of autopsy or surgical repair for acute
trauma. Another possible contributor to this difference is the
hydrolysis procedure, which underscores the need for includ-
Figure 1
Differences in mean total amino acids
D+L (nmol/mg + standard deviation) between normal articular cartilage (n = 12 age-matched samples), paired osteoarthritic (OA) articular cartilages (n = 30), and OA meniscal cartilages (n = 30)Differences in mean total amino acids D+L (nmol/mg + standard deviation) between normal articular cartilage (n = 12 age-matched samples), paired
osteoarthritic (OA) articular cartilages (n = 30), and OA meniscal cartilages (n = 30). The normal tissue was age-matched to the OA tissues. Analy-
sis of variance results were P < 0.0001 for asparagine + aspartate (Asx), glutamate + glutamine (Glx), serine (Ser), and alanine (Ala); P < 0.0005 for
leucine (Leu); and P = 0.0012 for isoleucine (Ile). Significance of change from normal cartilage by Bonferroni post test was *P < 0.01 and **P <
0.001. Light blue represents normal articular cartilage, purple represents OA articular cartilage, and pink represents OA meniscal cartilage.
Figure 2
Amino acid ratio
D/D+L versus age with selected regression lines from Table 1Amino acid ratio D/D+L versus age with selected regression lines from Table 1. (a) Asparagine + aspartate (Asx): dentin r
2
= 0.961, normal articular
cartilage r
2
= 0.778, osteoarthritic (OA) articular cartilage r
2
= 0.126, and OA meniscal cartilage r
2
= 0.021. (b) Serine (Ser): dentin r
2
= 0.827, nor-
mal articular cartilage r
2
= 0.470, OA articular cartilage r
2
= 0.173, and OA meniscal cartilage r
2
= 0.127. (c) Leucine (Leu): dentin r
2
= 0.349, nor-
mal articular cartilage r
2
= 0.287, OA articular cartilage r
2
= 0.053, and OA meniscal cartilage r
2
= 0.010. The four tissues studied are indicated by
regression line colors: dentin (dark blue), normal articular cartilage (light blue), OA articular cartilage (purple), and OA meniscal cartilage (pink).
Available online />Page 7 of 9
(page number not for citation purposes)
ing control material within a study of this type as well as the dif-
ficulty in comparing racemization rates between studies.
Interestingly, in our study, the total amino acid content (per mil-
ligram of tissue) of apparently undamaged OA articular
cartilage was 35% to 38% lower than that of normal age-
matched articular cartilage. This lower amino acid concentra-
tion in normal-appearing articular cartilage from an OA joint
could be due in part to increased water content from tissue
swelling coincident with a loss of collagen network integrity in
early OA. This is consistent with the increased water capacity
of proteoglycan when the collagen network is disrupted [17].
When considered along with the lack of correlation with age
for
D/D+L in OA cartilages, which manifests as a 48% to 62%
decrease in amino acid racemization rates when compared
with normal cartilage, this is compatible with known acceler-
ated turnover in seemingly normal regions of OA articular car-
tilage [18] and points to the significant changes that occur in
OA cartilage before damage becomes visually apparent.
Of great significance was the finding that the age-adjusted
Figure 3
Age-adjusted
D/D+L expressed as a percentage of the dentin control material and the normal articular cartilage control materialAge-adjusted D/D+L expressed as a percentage of the dentin control material and the normal articular cartilage control material. The paired t test
comparing osteoarthritic (OA) articular cartilage with OA meniscal cartilage was not significant. The analysis of variance result for asparagine +
aspartate (Asx), serine (Ser), and leucine (Leu) was P < 0.0001. The Bonferroni post test showed significant differences (P < 0.001) between all
three amino acids (Asx, Ser, and Leu). (a) Dentin as control (mean percentage of control + standard deviation). (b) Normal articular cartilage as con-
trol (mean percentage of control + standard deviation). Purple represents OA articular cartilage, and pink represents OA meniscal cartilage.
Table 3
Expected changes with age in total amino acid content (D+L) and amino acid racemization (D/D+L)
Total amino acid (
D+L)
with age
Ratio D/D+L
with age
Anabolism Slight increase Slight decrease
Catabolism No change Slight increase
Anabolism = Catabolism No change Slight decrease
Theoretical normal cartilage aging No change Moderate increase
Swelling and/or glycosaminoglycan increase Slight decrease No change
Normal articular cartilage results No change Moderate increase
Osteoarthritic articular cartilage results No change No change
Osteoarthritic meniscal cartilage results Slight decrease No change
Dentin results No change Large increase
Arthritis Research & Therapy Vol 11 No 2 Stabler et al.
Page 8 of 9
(page number not for citation purposes)
proportions of the D amino acids, Asx, Ser, and Leu, differed
by amino acid type. There are several possible interpretations
of these findings. For one, these various amino acids may
reflect different protein pools in articular and meniscal carti-
lages turning over at different rates. For instance, since there
are six times as many Ser residues in proteoglycan compared
with collagen II, the larger increase in Ser turnover could indi-
cate greatest turnover of this pool. This is consistent with a
previous report that showed a 60% decrease in the
D/L Asp
ratio in cartilage samples that were enzymatically depleted of
proteoglycan [19] and with a more detailed study that showed
that the majority of the
D-Asx accumulation in normal articular
cartilage occurred in the hyaluronan-binding domain of the
A1D1 fraction of proteoglycan [20]. Different age-adjusted
proportions of the
D amino acids may also vary from one
another as a result of hot spots for racemization affecting a
particular amino acid differentially.
In contrast to dentin, articular and meniscal cartilages undergo
protein turnover, so the apparent rates of racemization in these
tissues represent the net accumulation due to age, counter-
acted by the combination of anabolic and catabolic processes.
In normal and non-lesioned OA articular cartilage, there was
no protein loss with age. Without the availability of racemiza-
tion data, one might infer that this tissue was therefore inert.
However, in light of the difference in racemization rates relative
to the standard, it is clear that non-lesioned OA articular carti-
lage evinced increased anabolism balanced by catabolism
(Table 3). In contrast, the amino acid content of meniscal car-
tilage diminished with age, while racemization rates were sim-
ilar to those of OA articular cartilage. This is compatible with
an imbalance of protein catabolic and anabolic processes with
catabolism exceeding anabolism in meniscal cartilage with the
residual mass made up of non-proteinaceous material (for
example, glycosaminoglycan or water due to swelling). Thus,
the availability of racemization data allows inferences regard-
ing tissue turnover, and in particular the state of anabolism,
that would otherwise be unavailable through traditional bio-
chemical methods. This finding that OA meniscal cartilage
protein loss exceeds that of OA articular cartilage adds to the
increasing evidence that early pathological changes in menis-
cus are important to the development of OA [21].
Conclusions
In summary, analyses of the D amino acid content of joint tis-
sues provided valuable insights into their potential for anabo-
lism or repair, demonstrating comparable anabolic responses
for non-lesioned OA articular and meniscal cartilages. The
novel determination of age-adjusted proportions of
D amino
acids revealed evidence for variation in the relative turnover of
specific amino acids within joint tissues. Whereas some other
studies have corrected for the background racemization inher-
ent in the sample preparation, this is the first study to use an
entire range of age-matched control material to adjust for this
background and provide the means to accurately determine
protein turnover. This method provides a new means for
exploring tissue anabolism and racemization hot spots in dif-
ferent proteins and protein pools within a tissue.
Competing interests
The authors are applying for a patent related to the content of
this manuscript.
Authors' contributions
TVS carried out all of the laboratory analyses and drafted the
manuscript. SSB advised on and coordinated the collection of
teeth. RDZ participated in study design for collecting normal
cartilage and in manuscript editing. VBK conceived of the
study, participated in its design and coordination, and helped
to draft the manuscript. All authors read and approved the final
manuscript.
Acknowledgements
We wish to thank T Parker Vail and So Yeon Joyce Kong for assistance
in collecting surgical waste tissues and Russell Wang and Christopher
McCudden for assistance with the preparation of the teeth. This work
was supported by the following funding sources: National Institutes of
Health (NIH)/National Institute on Aging Claude Pepper OAIC 2P60
AG11268 and NIH/National Institute of Arthritis and Musculoskeletal
and Skin Diseases grant UO1 AR050898.
References
1. McCudden CR, Kraus VB: Biochemistry of amino acid racemi-
zation and clinical application to musculoskeletal disease.
Clin Biochem 2006, 39:1112-1130.
2. Verzijl N, De Groot J, Thorpe SR, Bank RA, Shaw JN, Lyons TJ,
Bijlsma JWJ, Lafeber F, Baynes JW, Te Koppele JM: Effect of col-
lagen turnover on the accumulation of advanced glycation end
products. J Biol Chem 2000, 275:39027-39031.
3. Pfeiffer H, Mornstad H, Teivens A: Estimation of chronologic age
using the aspartic acid racemization method. I. On human rib
cartilage. Int J Legal Med 1995, 108:19-23.
4. Masters PM, Bada JL, Zigler JS Jr: Aspartic acid racemisation in
the human lens during ageing and in cataract formation.
Nature 1977, 268:71-73.
5. Man EH, Sandhouse ME, Burg J, Fisher GH: Accumulation of
D-
aspartic acid with age in the human brain. Science 1983,
220:1407-1408.
6. Shapiro SD, Endicott SK, Province MA, Pierce JA, Campbell EJ:
Marked longevity of human lung parenchymal elastic fibers
deduced from prevalence of
D-aspartate and nuclear weap-
ons-related radiocarbon. J Clin Invest 1991, 87:1828-1834.
7. Powell JT, Vine N, Crossman M: On the accumulation of
D-aspar-
tate in elastin and other proteins of the ageing aorta. Athero-
sclerosis 1992, 97:201-208.
8. Ritz-Timme S, Laumeier I, Collins MJ: Aspartic acid racemization:
evidence for marked longevity of elastin in human skin. Br J
Dermatol 2003, 149:951-959.
9. Helfman PM, Bada JL: Aspartic acid racemisation in dentine as
a measure of ageing. Nature 1976, 262:279-281.
10. Ohtani S, Matsushima Y, Kobayashi Y, Yamamoto Y: Age estima-
tion by measuring the racemization of aspartic acid from total
amino acid content of several types of bone and rib cartilage:
a preliminary account. J Forensic Sci 2002, 47:32-36.
11. Borggreven JMPM, Hoppenbrouwers PMM, Gorissen R: Radio-
chemical determination of the metabolic activity of collagen in
mature dentin. J Dent Res 1979, 58:2120-2124.
12. Hashimoto A, Nishikawa T, Oka T, Takahashi K, Hayashi T: Deter-
mination of free amino acid enantiomers in rat brain and
serum by high-performance liquid chromatography after deri-
vatization with N-tert butyloxycarbonyl-
L-cysteine and o-
phthaldialdehyde. J Chromatogr 1992, 582:41-48.
Available online />Page 9 of 9
(page number not for citation purposes)
13. Cloos PA, Christgau S: Non-enzymatic covalent modifications
of proteins: mechanisms, physiological consequences and
clinical applications. Matrix Biol 2002, 21:39-52.
14. Bada JL, Kvenvolden KA, Peterson E: Racemization of amino
acids in bones. Nature 1973, 245:308-310.
15. Cloos PAC, Jensen AL: Age-related de-phosphorylation of pro-
teins in dentin: a biological tool for assessment of protein age.
Biogerontology 2000, 1:341-356.
16. Fisher G, Lopez S, Peterson K, Goff T, Philip I, Gaviria R, Lorenzo
N, Tsesarskaia M: Is there a correlation between age and
D-
aspartic acid in human knee cartilage? Amino Acids 2007,
32:27-30.
17. Maroudas A, Venn M: Chemical composition and swelling of
normal and osteoarthritic femoral head cartilage. II. Swelling.
Ann Rheum Dis 1977, 36:399-406.
18. Hollander AP, Pidoux I, Reiner A, Rorabeck C, Bourne R, Poole
AR: Damage to type II collagen in aging and osteoarthritis
starts at the articular surface, originates around chondrocytes,
and extends into the cartilage with progressive degeneration.
J Clin Invest 1995, 96:2859-2869.
19. Maroudas A, Palla G, Gilav E: Racemization of aspartic acid in
human articular cartilage. Connect Tissue Res 1992,
28:161-169.
20. Maroudas A, Bayliss MT, Uchitel-Kaushansky N, Schneiderman R,
Gilav E: Aggrecan turnover in human articular cartilage: use of
aspartic acid racemization as a marker of molecular age. Arch
Biochem Biophys 1998, 350:61-71.
21. Hunter DJ, Zhang YQ, Niu JB, Tu X, Amin S, Clancy M, Guermazi
A, Grigorian M, Gale D, Felson DT: The association of meniscal
pathologic changes with cartilage loss in symptomatic knee
osteoarthritis. Arthritis Rheum 2006, 54:795-801.