Báo cáo y học: "Mesenchymal progenitor cell markers in human articular cartilage: normal distribution and changes in osteoarthritis" ppt
Bạn đang xem bản rút gọn của tài liệu. Xem và tải ngay bản đầy đủ của tài liệu tại đây (5.02 MB, 13 trang )
Open Access
Available online />Page 1 of 13
(page number not for citation purposes)
Vol 11 No 3
Research article
Mesenchymal progenitor cell markers in human articular
cartilage: normal distribution and changes in osteoarthritis
Shawn P Grogan
1,2
, Shigeru Miyaki
1
, Hiroshi Asahara
1
, Darryl D D'Lima
1,2
and Martin K Lotz
1
1
Department of Molecular and Experimental Medicine, The Scripps Research Institute, 10550 North Torrey Pines Road, La Jolla, California, 92037,
USA
2
Shiley Center for Orthopaedic Research and Education at Scripps Clinic, 11025 North Torrey Pines Road, Suite 140, La Jolla, California, 92037,
USA
Corresponding author: Martin K Lotz,
Received: 24 Feb 2009 Revisions requested: 1 Apr 2009 Revisions received: 7 May 2009 Accepted: 5 Jun 2009 Published: 5 Jun 2009
Arthritis Research & Therapy 2009, 11:R85 (doi:10.1186/ar2719)
This article is online at: />© 2009 Grogan et al.; licensee BioMed Central Ltd.
This is an open access article distributed under the terms of the Creative Commons Attribution License ( />),
which permits unrestricted use, distribution, and reproduction in any medium, provided the original work is properly cited.
Abstract
Introduction Recent findings suggest that articular cartilage
contains mesenchymal progenitor cells. The aim of this study
was to examine the distribution of stem cell markers (Notch-1,
Stro-1 and VCAM-1) and of molecules that modulate progenitor
differentiation (Notch-1 and Sox9) in normal adult human
articular cartilage and in osteoarthritis (OA) cartilage.
Methods Expression of the markers was analyzed by
immunohistochemistry (IHC) and flow cytometry. Hoechst
33342 dye was used to identify and sort the cartilage side
population (SP). Multilineage differentiation assays including
chondrogenesis, osteogenesis and adipogenesis were
performed on SP and non-SP (NSP) cells.
Results A surprisingly high number (>45%) of cells were
positive for Notch-1, Stro-1 and VCAM-1 throughout normal
cartilage. Expression of these markers was higher in the
superficial zone (SZ) of normal cartilage as compared to the
middle zone (MZ) and deep zone (DZ). Non-fibrillated OA
cartilage SZ showed reduced Notch-1 and Sox9 staining
frequency, while Notch-1, Stro-1 and VCAM-1 positive cells
were increased in the MZ. Most cells in OA clusters were
positive for each molecule tested. The frequency of SP cells in
cartilage was 0.14 ± 0.05% and no difference was found
between normal and OA. SP cells displayed chondrogenic and
osteogenic but not adipogenic differentiation potential.
Conclusions These results show a surprisingly high number of
cells that express putative progenitor cell markers in human
cartilage. In contrast, the percentage of SP cells is much lower
and within the range of expected stem cell frequency. Thus,
markers such as Notch-1, Stro-1 or VCAM-1 may not be useful
to identify progenitors in cartilage. Instead, their increased
expression in OA cartilage implicates involvement in the
abnormal cell activation and differentiation process
characteristic of OA.
Introduction
The limited repair capacity of adult articular cartilage repre-
sents one factor involved in the development of progressive
cartilage degeneration and osteoarthritis (OA) following carti-
lage injury. This notion was previously related to the absence
of an inflammatory response, the putative absence and lack of
access to stem cells in cartilage [1,2], and intrinsic limitations
of adult human articular chondrocytes (AHAC) to repair tissue
damage [3]. Yet, when cultured under appropriate conditions,
cells isolated from cartilage can be induced to form cartilage-
like tissue in vitro [4] and monolayer-expanded AHAC can
form hyaline-like tissue when implanted into cartilage defects
in vivo [5].
ABCG2: ATP-binding cassette, sub-family G; AHAC: adult human articular cartilage; ALCAM: activated leukocyte cell adhesion molecule; ANOVA:
analysis of variance; BM-MSC: bone marrow-derived mesenchymal stem cell; BSA: bovine serum albumin; DMEM: Dulbecco's Modified Eagle's
Medium; DZ: deep zone; FACS: fluorescence-activated cell sorter; ICAM-2: intercellular adhesion molecule-2; IHC: immunohistochemistry; MSC:
mesenchymal stem cell; MZ: middle zone; NSP: non-side population; OA: osteoarthritis; PBS: phosphate buffered saline; RT-PCR: reverse-tran-
scriptase polymerase chain reaction; SP: side population; SZ: superficial zone; TGFβ1: Transforming growth factor beta-1; VCAM-1: vascular cell
adhesion molecule-1.
Arthritis Research & Therapy Vol 11 No 3 Grogan et al.
Page 2 of 13
(page number not for citation purposes)
Cells in OA cartilage are activated as evidenced by the
increased expression of a large number of genes and certain
cells proliferate to form the characteristic cell clusters [6,7].
This cell activation is also associated with abnormal cell differ-
entiation and represents a central pathogenetic mechanism in
OA [6-9]. Recent studies suggest the presence of cells that
express mesenchymal stem cell (MSC) markers and possess
multilineage differentiation capacity in normal articular carti-
lage [10-12]. A new interpretation of the cellular responses in
OA tissue is the possible involvement of resident cartilage pro-
genitor cells [13] and is consistent with our previous report of
increased progenitor marker expression in OA cartilage [14].
Although much information is available on the potential use of
MSC in tissue engineering [15], the functions of these cells in
tissue homeostasis and in arthritis pathogenesis are largely
unknown. MSC can be isolated from various tissue sources
but most of the current knowledge on MSC biology is based
on studies with bone marrow-derived MSC (BM-MSC) [16].
These cells have the capacity to form various mesenchymal tis-
sues such as bone, adipose tissue, tendon, muscle, and carti-
lage [17,18]. BM-MSC have been characterized by the
expression of several cell surface antigens [19-23]. Despite
the identification of these candidate markers there is, at
present, no consensus on a single marker for MSC [24]. Com-
binations of cell surface molecules are often employed to iden-
tify progenitor cells [20] and include Stro-1 [23,25], CD105/
endoglin (transforming growth factor (TGF) β receptor III) [25],
CD73 (an ecto-5'-nucleotidase) [26], CD166/activated leuko-
cyte cell adhesion molecule (ALCAM) [19] and Thy-1/CD90
(a glycosylphosphatidylinositol-anchored glycoprotein) [22].
The hyaluronan receptor (CD44) and the adhesion molecules
vascular cell adhesion molecule (VCAM)-1/CD106, and inter-
cellular adhesion molecule (ICAM)-2/CD102 are also MSC
markers [17,21,27-29]. The Notch-1 receptor with a role in
maintaining stem cell pools and mediating stem cell fate is also
considered a MSC marker [30,31]. MSC do not express mark-
ers of hematopoietic and endothelial cells such as CD11,
CD14, CD31, CD33, CD34, CD45, and CD133 [17,32,33].
Despite the advances of identifying MSC from isolated cells,
limited information concerning markers of such progenitor
cells in the native tissue is available. However, recent studies
on tissue-specific stem cell niches have been described and
may be critical for identifying progenitors in situ [34].
Several joint tissues harbor multi-potential progenitors [35-37]
including articular cartilage [10-12,38]. We previously identi-
fied a cell population in human adult articular cartilage that co-
expressed the MSC markers CD105 and CD166 [10]. These
cells did not express markers of differentiated chondrocytes
and were capable of undergoing multilineage differentiation to
chondrocytes, adipocytes, or osteoblasts. The superficial zone
(SZ) of newborn bovine cartilage contains a subpopulation of
cells that express Notch-1 and possess multilineage differen-
tiation potential [38]. Similar observations were reported for
equine and human articular cartilage [12,14,39,40]. An addi-
tional marker used to identify stem cells is based on the use of
the Hoechst 33342 dye. By flow cytometry a cell population,
termed 'side population' (SP) can be identified because it is
not permanently stained by this dye since it expresses the
multi-drug transporter ABCG2 (ATP-binding cassette, sub-
family G) that removes the dye from the cell [41].
Towards establishing suitable means of identifying progenitor
populations in articular cartilage, in this study, we determined
the location and frequency of Notch-1, Stro-1, and VCAM-1
positive cells via immunohistochemistry and the frequency of
SP cells using flow cytometry in normal and OA AHAC. We
also examined the relation of these markers with the distribu-
tion of Sox9 because it is an important regulator of many chon-
drogenic genes [42].
Materials and methods
Cartilage procurement, grading, and processing
Normal and OA articular cartilage was obtained from tissue
banks under approval by the Scripps human subjects commit-
tee. The knees were graded macroscopically (according to a
modified Outerbridge scale where grade 1 represents intact
surface, grade 2 minimal fibrillation, grade 3 overt fibrillation,
and grade 4 full thickness defect [43]), and microscopically
according to a modified Mankin scale with a score of less than
three points being normal and a score of more than five to rep-
resent OA [44,45]. Some areas in OA joints did not exhibit
surface fibrillations and were classified as 'OA non-fibrillated'
versus fibrillated areas from OA joints that were classified as
'OA fibrillated'. Safranin O stained sections were used to
determine whether all zones were represented.
Cell isolation and culture
Cells were isolated from articular cartilage using collagenase
as described [10]. The cells were cultured in Dulbecco's Mod-
ified Eagle's Medium (DMEM) (Mediatech, Inc., Manassas, VA,
USA) supplemented with 10% calf serum (CS) and Penicillin-
Streptomycin-Glutamine (Invitrogen, Carlsbad, CA, USA)).
Cells were then cultured in monolayer culture at a seeding
density of 50,000 cells/cm
2
for 24 hours (passage zero) or
until confluence and split once (passage 1) at a seeding den-
sity of 10,000 cells/cm
2
.
Immunohistochemistry
A total of 40 donors were used for immunohistochemistry
(IHC) in this study. Seventeen donors were classified as nor-
mal (mean ± standard deviation age 38.8 ± 16.3 years; range
14 to 61 years; 6 females and 11 males) and 23 donors with
OA (mean age of 64.7 ± 13.9 years; range 39 to 88 years; 11
females and 12 males). Cartilage from normal healthy and OA-
affected donors (non-fibrillated OA and fibrillated OA) was
embedded in paraffin. The total number of donors used for
each marker and for each condition (normal, non-fibrillated
OA, and fibrillated OA) is indicated in Table 1. Each paraffin
Available online />Page 3 of 13
(page number not for citation purposes)
block was sectioned (5 μm) and at least two sections from
each donor were immunostained for detection of Notch-1 (1
μg/ml; Mouse IgG, Abcam, Cambridge, MA, USA), Stro-1 (0.5
μg/ml; Mouse IgM, R&D Systems, Minneapolis, MN, USA),
VCAM-1/CD106 (1 μg/ml; Mouse IgG, Pharmingen/Becton
Dickinson, San Jose, CA, USA), Sox9 (1 μg/ml; Rabbit IgG,
Chemicon/Millipore, Temecula, CA, USA) and collagen type II
(1 μg/ml; II-II6B3; Hybridoma Bank, University of Iowa, Iowa
City, IA, USA). IHC was performed on sections of 5 μm in
thickness using the Histostain-Plus kit (Zymed Laboratories,
South San Francisco, CA, USA) following the manufacturer's
instructions. Species-matched isotype controls (IgM; 0.5 μg/
ml and IgG; 1 μg/ml) were used in combination and alone to
monitor possible non-specific and cross-reactive staining. To
show specificity of Sox9 staining, we used human fetal growth
plates, as previously described by Aigner and colleagues [46].
Quantification of immunostaining patterns throughout
adult human articular cartilage
Assessment of positive signal localizations throughout each
cartilage zone included systematic counting of positive and
negative cells in a 50 × 50 μm grid (40× field), starting from
the cartilage surface, down through the full thickness tissue
specimen. This was repeated five times for each section (min-
imum of two sections per donor). The identification of each
zone was based on previously reported characteristics [47]
(Figure 1). The frequency of positive signals was calculated for
each zone. To assess staining frequencies in OA cartilage
sections with extensive surface fibrillations, where the SZ was
Table 1
Percentage of positive immunostained Notch-1, Stro-1, VCAM-1, and Sox9 cells
Molecule Zone Percentage positive (±SE)
Normal OA Non-fibrillated OA Fibrillated OA clusters
Notch-1 Superficial 71.5 ± 3.2† 57.7 ± 9.0* 84.2 ± 3.7†**# 83.6 ± 7.0 (1/5¶)
Normal (n = 8)
Δ
OA NF (n = 5)
OA Fib (n = 5)
Middle 34.8 ± 6.7 48.9 ± 6.6* 61.6 ± 7.4†** 80.9 ± 7.2 (6/40)
Deep 29.1 ± 6.9 28.2 ± 10.6† 10.4 ± 5.6†** 68.68 ± 7.2 (2/11)
Mean: 78.5 ± 5.2
Stro-1 Superficial 81.3 ± 5.9† 84.7 ± 4.4† 82.9 ± 2.2 90.5 ± 9.5 (2/17)
Normal (n = 9)
OA NF (n = 8)
OA Fib (n = 4)
Middle 51.8 ± 7.6 56.8 ± 5.4† 71.2 ± 12.7 75.1 ± 14.7 (4/31)
Deep 38.3 ± 12.3 42.0 ± 8.2† 42.8 ± 20.6† 37.0 ± 9.15§ (2/11)
Mean: 69.4 ± 10.4
VCAM-1 Superficial 84.1 ± 1.3† 82.5 ± 4.7† 90.8 ± 5.5† 88.6 ± 7.7 (2/14)
Normal (n = 4)
OA NF (n = 6)
OA Fib (n = 4)
Middle 41.0 ± 8.9† 65.3 ± 4.4†* 66.5 ± 6.3** 76.5 ± 8.9 (3/24)
Deep 15.7 ± 5.5† 44.5 ± 6.8†* 60.7 ± 11.3** 61.1 ± 3.7 (3/19)
Mean: 75.4 ± 1.6
Sox9 Superficial 68.5 ± 6.9† 48.5 ± 8.8* 69.0 ± 5.3# 81.8 ± 5.2 (3/27)
Normal (n = 8)
OA NF (n = 8)
OA Fib (n = 6)
Middle 48.4 ± 6.1 43.2 ± 7.1 43.0 ± 8.6 73.5 ± 4.9 (4/30)
Deep 38.0 ± 9.3 39.5 ± 11.3 18.5 ± 11.7# 25.6 ± 11.4§ (4/27)
Mean: 71.6 ± 4.9
Results show percentage positive cells for each zone in normal, non-fibrillated (NF), fibrillated (Fib) osteoarthritic (OA), and cells in OA cell
clusters in human articular cartilage (number of donors).
† P < 0.05 between zone comparisons within each condition. * P < 0.05 between normal and non-fibrillated OA in the corresponding zone. ** P <
0.05 between normal and fibrillated OA in the corresponding zone. # P < 0.05 between non-fibrillated OA and fibrillated OA in the corresponding
zone. ¶ (number of donors assessed/total number of clusters counted). § P < 0.05 between clusters in each zone within each condition.
Δ
Number of donors stained for each marker and condition.
SE = standard error; VCAM-1 = vascular cell adhesion molecule-1.
Arthritis Research & Therapy Vol 11 No 3 Grogan et al.
Page 4 of 13
(page number not for citation purposes)
absent or would not be recognizable, assessment proceeded
from the deep zone (DZ) up to the fibrillated surface. In exten-
sively fibrillated samples, the fibrillated surfaces were consid-
ered middle zone (MZ). We also examined sections that
appeared normal with intact surface from OA joints (non-fibril-
lated OA).
Flow cytometry
Primary isolated human articular chondrocytes were detached
from culture flasks after 24 hours of culture following isolation
from cartilage or after the first passage (approximately three
weeks in culture) using Accutase (Innovative Cell Technolo-
gies, Inc. San Diego, CA, USA), washed in PBS, resuspended
in PBS/BSA (1%), and divided into 1.5 ml Eppendorf tubes (1
× 10
3
). The cells were stained with 4 μg/ml CD44 (4 μg/ml;
Diaclone/Tepnel Lifecodes Corp., Stamford, CT, USA),
CD105 (4 μg/ml; Mouse IgG, Ancell, Bayport, MN, USA),
CD90 (4 μg/ml; Mouse IgG, Serotec, Kidlington, Oxford, UK),
CD166 (4 μg/ml; Mouse IgG, Ancell, Bayport, MN, USA),
Stro-1 (10 μg/ml; Mouse IgM, R&D Systems, Minneapolis,
MN, USA), and Notch-1 (L18, 4 μg/ml; Goat Polyclonal, Santa
Cruz Biotechnology, Inc., Santa Cruz, CA, USA). Species-
matched isotype controls were used at the same concentra-
tions. All antibody incubations (primary and secondary) were
performed on ice for 30 minutes each. The cells were sub-
jected to fluorescence-activated cell sorter (FACS) analysis
using a Becton Dickinson FACScan and Cell Quest software
(Becton Dickinson, San Jose, CA, USA). The extent of positive
staining was calculated as a percentage in comparison with
the isotype control staining, set at the 1% level. Signals less
than 1% were considered negative.
Quantitative real-time PCR
Total RNA was isolated from monolayer or pellet cultures
using Trizol (Invitrogen, Carlsbad, CA, USA). cDNA was pro-
duced using Ready-to-go You-Prime First-Strand Beads (GE
Healthcare Life Sciences, Uppsala, Sweden) with total RNA 1
μg and oligo (dT)18 primers. Quantitative real-time RT-PCR
(qPCR) was performed using TaqMan Gene Expression
Assay probe for ABCG2 (Hs00194979_m1), Sox9
(Hs00165814_m1), Col2a1 IIA (Hs00156568_m1), Col2a1
IIB (Hs01064869_m1), Aggecan (Hs00202971_m1),
Col1a1 (Hs00164004_m1), Col10a1 (Hs00166657_m1),
Runx2 (Hs00298328_s1), Osterix (Hs00541729_m1), Oste-
ocalcin (Hs01587814_g1), Adiponectin (Hs02564413_S1),
and GAPDH (Hs99999905_m1) (All Applied Biosystems,
Foster City, CA, USA). Relative expression was calculated
using the ΔΔC
t
values and results were expressed as 2
-ΔΔCt
.
GAPDH was used as an internal control to normalize differ-
ences in each sample.
Side population isolation and culture
Human articular chondrocytes in first passage monolayer cul-
ture were incubated in Hoechst dye 33342 (4 μg/ml) at 37°C
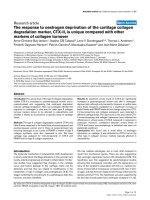
Figure 1
Overview of cartilage structure and zonal architecture and representative Safranin O micrographs of cells in each zoneOverview of cartilage structure and zonal architecture and representative Safranin O micrographs of cells in each zone. (a) Adapted from Tyyni and
Karlsson [65]. Identification of each zone was based on previously reported characteristics that comprise cell shape, morphology, orientation, and
pericellular matrix (PM) deposition [47]. Superficial zone (SZ) cells are small, elongated in shape, parallel relative to the surface, and lack an exten-
sive PM. These cells predominate the first 50 μm. The middle zone (MZ) is distinguishable by rounded cells that do not exhibit an organized orienta-
tion relative to the surface, are within ECM rich in proteoglycans and show presence of PM. Deep zone (DZ) cells were identified by an extensive PM
deposition with chondrons in groups of three or more cells arranged in columns perpendicular to the surface. Safranin O staining of the (b) SZ and
upper MZ, (c) MZ, (d) DZ chondrocytes and (e) DZ and calcified zone.
Available online />Page 5 of 13
(page number not for citation purposes)
for 90 minutes, washed in ice cold Hank's balanced salt solu-
tion and maintained on ice. Propidium iodide (2 μg/ml) was
added just prior to sorting to exclude dead cells. The FACS-
Vantage SE flow cytometer (Becton Dickinson, San Jose, CA,
USA) was used to determine the frequency of Hoechst nega-
tive cells (SP cells) and to isolate SP and non-SP (NSP)
chondrocytes. Sorted cells were placed in culture and
expanded in DMEM supplemented with 10% CS and Penicil-
lin-Streptomycin-Glutamine. SP and NSP cells were cultured
for six passages (>25 cell doublings) to achieve adequate
numbers for the differentiation assays.
Chondrogenesis assay
Cells from each population (SP and NSP) were placed into
pellet cultures (0.5 × 10
6
/pellet) in Insulin, Tranferrin, Sele-
nium (ITS+) serum free medium (Sigma, St. Louis, MO, USA)
supplemented with TGFβ1 (10 ng/ml) for two weeks. Pellets
were processed for histology (Safranin O staining) and RT-
PCR analyses. Total RNA was extracted using RNA easy kit
(Qiagen, Valencia, CA, USA) and cDNA was generated using
the ready-to-go-first-strand beads kit (GE Healthcare Life Sci-
ences, Uppsala, Sweden). Expression levels of ABCG2,
Col1a1, Col2a1 IIA, Col2a1 IIB, Col10a1, Sox9, and aggre-
can (normalized to GAPDH) were assessed via qPCR.
Osteogenesis assay
Osteogenic differentiation was also analyzed in monolayer cul-
tures using established medium supplements [48,49]. Cells
were seeded in 24-well plates (1 × 10
3
each well) in DMEM
plus 10% CS, 10 nM dexamethasone, 10 mM β-glycerophos-
phate, and 0.1 mM L-ascorbic acid-2-phosphate (Sigma, St.
Louis, MO, USA) and cultured for three weeks. Medium was
changed twice weekly. Negative control wells were main-
tained in DMEM supplemented with 10% CS for the duration
of the assay. Cells were harvested for RNA extraction and
qPCR to examine the expression of Runx2, Osterix, Osteocal-
cin, and Col1a1.
Adipogenesis assay
Adipogenesis of SP and NSP cells was induced in monolayer
cultures employing induction and maintenance media as pre-
viously described by Pittenger and colleagues [17]. Briefly, 1
× 10
3
cells were seeded in 24-well plates and cultured with
DMEM supplemented with 10% CS until confluent. These
cells were exposed to the induction medium consisting of 10
μg/ml insulin, 1 μM dexamethasone, 500 μM 3-isobutyl-1-
methyl xanthine, 100 μM indomethacin (Sigma, St. Louis, MO,
USA) for 72 hours. The medium was replaced with mainte-
nance medium, 10 μg/ml insulin in DMEM, and 10% CS, and
culture was continued for 24 hours. This 96-hour treatment
cycle was repeated four more times, followed by culture for an
additional week in adipogenic maintenance medium. Negative
control wells were maintained in DMEM supplemented with
10% CS for the duration of the assay. The cells were har-
vested for qPCR analysis of Adiponectin.
Statistical analysis
Comparisons between each zone, between normal and non-
fibrillated OA and between non-fibrillated OA and fibrillated
OA tissue were made via one-way analysis of variance
(ANOVA) followed by student's t-tests (Microsoft Excel, ver-
sion 11.3.5, Redmond, WA, USA). P values less than 0.05
were considered significant.
Results
Distribution of Notch-1, Stro-1, VCAM-1, and Sox9 in
normal adult human articular cartilage
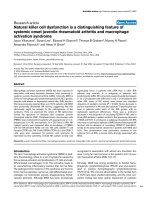
A surprisingly high number of cells stained positive for the
MSC markers Stro-1, VCAM-1, and Notch-1 in normal human
articular cartilage. On average, combining all zones, over 45%
of cells were positive (Figure 2 and Table 1).
There were significant zonal variations in marker expression.
Over 70% of cells in the SZ were Notch-1 positive (Table 1
and Figure 2a), but significantly less were positive in the MZ
(35%) and DZ (29%). The SZ also contained significantly
higher numbers of Stro-1 (81%) and VCAM-1 (84%) positive
cells compared with MZ and DZ cells (Table 1). Representa-
tive images are shown in Figure 2.
Chondrocyte differentiation and the expression of cartilage
matrix genes are in part regulated by Sox transcription factors
[42]. Sox9 was detected in all zones in approximately 50% of
all chondrocytes (Table 1 and Figure 2). A significantly higher
percentage of cells in the SZ (69%) were positive for Sox9
compared with the other two zones (Table 1 and Figure 2a).
The isotype and species matched controls indicate that all
staining patterns observed in this study were specific (Figure
2c). Moreover, cells that are in close proximity or adjacent to
each other can be positive or negative (Figure 2d). Sox9 stain-
ing specificity was confirmed using human fetal growth plate
cartilage, showing that the majority of cells in the surface, rest-
ing, and proliferation zones positive and mostly negative in the
hypertrophic zone (data not shown). Double staining of normal
cartilage for Stro-1 and Sox9 showed that a majority of cells in
each zone were double positive, although some cells, particu-
larly in the SZ, can be detected as Stro-1 positive only (Figure
2e).
Stem cell markers in human OA articular cartilage
In the SZ of non-fibrillated OA cartilage there was a significant
reduction of Notch-1-positive cells as compared with normal
cartilage (71.5% in normal to 57.7% in OA; Table 1). By con-
trast in fibrillated OA samples, where we could still identify the
SZ, Notch-1 frequency significantly increased to an average of
84.2%, relative to normal (71.5%). The increased frequency of
Notch-1 in fibrillated cartilage was a reflection of the multiple
cell clusters present in these tissues (Figure 3).
In the MZ, Notch-1 staining increased in non-fibrillated OA car-
tilage to 48.9% and further in fibrillated cartilage to over 60%
Arthritis Research & Therapy Vol 11 No 3 Grogan et al.
Page 6 of 13
(page number not for citation purposes)
Figure 2
Distribution of Notch-1, Stro-1, VCAM-1, and Sox9 in normal human adult articular cartilageDistribution of Notch-1, Stro-1, VCAM-1, and Sox9 in normal human adult articular cartilage. (a) Percentage positive signal for the superficial zone
(SZ), middle zone (MZ), and deep zone (DZ). *P < 0.05. (b) Representative images (10×) for Notch-1, Stro-1, VCAM-1, and Sox9 showing greater
staining frequency in the SZ and upper MZ. (c) Images depicting SZ and upper MZ (40×). Solid inset (bottom right) indicates negative controls. Dot-
ted line box outlines SZ images presented in (d) showing a mix of cells that are positive (black arrow) or negative (white arrow) for each immunos-
tain. (e) Stro-1 (brown) and Sox9 (red) double staining with some cells single Stro-1 positive (white arrow) or Stro-1/Sox9 double positive (black
arrow) (40×).
Available online />Page 7 of 13
(page number not for citation purposes)
(Table 1). In the DZ of non-fibrillated OA cartilage there were
significantly less Notch-1-positive cells (28.2%) compared
with normal cells and this value decreased further to 10.4% in
the DZ of fibrillated OA tissues (Table 1).
Stro-1 staining was not significantly different in the SZ of nor-
mal versus OA samples. In the MZ of OA-affected cartilage
there was a trend towards higher Stro-1 staining as compared
with normal.
VCAM-1 staining was similar in the SZ of normal and OA car-
tilage. A significant increase in VCAM-1 staining frequency
was detected in the MZ and DZ of OA-affected tissues (Table
1). All three markers showed decreased expression from the
SZ to the MZ and DZ of OA tissues.
The frequency of Sox9-positive cells was significantly reduced
in the SZ of non-fibrillated OA cartilage (49%) compared with
the SZ of normal cartilage (69%). No significant alteration in
Sox9 frequency was seen in the MZ and DZ of non-fibrillated
OA cartilage compared with normal. The number of Sox9-pos-
itive cells in MZ remained unchanged in the fibrillated carti-
lage, yet a significant increase was noted in the SZ of
fibrillated tissue to levels similar to those in normal SZ carti-
lage. In comparison with the DZ of non-fibrillated cartilage
(40%), Sox9 frequencies significantly fell to 19% in the DZ of
fibrillated cartilage.
In summary, the SZ of non-fibrillated OA cartilage showed
reduced Notch-1 and Sox9 staining frequency. Yet, the MZ
showed increased frequency of Notch-1 and VCAM-1 in non-
fibrillated and fibrillated OA tissue. Finally, the DZ had
decreased levels of both Notch-1 and Sox9 staining in fibril-
lated OA tissue, although the number of VCAM-1-positive
cells increased.
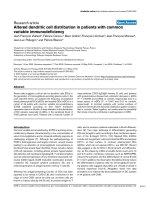
Cell clusters in OA cartilage express progenitor markers
The number of cell clusters was increased in fibrillated OA car-
tilage (Figure 3). A majority of cells in clusters (69 to 79%)
were positive for Notch-1, Stro-1, VCAM-1, and Sox9 (Table
1). Clusters located in the DZ had significantly reduced fre-
quencies of Stro-1 and Sox9-positive cells (Table 1). Not all
cells in clusters were positive for Notch-1, Stro-1, VCAM-1, or
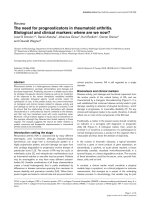
Sox9 (Figure 3). Moreover, Sox9 staining patterns were mainly
nuclear in normal cartilage (Figure 2), but Sox9 staining in OA
clusters was present in both the cytoplasm and nucleus, or
Figure 3
Stem cell markers in human osteoarthritis (OA) articular cartilageStem cell markers in human osteoarthritis (OA) articular cartilage. (a) Safranin O and Notch-1 staining in clusters (10× and 40×). (b) Safranin O and
Stro-1 staining of OA cartilage sections (10× and 40×). (c) OA cartilage sections immunostained for VCAM-1 (10× and 40×). Positive staining indi-
cated by black arrows and negative with white arrows.
Arthritis Research & Therapy Vol 11 No 3 Grogan et al.
Page 8 of 13
(page number not for citation purposes)
even exclusively in the cytoplasm (Figure 4a). Stro-1 and Sox9
double-staining images (Figure 4b) indicate that cells within
clusters can be double positive for Stro-1 and Sox9 (black
arrows) or single positive for Stro-1 (white arrows). Cells
within clusters are surrounded by an ECM rich in type II colla-
gen, but not all cells stained positive for Sox9 (Figure 4c).
Stem cell marker expression in isolated cartilage cells
To extend the IHC results, cells were isolated and analyzed in
first passage by flow cytometry. Contrasting the high fre-
quency of Notch-1 and Stro-1-positive cells as detected by
IHC in cartilage, flow cytometry showed much lower expres-
sion levels of these markers (Normal: n = 4; 37.8 ± 5.9 years
old; OA: n = 4. 61.5 ± 5.7 years old). Notch-1-positive cells in
normal cartilage cells were 2.4% and 3.5% in OA, while Stro-
1 levels were 5.4% and 7.6% in normal and OA, respectively.
To clarify the discrepancy between IHC and FACS observa-
tions, we stained cells 24 hours after enzymatic isolation in 10
donors (ages and gender indicated in Table 2). Stro-1 levels in
cells cultured for only for 24 hours were 25.6 ± 5.2% (Table
2), but this dropped to below 10% by seven days (data not
shown). Notch-1 levels were lower at 4.7 ± 1.2% (Table 2). No
significant shift in Notch-1 or Stro-1 expression levels were
detected between 24-hour cultured normal and OA cells. Of
the other progenitor markers investigated at first passage,
48.7 ± 11.4% of cells from OA cartilage (n = 4 donors) were
positive for CD166 as opposed to only 8.4 ± 4.8% in cells
from normal cartilage (P < 0.05; n = 4 donors). There was a
trend towards increased CD105 levels in OA cells (normal:
57.3 ± 21.2%; OA: 80.1 ± 8.8%). CD44 and CD90 surface
molecule expression levels did not significantly differ between
normal and OA cells. These results from isolated cells show
much lower stem cell marker expression as compared with
cartilage tissue. This may be the result of cell loss during iso-
Figure 4
Cell cluster staining for Sox9, Stro-1, and collagen type IICell cluster staining for Sox9, Stro-1, and collagen type II. (a) Cells in clusters can be negative (white arrow) for Sox9 or show cytoplasmic and/or
nuclear staining (black arrow) (10×). (b) Double staining with Stro-1 (brown) and Sox9 (red) indicate cells that are single (white arrow) or double
positive (black arrow) (40×). (c) Collagen type II and Sox9 immunostaining of osteoarthritis (OA) cartilage. Clusters are surrounded by collagen type
II matrix and not all cells in these clusters are Sox9 positive (black arrow positive; white arrow negative) (10× and 40×).
Available online />Page 9 of 13
(page number not for citation purposes)
lation or down regulation of the markers during cell isolation
and subsequent culture.
Side population
The overall frequency of SP cells in first passage monolayer
cells from normal articular cartilage (n = 4; 42.3 ± 12.1 years)
was 0.15 ± 0.06% and 0.13 ± 0.06% in OA (n = 3; 51.0 ±
8.5 years old). A three-fold higher level of transmembrane
transporter protein ABCG2 in isolated SP cells, compared
with NSP, confirmed successful collection of the SP by flow
cytometry (Figure 5). SP cells were found to have higher chon-
drogenic potential compared with NSP as seen by Safranin O
staining (Figure 6a) and gene expression (Col2a1 IIA, IIB,
Sox9, and aggrecan) (Figure 6b). The expression of Runx2
and high expression of Col1a1 in SP cells cultured in pro-oste-
ogenic conditions revealed osteogenic differentiation potential
(Figure 6c). Osteocalcin and Osterix were not detected. No
evidence of adipogenic differentiation was observed (data not
shown).
Discussion
The current study was designed to determine the localization
of cells expressing putative progenitor markers in normal and
OA human articular cartilage. The three selected candidate
markers Notch-1, Stro-1, and VCAM-1 have been widely used
to identify bone marrow MSC [23,25,28-31]. Staining pat-
terns for the three markers in normal human articular cartilage
were similar with significantly higher staining frequency in the
SZ as compared with the MZ and DZ. This is consistent with
observations from other laboratories using the same or other
stem cell markers [12,38,40]. Using IHC we observed a sur-
prisingly high frequency of cells expressing Notch-1, Stro-1,
and VCAM-1 throughout normal human articular cartilage.
Using flow cytometry as an alternative method to detect
Notch-1 and Stro-1 we observed lower levels of positive cells
as compared with IHC. Furthermore, although the percentage
of Notch-1 and Stro-1-positive cells was similar by IHC, the
flow cytometry results showed much higher expression of
Stro-1 as compared with Notch-1. As we demonstrated spe-
cificity of the IHC signals, these results suggest that profound
changes in the expression of these markers occur upon cell
isolation and that the patterns of change are different for each
Table 2
Flow cytometric analysis of human chondrocytes derived from
normal and OA-affected articular cartilage, cultured in
monolayer for 24 hours (n = 10) and stained for Stro-1 and
Notch-1
Percentage positive
Age and gender OA grade† Stro-1 Notch-1
Donor 1 53 male 1 25.1 6.1
Donor 2 17 female 1 9.5 4.3
Donor 3 65 male 1 to 2 nd* 14.0
Donor 4 61 male 2 26.5 2.8
Donor 5 30 male 2 54.6 1.6
Donor 6 56 female 2 29.1 3.4
Donor 7 65 female 2 nd 4.2
Donor 8 64 male 2 to 3 22.7 3.1
Donor 9 59 male 3 to 4 31.0 nd
Donor 10 64 male 3 to 4 5.9 2.5
Mean ± SE 25.6 ± 5.2 4.7 ± 1.2
† Grade 1 represents intact surface, Grade 2 minimal fibrillation,
Grade 3 overt fibrillation and Grade 4 full thickness defect. *nd = not
determined; OA = osteoarthritis; SE = standard error.
Figure 5
Side population in normal cartilageSide population in normal cartilage. (a) FACS image of the gated side population (SP) and non-SP (NSP) cells isolated via cell sorting. (b) Expres-
sion level of ABCG2 in SP and NSP cells. The three-fold higher expression of ABCG2 indicates successful isolation of the cartilage SP.
Arthritis Research & Therapy Vol 11 No 3 Grogan et al.
Page 10 of 13
(page number not for citation purposes)
marker. This change could either be the result of a downregu-
lation of protein expression in monolayer culture, indicate a
sensitivity to exposure to collagenase digestion, previously
demonstrated for numerous surface molecules on human
articular chondrocytes [50] or be because of preferential loss
of cells expressing these markers during the isolation process.
Enzymatic digestion of cartilage recovers less than 22% of the
total number of cells present in the original tissue [51], indicat-
ing that certain subpopulations such as those expressing pro-
genitor markers may be lost.
Given the unexpected high levels of Notch-1, Stro-1, and
VCAM-1-positive cells in cartilage, we applied an additional
means of identifying stem cells. The Hoechst dye 33342,
which defines the so-called SP, was used with freshly isolated
cells from human articular cartilage and on flow cytometry we
observed that the SP represented only 0.1% of the cells. This
frequency is similar to that reported for young bovine cartilage
[52]. However, this is vastly different from the frequency of
Notch-1, Stro-1, and VCAM-1-positive cells. The Hoechst dye
thus appears to be a more appropriate stem cell marker.
Figure 6
Multilineage potential of the side population (SP) derived from normal human articular cartilageMultilineage potential of the side population (SP) derived from normal human articular cartilage. (a) Safranin O staining of 14-day SP and non-SP
(NSP) pellet cultures (magnification 40×). (b) Gene expression analysis of 14-day pellet cultures relative to NSP cells. Higher Sox9, Aggrecan, and
both Col2a1 IIA and Col2a1 IIB expression in SP cells. (c) SP cultured in pro-osteogenic medium for three weeks show higher levels of Col1a1
and Runx2 gene expression relative to NSP cells.
Available online />Page 11 of 13
(page number not for citation purposes)
In the present study we did not examine whether the cells
expressing Notch-1, Stro-1, or VCAM-1 had multilineage dif-
ferentiation capacity. Our previous study [10] and Dowthwaite
and colleagues [38] demonstrated that cartilage cells express-
ing CD105/CD166 or Notch-1 do indeed have stem cell activ-
ities. However, Karlsson and colleagues [53] recently
demonstrated that Notch-1 is not a progenitor marker in carti-
lage. To reconcile these observations in reflection to this cur-
rent data set, it is most plausible that a subpopulation of these
identified progenitor-positive cells is multi-potent, which is rep-
resented by the SP. Further surface molecule characterization
of the cartilage SP is required.
Based on the differences in the frequency of Notch-1, Stro-1,
or VCAM-1-positive cells versus SP cells, these represent very
different cell populations. We propose that the observed high
frequency of progenitors in cartilage is a reflection of multiple
functions that these progenitor molecules have in the native
tissue such as controlling cell fate, proliferation, and apoptosis
[30,54,55]. On the other hand, cartilage may contain a very
high proportion of progenitor cells due to its avascular quality.
Frequency of Notch-1-positive cells among different human
tissues ranges from 0 to more than 60% [56]. The concentra-
tion of stem cells in the SZ and on the surface of developing
human cartilage is also consistent with a recent report [57]
showing that during postnatal development of rabbit knee
joints, the SZ contains stem cells that supply a rapidly dividing,
transit-amplifying daughter-cell pool. Following cessation of
growth and attainment of joint maturation the stem cell pool in
the SZ may provide a reservoir for replenishing cells in the car-
tilage surface that is the site of biomechanical load and wear.
Based on the present results this cellular organization appears
also present and maintained in mature human articular carti-
lage.
This study is the first to analyze changes in the distribution of
stem cell markers in OA affected human articular cartilage.
High Stro-1 protein expression levels have been observed in
OA synovium cell clusters [37] and the soluble form of VCAM-
1 has been implicated in rheumatoid arthritis and OA [58,59].
We have previously reported increased expression of Notch-1
in OA cartilage [14] and a recent study indicates that Notch-
1-positive cells and its signaling components, Jagged1 and
Hes5, are upregulated in OA and mediate cell proliferation
[40]. The reduction in both Notch-1 and Sox9 in the SZ non-
fibrillated OA cartilage is notable because this implies a reduc-
tion in progenitor cells and probably normal cartilage ECM
production, respectively. This shift may be a consequence of
aging and such cell depletion may be an important initiator or
a predisposing factor leading to OA development. We have
recently demonstrated co-ordination between Notch-1 and
Sox9 signaling to either inhibit or promote chondrogenesis
[60]. Imbalance between these pathways may be an inherent
feature of OA and a possible therapeutic target.
OA cartilage is characterized by cell cluster formation and
abnormal cell differentiation processes with renewed expres-
sion of cartilage development related extracellular matrix com-
ponents [61-63]. Genes attributed to dedifferentiated
(collagen types I and III, fibronectin) and hypertrophic
chondrocytes (collagen type X) are also detected in OA clus-
ters [6,61]. Based on the present observations, the cells that
compose these clusters are likely to be a result of proliferating
chondroprogenitors. Aigner and colleagues [64] indicated
that MZ cells are principally activated in OA tissue and these
cells express type IIA procollagen, indicative of the chondro-
progenitor phenotype, which is in agreement with our current
observations of increased progenitor markers in the same area
of OA cartilage. Fukui and colleagues [61] showed the most
profound phenotypic shift as indicated by the expression of
type II collagen and fibronectin in OA fibrillated areas where
clusters are prominent. Understanding the basis of such aber-
rant chondrocyte responses and whether resident progenitor
cells are involved will be vital for the development of therapies
and diagnostic markers to control and prevent OA progres-
sion.
Results from the marker staining patterns in OA cartilage show
several changes as compared with normal tissue. However,
the type of change is also specific for each marker. For exam-
ple, there is a marked decrease in Notch-1 in the DZ of fibril-
lated OA cartilage but VCAM-1 is increased by four-fold.
These divergent changes further suggest that the selected cell
surface receptors are at least in part independently regulated
as part of the cell activation process in OA and do not repre-
sent suitable stem cell markers in cartilage.
Conclusions
Although the progenitor cell markers analyzed in this study can
not be considered alone as representative indicators of stem
cells within human articular cartilage, the increased presence
of such molecules in OA tissue, in particular in cell clusters,
further implicates their involvement in the abnormal matrix
remodeling process. In particular, Notch signaling is known to
modulate cell proliferation, apoptosis and differentiation,
which may represent a target for modulating OA disease pro-
gression.
Competing interests
The authors declare that they have no competing interests.
Authors' contributions
SPG participated in study conception and design, acquisition
of data (immunohistochemistry, histomorphometry, isolation of
side population (SP) and culture, FACS analysis), analysis and
interpretation of data, and drafting the manuscript. SM partic-
ipated in study conception and design, acquisition of data (iso-
lation of SP and gene expression analysis), and analysis and
interpretation of data. HA participated in analysis and interpre-
tation of data. DDL participated in analysis and interpretation
Arthritis Research & Therapy Vol 11 No 3 Grogan et al.
Page 12 of 13
(page number not for citation purposes)
of data, and drafting the manuscript. MKL participated in study
conception and design, analysis and interpretation of data,
and drafting the manuscript. All authors read and approved the
final manuscript.
Acknowledgements
We are thankful for the technical support provided by Lilo Creighton and
Jean Valbracht. The Collagen type II antibody (II-II6B3) was obtained
from the Developmental Studies Hybridoma Bank developed under the
auspices of the NICHD and maintained by the University of Iowa,
Department of Biological Sciences, Iowa City, IA, USA. This study was
supported by NIH grants AG07996, AG033409 and AR050631.
References
1. Owen M, Friedenstein AJ: Stromal stem cells: marrow-derived
osteogenic precursors. Ciba Found Symp 1988, 136:42-60.
2. Shapiro F, Koide S, Glimcher MJ: Cell origin and differentiation
in the repair of full-thickness defects of articular cartilage. J
Bone Joint Surg Am 1993, 75:532-553.
3. Buckwalter JA, Mankin HJ: Articular cartilage: tissue design and
chondrocyte-matrix interactions. Instr Course Lect 1998,
47:477-486.
4. Benya PD, Shaffer JD: Dedifferentiated chondrocytes reex-
press the differentiated collagen phenotype when cultured in
agarose gels. Cell 1982, 30:215-224.
5. Brittberg M, Lindahl A, Nilsson A, Ohlsson C, Isaksson O, Peter-
son L: Treatment of deep cartilage defects in the knee with
autologous chondrocyte transplantation. N Engl J Med 1994,
331:889-895.
6. Pullig O, Weseloh G, Ronneberger D, Kakonen S, Swoboda B:
Chondrocyte differentiation in human osteoarthritis: expres-
sion of osteocalcin in normal and osteoarthritic cartilage and
bone. Calcified Tissue International 2000, 67:230-240.
7. Tchetina EV, Squires G, Poole AR: Increased type II collagen
degradation and very early focal cartilage degeneration is
associated with upregulation of chondrocyte differentiation
related genes in early human articular cartilage lesions. J
Rheum 2005, 32:876-886.
8. Pfander D, Kortje D, Zimmermann R, Weseloh G, Kirsch T,
Gesslein M, Cramer T, Swoboda B: Vascular endothelial growth
factor in articular cartilage of healthy and osteoarthritic human
knee joints. Ann Rheum Dis 2001, 60:1070-1073.
9. Sandell LJ, Aigner T: Articular cartilage and changes in arthritis.
An introduction: cell biology of osteoarthritis. Arthritis Res
2001, 3:107-113.
10. Alsalameh S, Amin R, Gemba T, Lotz M: Identification of mesen-
chymal progenitor cells in normal and osteoarthritic human
articular cartilage. Arthritis Rheum 2004, 50:1522-1532.
11. Barbero A, Ploegert S, Heberer M, Martin I: Plasticity of clonal
populations of dedifferentiated adult human articular
chondrocytes.
Arthritis Rheum 2003, 48:1315-1325.
12. Ustunel I, Ozenci AM, Sahin Z, Ozbey O, Acar N, Tanriover G,
Celik-Ozenci C, Demir R: The immunohistochemical localiza-
tion of notch receptors and ligands in human articular carti-
lage, chondroprogenitor culture and ultrastructural
characteristics of these progenitor cells. Acta Histochem
2008, 110:397-407.
13. Kruegel J, Miosge N, Koelling S: The Role of Progenitor Cells in
Osteoarthritis. Current Rheumatology Reviews 2008,
4:210-213.
14. Hiraoka K, Grogan S, Olee T, Lotz M: Mesenchymal progenitor
cells in adult human articular cartilage. Biorheology 2006,
43:447-454.
15. Granero-Molto F, Weis JA, Longobardi L, Spagnoli A: Role of
mesenchymal stem cells in regenerative medicine: application
to bone and cartilage repair. Expert Opin Biol Ther 2008,
8:255-268.
16. Caplan AI: Mesenchymal stem cells. J Orthop Res 1991,
9:641-650.
17. Pittenger MF, Mackay AM, Beck SC, Jaiswal RK, Douglas R,
Mosca JD, Moorman MA, Simonetti DW, Craig S, Marshak DR:
Multilineage potential of adult human mesenchymal stem
cells. Science 1999, 284:143-147.
18. Pittenger MF, Mosca JD, McIntosh KR: Human mesenchymal
stem cells: progenitor cells for cartilage, bone, fat and stroma.
Curr Top Microbiol Immunol 2000, 251:3-11.
19. Barry FP, Boynton RE, Haynesworth S, Murphy JM, Zaia J: The
monoclonal antibody SH-2, raised against human mesenchy-
mal stem cells, recognizes an epitope on endoglin (CD105).
Biochem Biophys Res Commun 1999, 265:134-139.
20. Campagnoli C, Roberts IA, Kumar S, Bennett PR, Bellantuono I,
Fisk NM: Identification of mesenchymal stem/progenitor cells
in human first-trimester fetal blood, liver, and bone marrow.
Blood 2001, 98:2396-2402.
21. Majumdar MK, Thiede MA, Mosca JD, Moorman M, Gerson SL:
Phenotypic and functional comparison of cultures of marrow-
derived mesenchymal stem cells (MSCs) and stromal cells. J
Cell Physiol 1998, 176:57-66.
22. Saalbach A, Haustein UF, Anderegg U: A ligand of human thy-1
is localized on polymorphonuclear leukocytes and monocytes
and mediates the binding to activated thy-1-positive microvas-
cular endothelial cells and fibroblasts.
J Invest Dermatol 2000,
115:882-888.
23. Simmons PJ, Torok-Storb B: Identification of stromal cell pre-
cursors in human bone marrow by a novel monoclonal anti-
body, STRO-1. Blood 1991, 78:55-62.
24. Baksh D, Song L, Tuan RS: Adult mesenchymal stem cells:
characterization, differentiation, and application in cell and
gene therapy. J Cell Mol Med 2004, 8:301-316.
25. Dennis JE, Carbillet JP, Caplan AI, Charbord P: The STRO-1+
marrow cell population is multipotential. Cells Tissues Organs
2002, 170:73-82.
26. Barry F, Boynton R, Murphy M, Haynesworth S, Zaia J: The SH-3
and SH-4 antibodies recognize distinct epitopes on CD73
from human mesenchymal stem cells. Biochem Biophys Res
Commun 2001, 289:519-524.
27. Conget PA, Minguell JJ: Phenotypical and functional properties
of human bone marrow mesenchymal progenitor cells. J Cell
Physiol 1999, 181:67-73.
28. Fukiage K, Aoyama T, Shibata KR, Otsuka S, Furu M, Kohno Y, Ito
K, Jin Y, Fujita S, Fujibayashi S, Neo M, Nakayama T, Nakamura T,
Toguchida J: Expression of vascular cell adhesion molecule-1
indicates the differentiation potential of human bone marrow
stromal cells. Biochem Biophys Res Commun 2008,
365:406-412.
29. Gronthos S, Zannettino AC, Hay SJ, Shi S, Graves SE, Kortesidis
A, Simmons PJ: Molecular and cellular characterisation of
highly purified stromal stem cells derived from human bone
marrow. J Cell Sci 2003, 116:1827-1835.
30. Artavanis-Tsakonas S, Rand MD, Lake RJ: Notch signaling: cell
fate control and signal integration in development. Science
1999, 284:770-776.
31. Baron M: An overview of the Notch signalling pathway. Semin
Cell Dev Biol 2003, 14:113-119.
32. Baddoo M, Hill K, Wilkinson R, Gaupp D, Hughes C, Kopen GC,
Phinney DG: Characterization of mesenchymal stem cells iso-
lated from murine bone marrow by negative selection. J Cell
Biochem
2003, 89:1235-1249.
33. Chamberlain G, Fox J, Ashton B, Middleton J: Concise review:
mesenchymal stem cells: their phenotype, differentiation
capacity, immunological features, and potential for homing.
Stem Cells 2007, 25:2739-2749.
34. Jones DL, Wagers AJ: No place like home: anatomy and func-
tion of the stem cell niche. Nat Rev Mol Cell Biol 2008, 9:11-21.
35. De Bari C, Dell'accio F: Mesenchymal stem cells in rheumatol-
ogy: a regenerative approach to joint repair. Clin Sci (Lond)
2007, 113:339-348.
36. English A, Jones EA, Corscadden D, Henshaw K, Chapman T,
Emery P, McGonagle D: A comparative assessment of cartilage
and joint fat pad as a potential source of cells for autologous
therapy development in knee osteoarthritis. Rheumatology
(Oxford, England) 2007, 46:1676-1683.
37. Gimeno MJ, Maneiro E, Rendal E, Ramallal M, Sanjurjo L, Blanco
FJ: Cell therapy: a therapeutic alternative to treat focal carti-
lage lesions. Transplant Proc 2005, 37:4080-4083.
38. Dowthwaite GP, Bishop JC, Redman SN, Khan IM, Rooney P,
Evans DJ, Haughton L, Bayram Z, Boyer S, Thomson B, Wolfe MS,
Available online />Page 13 of 13
(page number not for citation purposes)
Archer CW: The surface of articular cartilage contains a pro-
genitor cell population. J Cell Sci 2004, 117:889-897.
39. Henson FM, Bowe EA, Davies ME: Promotion of the intrinsic
damage-repair response in articular cartilage by fibroblastic
growth factor-2. Osteoarthritis Cartilage 2005, 13:537-544.
40. Karlsson C, Brantsing C, Egell S, Lindahl A: Notch1, Jagged1,
and HES5 are abundantly expressed in osteoarthritis. Cells
Tissues Organs 2008, 188:287-298.
41. Goodell MA, Brose K, Paradis G, Conner AS, Mulligan RC: Isola-
tion and functional properties of murine hematopoietic stem
cells that are replicating in vivo. J Exp Med 1996,
183:1797-1806.
42. Goldring MB, Tsuchimochi K, Ijiri K: The control of chondrogen-
esis. J Cell Biochem 2006, 97:33-44.
43. Uhl M, Allmann KH, Ihling C, Hauer MP, Conca W, Langer M: Car-
tilage destruction in small joints by rheumatoid arthritis:
assessment of fat-suppressed three-dimensional gradient-
echo MR pulse sequences in vitro. Skeletal Radiol 1998,
27:677-682.
44. Thomas CM, Fuller CJ, Whittles CE, Sharif M: Chondrocyte death
by apoptosis is associated with cartilage matrix degradation.
Osteoarthritis Cartilage 2007, 15:27-34.
45. Xu L, Peng H, Glasson S, Lee PL, Hu K, Ijiri K, Olsen BR, Goldring
MB, Li Y: Increased expression of the collagen receptor discoi-
din domain receptor 2 in articular cartilage as a key event in
the pathogenesis of osteoarthritis. Arthritis Rheum 2007,
56:2663-2673.
46. Aigner T, Gebhard PM, Schmid E, Bau B, Harley V, Poschl E:
SOX9 expression does not correlate with type II collagen
expression in adult articular chondrocytes. Matrix Biol 2003,
22:363-372.
47. Youn I, Choi JB, Cao L, Setton LA, Guilak F: Zonal variations in
the three-dimensional morphology of the chondron measured
in situ using confocal microscopy. Osteoarthritis Cartilage
2006, 14:889-897.
48. Jaiswal N, Haynesworth SE, Caplan AI, Bruder SP: Osteogenic
differentiation of purified, culture-expanded human mesen-
chymal stem cells in vitro. J Cell Biochem
1997, 64:295-312.
49. Maniatopoulos C, Sodek J, Melcher AH: Bone formation in vitro
by stromal cells obtained from bone marrow of young adult
rats. Cell Tissue Res 1988, 254:317-330.
50. Diaz-Romero J, Gaillard JP, Grogan SP, Nesic D, Trub T, Mainil-
Varlet P: Immunophenotypic analysis of human articular
chondrocytes: changes in surface markers associated with
cell expansion in monolayer culture. J Cell Physiol 2005,
202:731-742.
51. Jakob M, Demarteau O, Schafer D, Stumm M, Heberer M, Martin I:
Enzymatic digestion of adult human articular cartilage yields a
small fraction of the total available cells. Connect Tissue Res
2003, 44:173-180.
52. Hattori S, Oxford C, Reddi AH: Identification of superficial zone
articular chondrocyte stem/progenitor cells. Biochem Biophys
Res Commun 2007, 358:99-103.
53. Karlsson C, Stenhamre H, Sandstedt J, Lindahl A: Neither Notch1
expression nor cellular size correlate with mesenchymal stem
cell properties of adult articular chondrocytes. Cells Tissues
Organs 2008, 187:275-285.
54. Chaturvedi V, Qin JZ, Denning MF, Choubey D, Diaz MO, Nickoloff
BJ: Apoptosis in proliferating, senescent, and immortalized
keratinocytes. J Biol Chem 1999, 274:23358-23367.
55. Zlobin A, Jang M, Miele L: Toward the rational design of cell fate
modifiers: notch signaling as a target for novel biopharmaceu-
ticals. Curr Pharm Biotechnol 2000, 1:83-106.
56. Baldi A, De Falco M, De Luca L, Cottone G, Paggi MG, Nickoloff
BJ, Miele L, De Luca A: Characterization of tissue specific
expression of Notch-1 in human tissues. Biol Cell 2004,
96:303-311.
57. Hunziker EB, Kapfinger E, Geiss J: The structural architecture of
adult mammalian articular cartilage evolves by a synchronized
process of tissue resorption and neoformation during postna-
tal development. Osteoarthritis Cartilage 2007, 15:403-413.
58. Karatay S, Kiziltunc A, Yildirim K, Karanfil RC, Senel K: Effects of
different hyaluronic acid products on synovial fluid levels of
intercellular adhesion molecule-1 and vascular cell adhesion
molecule-1 in knee osteoarthritis. Ann Clin Lab Sci 2004,
34:330-335.
59. Klimiuk PA, Sierakowski S, Latosiewicz R, Cylwik JP, Cylwik B,
Skowronski J, Chwiecko J: Soluble adhesion molecules (ICAM-
1, VCAM-1, and E-selectin) and vascular endothelial growth
factor (VEGF) in patients with distinct variants of rheumatoid
synovitis. Ann Rheum Dis 2002, 61:804-809.
60. Grogan SP, Olee T, Hiraoka K, Lotz MK: Repression of chondro-
genesis through binding of notch signaling proteins HES-1
and HEY-1 to N-box domains in the COL2A1 enhancer site.
Arthritis Rheum 2008, 58:2754-2763.
61. Fukui N, Ikeda Y, Ohnuki T, Tanaka N, Hikita A, Mitomi H, Mori T,
Juji T, Katsuragawa Y, Yamamoto S, Sawabe M, Yamane S, Suzuki
R, Sandell LJ, Ochi T: Regional differences in chondrocyte
metabolism in osteoarthritis: a detailed analysis by laser cap-
ture microdissection. Arthritis Rheum 2008, 58:154-163.
62. Martin I, Jakob M, Schafer D, Dick W, Spagnoli G, Heberer M:
Quantitative analysis of gene expression in human articular
cartilage from normal and osteoarthritic joints. Osteoarthritis
Cartilage 2001, 9:112-118.
63. Pullig O, Weseloh G, Swoboda B: Expression of type VI colla-
gen in normal and osteoarthritic human cartilage. Osteoarthri-
tis Cartilage 1999, 7:191-202.
64. Aigner T, Zhu Y, Chansky HH, Matsen FA 3rd, Maloney WJ, Sand-
ell LJ: Reexpression of type IIA procollagen by adult articular
chondrocytes in osteoarthritic cartilage. Arthritis Rheum 1999,
42:1443-1450.
65. Tyyni A, Karlsson J: Biological treatment of joint cartilage dam-
age. Scand J Med Sci Sports 2000, 10:249-265.