Báo cáo y học: " Relationship of compartment-specific structural knee status at baseline with change in cartilage morphology: a prospective observational study using data from the osteoarthritis initiative" pps
Bạn đang xem bản rút gọn của tài liệu. Xem và tải ngay bản đầy đủ của tài liệu tại đây (756.08 KB, 10 trang )
Open Access
Available online />Page 1 of 10
(page number not for citation purposes)
Vol 11 No 3
Research article
Relationship of compartment-specific structural knee status at
baseline with change in cartilage morphology: a prospective
observational study using data from the osteoarthritis initiative
Felix Eckstein
1,2
, Wolfgang Wirth
1,2
, Martin I Hudelmaier
1,2
, Susanne Maschek
1,2
, Wolfgang Hitzl
3
,
Bradley T Wyman
4
, Michael Nevitt
5
, Marie-Pierre Hellio Le Graverand
5
, David Hunter
6
and the OA
Initiative Investigator Group
1
Institute of Anatomy and Musculoskeletal Research, Paracelsus Medical University, Strubergasse 21, A5020 Salzburg, Austria
2
Chondrometrics GmbH, Ulrichshöglerstrasse 23, D83404 Ainring, Germany
3
Research Office, Paracelsus Medical University, Strubergasse 21, A 5020 Salzburg, Austria
4
Pfizer Global Research and Development, 50 Pequot Ave, New London, CT 06320, USA
5
University of California and OA Initiative Coordinating Center, 185 Berry Street, San Francisco, CA 94107, USA
6
Division of Research, New England Baptist Hospital, 125 Parker Hill Avenue, Boston, MA 02120, USA
Corresponding author: Felix Eckstein,
Received: 2 Mar 2009 Revisions requested: 14 Apr 2009 Revisions received: 5 May 2009 Accepted: 17 Jun 2009 Published: 17 Jun 2009
Arthritis Research & Therapy 2009, 11:R90 (doi:10.1186/ar2732)
This article is online at: />© 2009 Eckstein et al.; licensee BioMed Central Ltd.
This is an open access article distributed under the terms of the Creative Commons Attribution License ( />),
which permits unrestricted use, distribution, and reproduction in any medium, provided the original work is properly cited.
Abstract
Introduction The aim was to investigate the relationship of
cartilage loss (change in medial femorotibial cartilage thickness
measured with magnetic resonance imaging (MRI)) with
compartment-specific baseline radiographic findings and MRI
cartilage morphometry features, and to identify which baseline
features can be used for stratification of fast progressors.
Methods An age and gender stratified subsample of the
osteoarthritis (OA) initiative progression subcohort (79 women;
77 men; age 60.9 ± 9.9 years; body mass index (BMI) 30.3 ±
4.7) with symptomatic, radiographic OA in at least one knee was
studied. Baseline fixed flexion radiographs were read centrally
and adjudicated, and cartilage morphometry was performed at
baseline and at one year follow-up from coronal FLASH 3 Tesla
MR images of the right knee.
Results Osteophyte status at baseline was not associated with
medial cartilage loss. Knees with medial joint space narrowing
tended to show higher rates of change than those without, but
the relationship was not statistically significant. Knees with
medial femoral subchondral bone sclerosis (radiography),
medial denuded subchondral bone areas (MRI), and low
cartilage thickness (MRI) at baseline displayed significantly
higher cartilage loss than those without, both with and without
adjusting for age, sex, and BMI. Participants with denuded
subchondral bone showed a standardized response mean of up
to -0.64 versus -0.33 for the entire subcohort.
Conclusions The results indicate that radiographic and MRI
cartilage morphometry features suggestive of advanced disease
appear to be associated with greater cartilage loss. These
features may be suited for selecting patients with a higher
likelihood of fast progression in studies that attempt to
demonstrate the cartilage-preserving effect of disease-
modifying osteoarthritis drugs.
Introduction
The Osteoarthritis (OA) Initiative is a program targeted at char-
acterizing risk factors associated with the onset and progres-
sion of symptomatic knee OA and at identifying sensitive
biomarkers of symptomatic knee OA. To this end, fixed flexion
radiography [1-5] and 3 Tesla magnetic resonance imaging
ANOVA: analysis of variance; BMD: bone mineral density; BMI: body mass index; ccMF: central aspect of the weight bearing medial femoral condyle;
cMF: weight bearing medial femoral condyle; cMFTC: central medial femorotibial compartment; cMT: central medial tibia; FLASH: fast low angle shot;
GLM: general linear models; JSN: joint space narrowing; JSW: joint space width; KLG: Kellgren Lawrence grade; MFTC: medial femorotibial com-
partment; mJSN: medial joint space narrowing; MRI: magnetic resonance imaging; MT: medial tibia; OA: osteoarthritis; SRM: standardized response
mean; ThCtAB: change in cartilage thickness.
Arthritis Research & Therapy Vol 11 No 3 Eckstein et al.
Page 2 of 10
(page number not for citation purposes)
(MRI) scans [6-8] were performed at baseline and at regular
follow-up in 4796 participants. We [9,10] and others [11]
have recently reported a modest (but significant) change in
femorotibial cartilage morphology over one year in the first
publicly released longitudinal data in an age- and gender-strat-
ified subcohort of 160 participants [12]. Potential predispos-
ing factors of subsequent cartilage loss, including age, sex,
body mass index (BMI), symptom status, and the Kellgren
Lawrence grade (KLG), were assessed. Cartilage loss was
found to be more prominent in the medial (than in the lateral)
femorotibial compartment, and more prominent in the weight-
bearing femur than in the tibia [9-11]. Participants with high
BMI and radiographic OA (as determined by the KLG [13])
were observed to display trends toward higher rates of change
than those with lower BMI and without radiographic OA [9],
although the relation failed to reach statistical significance.
The limitation of the KLG [13], however, is that it mixes distinct
constructs (osteophytes, joint space narrowing (JSN),
subchondral sclerosis, subchondral bone shape changes,
cysts, etc) into one scale with the invalid assumptions that
changes are linear [14].
In addition, the KLG is not specific to the medial or lateral fem-
orotibial compartment. The association of compartment-spe-
cific baseline MRI cartilage morphology measures with
longitudinal cartilage loss has not been previously investigated
in this cohort. An accurate stratification during study recruit-
ment with regard to 'progressors' with relatively rapid cartilage
loss is, however, important, because the potential therapeutic
effect of a disease-modifying OA drug can be demonstrated
using much lower sample sizes if only participants with a high
likelihood of fast progression are recruited.
The objective of the current study was therefore to determine
whether compartment-specific individual radiographic fea-
tures (JSN, osteophytes, sclerosis, and others) at baseline,
and compartment-specific structural status of the knee carti-
lage in MRI (specifically denuded subchondral bone area and
cartilage thickness) are predictive of longitudinal medial femo-
rotibial cartilage thickness loss over one year.
Materials and methods
An age- and gender-stratified subsample (OA Initiative public-
use datasets 0.1.1, 0.B.1, and 1.B.1) of the OA Initiative pro-
gression subcohort was studied, with the exclusion criteria (i.e.
rheumatoid or inflammatory arthritis, bilateral end stage knee
OA, inability to walk without aids, and 3 Tesla MRI contraindi-
cations) and other details having been described previously
[9]. The OA Initiative is conducted in compliance with the eth-
ical principles derived from the Declaration of Helsinki and in
compliance with local Institutional Review Board, informed
consent regulations, and International Conference on Harmo-
nization Good Clinical Practices Guidelines.
The subsample studied included 79 women with a mean ±
standard deviation age of 60.3 ± 9.5 years and BMI of 30.3 ±
5.5, and 77 men with an age of 62.0 ± 10.2 years and BMI of
30.1 ± 3.7. The age range examined was 45 to 79 years. All
participants had frequent knee symptoms, and radiographic
OA, as defined by definite osteophytes in the postero-anterior
fixed flexion radiographs [1,2] in at least one knee from the
clinical site readings.
The current analysis relied on the results of the independent
radiographic readings by a musculoskeletal radiologist and
rheumatologist, which in cases of discrepancy were adjudi-
cated by consensus with a third reader. The following features
were graded on the baseline radiograph based on the Oste-
oarthritis Research Society International atlas: medial and lat-
eral JSN (graded 0 to 3) [15,16]; medial and lateral tibial and
femoral osteophytes (graded 0 to 3) [15,16]; medial and lat-
eral tibial and femoral subchondral sclerosis (graded 0 to 3)
[15,16]; medial and lateral tibial subchondral bone attrition
(graded 0 to 3) [15,16]; medial and lateral tibial and femoral
cysts (graded 0 or 1); medial and lateral compartment chon-
drocalcinosis (graded 0 or 1).
The MRI sequence used to quantify cartilage morphology (see
below) was only acquired in the right knees [17], whereas
some participants displayed symptoms and radiographic OA
in their left knee. As a result of this and because the adjudi-
cated central radiographic readings may have differed from
the initial screening readings, not all knees analyzed had radi-
ographic (or symptomatic) knee OA. Of the 156 right knees
analyzed, 17 (11%) were KLG 0, 29 (19%) KLG1, 56 (36%)
KLG 2, 47 (30%) KLG 3, and 7 (4%) were KLG 4.
MRI was performed using four 3 Tesla scanners (Siemens
Magnetom Trio, Erlangen, Germany) and quadrature transmit-
receive knee coils (USA Instruments, Aurora, OH, USA). Dou-
ble oblique coronal 3D fast low angle shot (FLASH) MRI with
water excitation were acquired as described previously [6-9]
(Figure 1). After initial quality control at the image analysis
center (Chondrometrics GmbH, Ainring, Germany), manual
segmentation of the femorotibial cartilages was performed by
seven technicians with at least three years of experience in
cartilage segmentation [6-9,18] (Figure 1). The image data
were processed in pairs (baseline and one year follow up), the
readers being blinded to the order of the image acquisition.
Because of the higher rate of change in the medial compart-
ment that was reported previously [9,11], and because of the
relatively few subjects with lateral radiographic femorotibial
OA (see below), medial cartilage loss was used as an out-
come measure (Figure 1). However, knees with predominantly
lateral radiographic OA were not eliminated from the study.
Specifically, we analyzed one year changes in the mean carti-
lage thickness over the total subchondral bone area (ThCtAB)
in the medial tibia (MT), central (weight bearing) medial femo-
Available online />Page 3 of 10
(page number not for citation purposes)
ral condyle (cMF [6,7]; Figure 1), and medial femorotibial com-
partment (MFTC = summed values of MT and cMF).
As changes in central subregions of the above plates were
shown to display greater changes than the total cartilage
plates in this subcohort [10], we also considered the central
tibia (cMT, covering the central 20% of the subchondral bone
area), the central weight-bearing medial femur (ccMF, cover-
ing 33%) and the central MFTC (cMFTC = sum of cMT and
ccMF) as outcome measures [19] (Figure 2). The mean
change, standard deviation of change, standardized response
mean (SRM), and the significance of the change (two sided
paired t-test, without correction for multiple testing) were cal-
culated for each measure. The SRM provides a measure of the
'sensitivity to change' and was computed by dividing mean
change in a given group or subgroup by the standard deviation
of the change in this group or subgroup. A negative SRM
expresses cartilage loss, and the greater (more negative) the
SRM, the greater and more uniform is the cartilage loss in a
given group or subgroup. The mean percentage change was
calculated by relating the mean change (in mm) in all knees to
the mean baseline values of all knees.
The following baseline features of quantitative MRI of cartilage
morphology were examined in the context of predicting
change: mean cartilage thickness over the total subchondral
bone area (ThCtAB) in MT, cMF, and MFTC, and presence of
a denuded area of more than 1% of the total subchondral bone
area in MT, cMF, or MFTC. Percentage values in MT and cMF
were added to provide a measure of denuded bone area in
MFTC. The cut-off value of more than 1% was chosen to
exclude small areas of an uncovered total area of subchondral
bone (three cases in MT, no case in cMF) that may potentially
result from small imaging artifacts.
Analysis of variance (ANOVA) was used first to test whether
categorical features of structural knee status in fixed flexion
radiographs or MRI cartilage morphometry (JSN, osteophytes,
subchondral sclerosis, presence of denuded areas of
subchondral bone) were significantly associated with cartilage
loss over one year, as measured in absolute thickness change
(mm). General linear models (GLM) were then used to assess
the relation of these features with cartilage loss after adjusting
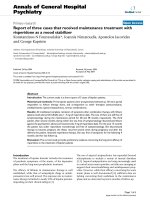
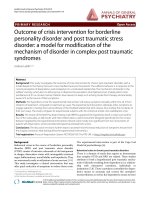
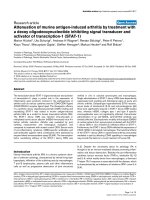
Figure 1
Knee magnetic resonance image obtained with fast low angle shot (FLASH) sequences with water excitationKnee magnetic resonance image obtained with fast low angle shot
(FLASH) sequences with water excitation. (a) Double oblique coronal
image showing the regions of interest used in the current analysis. (b)
Same coronal image with the total area of subchondral bone (tAB)
being segmented in green, the area of the cartilage surface (AC) in
magenta, and the filling between the two surfaces in turquoise. Note
the denuded area (tAB not covered by AC) in the medial tibia and the
medial femur. (c) Same coronal image with the medial tibial (MT) carti-
lage marked (segmented) blue, weight-bearing medial femoral cartilage
(cMF) marked yellow, the lateral tibial cartilage marked green, and the
lateral weight-bearing femoral cartilage marked red. (d) 3D reconstruc-
tions of knee cartilage plates from a sagittal data set in a different per-
son: The femoro-tibial cartilages are labeled with the same colors as in
(c), the patellar cartilage is labeled magenta and the trochlear (femoral)
cartilage in turquoise.
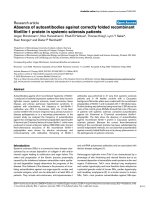
Figure 2
Cartilage plates and subregions used as outcome measures in this studyCartilage plates and subregions used as outcome measures in this
study. (a) Inferior view of the weight-bearing (central) part of the medial
(cMF) and lateral femoral condyle (cLF). ccMF = central third of cMF
(icMF and ecMF = internal and external third of cMF, respectively). (b)
Posterior view of the femorotibial joint. MFTC = cMF + MT; cMFTC =
ccMF + cMT. (c) Superior view of the medial (MT) and lateraltibia (LT).
cMT = central part of MT (iMT, eMT, aMT, and pMT = internal, external,
anterior, and posterior parts of MT, respectively).
Arthritis Research & Therapy Vol 11 No 3 Eckstein et al.
Page 4 of 10
(page number not for citation purposes)
for age, sex, and BMI, and to test whether the continuous var-
iable 'ThCtAB at baseline' was significantly associated with
cartilage loss.
Results
Structural changes in fixed flexion radiography at
baseline
The frequency of radiographic features of OA present in this
subcohort is displayed in Table 1. Only a few participants
showed bone cysts, chondrocalcinosis, or subchondral bone
attrition, and these features were therefore not considered for
further analysis.
Of 70 knees without medial JSN (mJSN), 32 (46%) had no
medial (tibial or femoral) osteophytes and 38 (64%) displayed
medial osteophytes. Of 86 knees with mJSN, 76 (88%) also
displayed definite osteophytes and 10 (12%) did not. Lateral
JSN was less frequent than medial JSN (Table 1). In 80 knees
(51%), the mJSN grade was higher than the lateral JSN grade,
in 56 (36%) it was the same, and in 20 (13%) the lateral JSN
grade was higher than the medial compartment.
When taking the maximal osteophyte score of the medial tibia
and femur in each subject, 42 subjects (27%) had no medial
tibiofemoral osteophyte, 53 (34%) displayed grade 1 osteo-
phytes, 21 (13%) grade 2 osteophytes, and 40 (26%) grade
3 osteophytes.
Relation of structural changes in fixed flexion
radiography at baseline with longitudinal changes in
cartilage thickness (cartilage loss)
The rate of change, sensitivity to change (SRM), and signifi-
cance of the change in cartilage thickness (ThCtAB) for the
MFTC is shown in Table 2. Across all 156 subjects, the great-
est (most negative) SRM (-0.33) was observed in the cMFTC.
The mean change and SRM of cMFTC tended to be greater in
knees with the presence of medial JSN (grades 1 to 3: -2.4%;
-0.44) than in those without JSN (-1.1%; -0.22), but the differ-
ence did not attain statistical significance in the univariate
(ANOVA) or multifactorial (GLM) analysis (P = 0.66 and r
2
=
2.0% after adjusting for age, sex, and BMI). Age, sex, and BMI
were no significant predictors in the multifactorial model. This
also applied to the other medial cartilage plates and subre-
gions (Table 2). The relatively greatest change (-5.6%; ccMF)
and SRM (-0.50; cMF) was found in participants with grade 2
or 3 medial JSN (Table 2). No significant effect of the pres-
ence of lateral JSN at baseline was observed on the rate of
change in the medial compartment.
Participants with and without medial femorotibial osteophytes
displayed no significant differences in the rate and sensitivity
to change in cartilage thickness (Table 3). The same observa-
tion applied to the presence and absence of lateral osteo-
phytes (data not shown).
Knees with medial femoral subchondral bone sclerosis
showed significantly greater cartilage loss in the univariate and
multifactorial analyses (up to -6.6% and SRMs up to -0.48;
Table 4) in cMF (P < 0.05; r
2
= 5.7%), ccMF (P < 0.05; r
2
=
4.7%), MFTC (P < 0.05; r
2
= 5.3%), and cMFTC (P < 0.05; r
2
= 4.5%) than those without sclerosis (up to -1.4% and SRM
= -0.23; Table 4). Again, age, sex, and BMI did not make a sig-
nificant contribution in the GLM. Knees with medial tibial
subchondral bone sclerosis also generally displayed greater
cartilage loss than those without, but the difference did not
reach statistical significance (Table 4). No significant differ-
ences in progression were detected between knees with and
without lateral tibial or femoral subchondral bone sclerosis
(data not shown).
Table 1
Frequency (n) of structural abnormalities on adjudicated reading of baseline fixed flexion radiographs
Grade 0Grade 1Grade 2Grade 3
Medial joint space narrowing 70 46 35 5
Lateral joint space narrowing 130 14 10 2
Medial tibia osteophyte 51 73 23 9
Medial femoral osteophyte 77 20 20 39
Medial subchondral tibial sclerosis 103 32 17 4
Medial subchondral femoral sclerosis 100 35 16 5
Medial tibial cysts 142 14 - -
Medial femoral cysts 155 1 - -
Medial chondrocalcinosis 139 17 - -
Medial tibial bone attrition 154 2 - -
Available online />Page 5 of 10
(page number not for citation purposes)
Structural changes in MRI at baseline
Thirty-four participants (22%) displayed a tibial denuded area
in MRI (>1%), with the size ranging from 1.3% to 32% of the
total area of subchondral bone (median = 10.7%). Thirty-six
participants (23%) showed a femoral denuded area that
ranged from 1.6% to 65% (median = 10.9%). Fifty knees
(32%) displayed either tibial or femoral, and 20 knees (13%)
both tibial and femoral denuded area.
Relation of structural changes in MRI at baseline with
longitudinal changes in cartilage thickness (cartilage
loss)
Knees with a denuded area in MFTC showed a significantly
greater cartilage loss in MT (P < 0.01; r
2
= 6.4%) and cMT (P
< 0.001; r
2
= 8.0%) than knees without denuded areas (Table
5). Knees with denuded areas in cMF also displayed signifi-
cantly greater cartilage loss in MT (P < 0.05; r
2
= 5.3%) and
cMT (P < 0.001; r
2
= 8.4%) than those without a denuded
area in cMF. These observations were consistent in the univar-
iate and multifactorial analyses. No significant differences
were observed for knees with and without denuded areas in
MT, or for other outcomes. The greatest SRM (-0.64) was
observed for the change in cMFTC in subjects with a denuded
area in cMF (Table 5).
Smaller baseline cartilage thickness in MT was significantly
associated with greater cartilage loss in MT (P < 0.05; r
2
=
2.9%) and cMT (P < 0.05; r
2
= 3.8%), and smaller baseline
cartilage thickness in cMF was significantly associated with
greater cartilage loss in cMF (P < 0.05; r
2
= 3.5%). Thin carti-
lage in both MT and cMF (MFTC) was significantly associated
Table 2
Change in cartilage thickness (ThCtAB) over one year in all participants and in participants with and without medial femoro-tibial
joint space narrowing (mJSN) at baseline
All (n = 156) mJSN 0 (n = 70) mJSN 1 (n = 46) mJSN 2 or 3 (n = 40)
MC% SRM P (FUvs.BL) MC% SRM P (FUvs.BL) MC% SRM P (FUvs.BL) MC% SRM P (FUvs.BL)
MT -0.5 -0.16 0.04274 -0.2 -0.09 0.4554 -0.7 -0.23 0.1215 -0.9 -0.20 0.2115
cMF -1.9 -0.30 0.00021 -1.0 -0.19 0.1244 -1.8 -0.31 0.0399 -4.4 -0.50 0.0033
MFTC -1.2 -0.31 0.00015 -0.7 -0.19 0.1231 -1.3 -0.38 0.0134 -2.5 -0.45 0.0069
cMT -0.9 -0.20 0.01505 -0.3 -0.08 0.4819 -1.0 -0.25 0.0975 -1.8 -0.31 0.0606
ccMF -2.8 -0.31 0.00013 -1.9 -0.23 0.0537 -2.8 -0.34 0.0274 -5.6 -0.45 0.0066
cMFTC -1.7 -0.33 0.00005 -1.1 -0.22 0.0704 -1.9 -0.40 0.0090 -3.2 -0.47 0.0046
The P value indicates the level of significance for changes between year one follow up (FU) versus baseline (BL) data using a paired t-test.
ccMF = central subregion of the weight bearing medial femoral condyle; cMF = weight bearing medial femoral condyle; cMFTC = central medial
femorotibial compartment; cMT = central subregion of the medial tibia; MC% = mean change (in %); MFTC = medial femorotibial compartment;
MT = medial tibia; SRM = standardized response mean (mean change/SD of change).
Table 3
Change in cartilage thickness (ThCtAB) over one year in participants with various grades of medial femorotibial osteophytes (mOP)
at baseline
mOP 0 (n = 42) mOP 1 (n = 53) mOP 2 (n = 21) mOP 3 (n = 40)
MC% SRM P (FUvs.BL) MC% SRM P (FUvs.BL) MC% SRM P (FUvs.BL) MC% SRM P (FUvs.BL)
MT -1.1 -0.46 0.00475 0.0 0.01 0.94330 -1.0 -0.24 0.28311 -0.3 -0.10 0.52858
cMF -1.9 -0.35 0.02844 -1. 7 -0.31 0.02878 -2.6 -0.40 0.08254 -1.8 -0.21 0.18398
MFTC -1.5 -0.46 0.00509 -0.9 -0.23 0.10443 -1.8 -0.39 0.09264 -1.0 -0.24 0.14224
cMT -1.5 -0.42 0.00889 0.0 -0.01 0.94955 -1.7 -0.31 0.16985 -0.7 -0.15 0.35837
ccMF -2.6 -0.33 0.04059 -2.9 -0.40 0.00582 -3.5 -0.36 0.11512 -2.3 -0.20 0.21479
cMFTC -2.1 -0.42 0.00987 -1.4 -0.31 0.02639 -2.5 -0.39 0.08638 -1.4 -0.24 0.14412
The P value indicates the level of significance for changes between year one follow up (FU) versus baseline (BL) data using a paired t-test.
ccMF = central subregion of the weight bearing medial femoral condyle; cMF = weight bearing medial femoral condyle; cMFTC = central medial
femorotibial compartment; cMT = central subregion of the medial tibia; MC% = mean change (in %); MFTC = medial femorotibial compartment;
MT = medial tibia; SRM = standardized response mean (mean change/SD of change).
Arthritis Research & Therapy Vol 11 No 3 Eckstein et al.
Page 6 of 10
(page number not for citation purposes)
with greater cartilage loss in cMT (P < 0.05; r
2
= 4.2%) after
adjusting for age, sex, and BMI in the GLM.
Discussion
This study investigates the relation of compartment-specific
structural radiographic knee and MRI cartilage status at base-
line with medial femorotibial cartilage thickness loss over one
year as measured by 3 Tesla MRI. The results indicate that
knees with more advanced medial femorotibial disease display
greater cartilage loss than those with less advanced disease.
Osteophytes, which represent early radiographic features of
OA, did not predict cartilage loss in the current study, but
knees with medial JSN tended to exhibit greater cartilage loss
in the MFTC than those without JSN, although the relation was
not significant. Subchondral femoral sclerosis (radiography),
denuded subchondral bone area (MRI), and lower cartilage
thickness (in MRI) at baseline displayed significant relations
with at least some of the outcome measures of medial carti-
lage loss, all of these representing measures of relatively
advanced disease. Whereas in the entire cohort the greatest
SRM was -0.33 (change in cMFTC), the SRM was -0.47 in
knees with grades 2/3 medial JSN, -0.46/-0.47 in knees with
tibial and femoral subchondral sclerosis, and -0.64 in knees
with denuded areas in the weight-bearing femur.
The subcohort examined here was the first one made public by
the OA Initiative. It represents a stratified random sample of
subjects with complete baseline and 12-month imaging data
available as of April 2006, with strata roughly equal by gender
and clinical/imaging site. Although it was not intended to be a
random sample of the entire progression subcohort, the156
subjects analyzed show baseline characteristics similar to the
Table 4
Change in cartilage thickness (ThCtAB) over one year in participants with and without medial subchondral bone sclerosis at
baseline
No tibial sclerosis (n = 103) Tibial sclerosis (n = 53) No femoral sclerosis (n = 100) Femoral sclerosis (n = 56)
MC% SRM P (FUvs.BL) MC% SRM P (FUvs.BL) MC% SRM P (FUvs.BL) MC% SRM P (FUvs.BL)
MT -0.3 -0.13 0.19393 -0.9 -0.22 0.12093 -0.3 -0.11 0.26937 -1.0 -0.24 0.08337
cMF -1.4 -0.23 0.02012 -3.2 -0.46 0.00168 -0.8 -0. 17 0.08584 -4.6 -0.48 0.00064
MFTC -0.9 -0.24 0.01704 -2. 0 -0.46 0.00168 -0.6 -0.19 0.05783 -2.7 -0.48 0.00074
cMT -0.5 -0.14 0.15907 -1.6 -0.29 0.04127 -0.4 -0.12 0.22676 -1.7 -0.31 0.02597
ccMF -2.3 -0.27 0.00678 -4.2 -0.42 0.00369 -1.4 -0.23 0.02596 -6.6 -0.44 0.00171
cMFTC -1.4 -0.27 0.00639 -2.7 -0.46 0.00141 -0.9 -0.24 0.01730 -3.7 -0.47 0.00094
The P value indicates the level of significance for changes between year one follow up (FU) versus baseline (BL) data using a paired t-test.
ccMF = central subregion of the weight bearing medial femoral condyle; cMF = weight bearing medial femoral condyle; cMFTC = central medial
femorotibial compartment; cMT = central subregion of the medial tibia; MC% = mean change (in %); MFTC = medial femorotibial compartment;
MT = medial tibia; SRM = standardized response mean (mean change/SD of change).
Table 5
Change in cartilage thickness (ThCtAB) over one year in participants with without and with more than 1% denuded area (dAB) in the
medial tibia or the medial weight-bearing femoral condyle at baseline
No MFTC.dAB > 1% (n = 106) MFTC.dAB > 1% (n = 50) MT.dAB > 1% (n = 37) cMF.dAB > 1% (n = 36)
MC% SRM P (FUvs.BL) MC% SRM P (FUvs.BL) MC% SRM P (FUvs.BL) MC% SRM P (FUvs.BL)
MT -0.1 -0.04 0.69131 -1.6 -0.43 0.00602 -1.6 -0.42 0.02582 -1.9 -0.51 0.00539
cMF -1.9 -0.34 0.00073 -2.2 -0.25 0.09440 -1.4 -0.15 0.41551 -4.4 -0.51 0.00540
MFTC -1.0 -0.30 0.00256 -1.9 -0.35 0.02198 -1.5 -0.27 0.14541 -3.0 -0.57 0.00232
cMT -0.3 -0.07 0.47903 -2.4 -0.46 0.00318 -2.5 -0.42 0.02605 -3.4 -0.62 0.00105
ccMF -2.9 -0.35 0.00044 -2.7 -0.23 0.12063 -1.8 -0.14 0.44502 -5.4 -0.47 0. 01001
cMFTC -1.5 -0.32 0.00134 -2.5 -0.38 0.01261 -2.2 -0.29 0.11271 -4.2 -0.64 0.00074
The P value indicates the level of significance for changes between year one follow up (FU) versus baseline (BL) data using a paired t-test.
ccMF = central subregion of the weight bearing medial femoral condyle; cMF = weight bearing medial femoral condyle; cMFTC = central medial
femorotibial compartment; cMT = central subregion of the medial tibia; MC% = mean change (in %); MFTC = medial femorotibial compartment;
MT = medial tibia; SRM = standardized response mean (mean change/SD of change).
Available online />Page 7 of 10
(page number not for citation purposes)
entire OA Initiative progression subcohort (n = 1389; age
range 45 to 79 years; 57% women with an age of 61.5 ± 8.9
years and a BMI of 30.8 ± 5.4; 43% men with an age of 61.1
± 9.3 years and a BMI of 29.8 ± 4.1). A breakdown of calcu-
lated KLGs for all right knees for the entire progression subco-
hort in comparison with the subsample investigated here (2%
vs. 11% KLG 0, 13% vs. 19% KLG1, 31% vs. 36% KLG 2,
39% vs. 30% KLG 3, and 15% vs. 4% KLG 4) shows that the
current sample included more cases with no or possible radi-
ographic OA (KLG0/1) and fewer cases with severe radio-
graphic OA (KLG4) than the right knees of the entire
progression subcohort, but both samples span all grades of
radiographic OA.
Although a larger set of image data has been made public by
the OA Initiative, central and compartment-specific radio-
graphic readings (on which these analyses relied) have so far
only been performed for the subsample used in this analysis.
The statistical power of the current study is therefore limited by
the relatively small sample size, which also introduces the
potential problem of type 2 error, given the relatively large
number of features examined. However, the features examined
have been analyzed, but were not interpreted in isolation, in
that most of the features found to be associated with higher
rates of cartilage loss and greater SRMs were features of
advanced structural disease. The current results should never-
theless be viewed as exploratory and must be confirmed in
another (larger) sample, before recruitment approaches are
based on any of the radiographic or MRI features investigated
here. Also, the specific radiographic and MRI features studied
must be seen in the context of other potentially predisposing
risk factors, such as meniscal extrusion and damage [20-22],
bone marrow alterations [21-23], focal cartilage defects
[24,25], and limb alignment [26-30], as some of these may be
directly or indirectly associated with the described compart-
ment-specific radiographic or MRI features.
Additionally, there exist other potential predisposing factors of
structural progression, for which less clear evidence or even
contradictory results have been provided, including pain, joint
function, physical activity levels [31], synovitis (effusion) [32],
sex hormone levels [33,34], and serum or urine biomarkers
[35], which eventually need to be taken into account. Another
limitation of the study is that, given the limited number of cases
and the greater progression observed in the MFTC in this sub-
cohort [9-11], the analysis was deliberately limited to MFTC
outcomes, whereas some participants also showed progres-
sion in the lateral compartment. Only femorotibial, but not fem-
oropatellar, radiographic features were analyzed, again
because of the limited sample size, and because no femorop-
atellar readings have yet been provided by the OA Initiative.
Only the right knee was analyzed, because the MRI sequence
used for cartilage morphometry (FLASH) was only acquired in
the right, but not in the left knees [17], so that not all knees dis-
played radiographic and/or symptomatic OA. This, however,
allowed us to examine the potential predictive value of radio-
graphic and MRI features across knees with a relatively wide
range of radiographic status. The decision to analyze the
FLASH sequence acquired in all right knees, rather than the
DESS sequence that was available for both knees, was made
to allow to directly link the results to previous findings in other
cohorts, which have to date been based on FLASH or SPGR
sequences.
The strength of the current study is that it uses validated quan-
titative MRI technology as a measure of structural disease pro-
gression, which has been shown to be more powerful in
revealing risk factor associations than semi-quantitative scor-
ing of cartilage status [28]. Cartilage loss, as measured with
MRI over relatively short periods (1 or 2 years), has been
shown to be associated with cartilage loss over longer periods
(4.5 years) [36] and with a clinical outcome of OA, specifically
knee arthroplasty [37], which makes it a very promising surro-
gate endpoint. Also, the current analysis relied on central radi-
ographic readings of the OA Initiative imaging data, which was
adjudicated in case of discrepancy between two independent
readers, and has been shown to deviate in a substantial
number of cases from the site readings used for the purpose
of recruiting participants for the OA Initiative [11]. Despite the
many structural features examined and lack of statistical signif-
icance for some of these, the features suggestive of advanced
disease pointed towards greater longitudinal cartilage loss
compared with knees with less advanced disease.
Felson and colleagues [38] reported that higher osteophyte
scores modestly increased the risk of OA progression
(defined by increasing JSN over 30 months), in particular
when compartment-specific relations were analyzed. The
authors mentioned that this association became weaker to
non-significant when adjusting for limb alignment. Wolfe and
Lane [39] reported that JSN at baseline was a strong predictor
of OA progression (defined by advancing to radiographic JSN
grade 3) in more than 1500 patients, whereas BMI and osteo-
phytes were less predictive and only contributed in partici-
pants with no JSN at baseline. Mazzuca and colleagues [40]
also found the progression of JSN over 30 months to be
inversely related to baseline joint space width (JSW) and Le
Graverand and colleagues [41] the reduction in JSW to be
greater in knees with JSN at baseline, using fluoroscopically
standardized knee radiographs. In contrast to these and our
current findings, Bruyere and colleagues [42] reported
patients in the highest quartile of baseline JSW to experience
more severe cartilage loss than those in the lowest quartile
and thus recommended the inclusion of participants with less
severe OA (high JSW, no JSN) in disease-modifying OA drug
trials.
Few studies have so far investigated the relationship between
MRI-based cartilage loss and radiographic features of OA at
baseline. Raynauld and colleagues [21] found no significant
Arthritis Research & Therapy Vol 11 No 3 Eckstein et al.
Page 8 of 10
(page number not for citation purposes)
association of MRI-based cartilage loss over 24 months with
the radiographic JSW at baseline. However, another analysis
from the same group [22] reported that cartilage loss in the
central aspects of the femorotibial cartilage plates was asso-
ciated with smaller JSW and higher grades of JSN at baseline,
and the results of our current analysis are in agreement with
these findings. Wluka and colleagues [43] reported the initial
cartilage volume (in MRI) to be the most significant determi-
nant of tibial cartilage loss (volume change with MRI), partici-
pants with high initial cartilage volume experiencing more
severe cartilage loss than those with smaller cartilage volumes
at baseline. Our current results are in direct disagreement with
these observations in that we find a greater cartilage loss in
participants with low initial cartilage thickness and with already
denuded subchondral bone at baseline.
To our knowledge, no previous study has identified a relation
between subchondral bone sclerosis at baseline and MRI-
based cartilage loss. Buckland-Wright [44] observed that the
subchondral cortical plate and adjacent trabeculae thicken in
OA, often prior to the onset of JSN. However, it was also
reported that sclerosis did not increase in knees until the
medial JSW was less than 1.5 mm. Bruyere and colleagues
[45] found tibial bone mineral density (BMD) as measured by
dual x-ray absorptiometry to independently predict medial JSN
over a one-year period in radiography, with patients in the low-
est BMD quartile experience less JSN than those in the high-
est quartile. These observations are supported by our current
MRI-based findings of increased cartilage loss in participants
with subchondral sclerosis.
The greatest sensitivity to change (SRM) in this study was
observed in subcohorts selected by baseline denuded area
and initial cartilage thickness in MRI (up to -0.64). From the
standpoint of recruiting patients for clinical trials, it must, how-
ever, be remembered that MRI is very costly and therefore can-
not realistically be used as a screening tool. Using
compartment-specific features of fixed flexion radiographs
(specifically JSN and subchondral sclerosis), however, the
SRM increased from -0.33 in the entire cohort to -0.47 for
those with JSN grade 2 or 3 or participants with subchondral
sclerosis. Such increases in SRM involve substantial savings
in either the cohort size or the study duration in clinical trials
and may thus justify the use of radiography as a screening tool
in disease-modifying OA drug efficacy studies. Although it is
currently unclear at which radiographic stage of radiographic
OA disease-modifying drugs will be most effective, the current
data can provide a reasonable basis for power calculations of
the number or participants (with specific radiographic fea-
tures) entered into a trial, if the effect of a disease-modifying
OA drug is to be demonstrated.
Conclusions
This study indicates that radiographic and MRI cartilage mor-
phometry features of advanced disease (JSN, subchondral
bone sclerosis, denuded bone areas, and low baseline carti-
lage thickness) appear to be associated with longitudinal car-
tilage loss in OA. Particularly radiography may be suited for
selecting patients with a higher likelihood of fast progression
in studies that try to demonstrate the cartilage preserving
effect of disease-modifying OA drugs.
Competing interests
FE is CEO of Chondrometrics GmbH, a company providing
MRI analysis services. In the past five years, he has provided
consulting services to Astra Zeneca, Chemedica, GlaxoSmith-
Kline, MerckSerono, Nordo Nordisk, Pfizer, Virtualscopics,
and Wyeth. SM, WW, and MH have part-time appointments
with Chondrometrics GmbH. BW and M-PHLG are employed
by Pfizer Inc The quantitative MRI analysis performed for this
study was funded by Pfizer Inc.
Authors' contributions
WW carried out the computation of the quantitative MRI end-
points. MH performed quality control of the MRI data and per-
formed the conversion to a proprietary format. SM performed
the quality control of all segmentations. WH and FE performed
the statistical analysis. DH was one of the readers performing
the radiographic readings. FE, BW, MN, MPH, and DH partic-
ipated in the concept and design of the study. All authors were
involved in writing the text and read and approved the final
manuscript.
Acknowledgements
We would like to thank John Lynch for help in working with the OA Initi-
ative images, the readers at Boston University: Drs Piran Aliabadi, David
Hunter, and David Felson for the radiographic gradings, and the readers
at Chondrometrics GmbH: Gudrun Goldmann, Linda Jakobi, Manuela
Kunz, Dr Susanne Maschek, Sabine Mühlsimer, Annette Thebis, and Dr
Barbara Wehr for dedicated data segmentation. The OA Initiative is a
public-private partnership comprised of five contracts (N01-AR-2-2258;
N01-AR-2-2259; N01-AR-2-2260; N01-AR-2-2261; N01-AR-2-2262)
funded by the National Institutes of Health, a branch of the Department
of Health and Human Services, and conducted by the OA Initiative
Study Investigators. Private funding partners include Merck Research
Laboratories; Novartis Pharmaceuticals Corporation, GlaxoSmithKline;
and Pfizer, Inc. Private sector funding for the OA Initiative is managed by
the Foundation for the National Institutes of Health. The quantitative MR
image analysis performed for this study was funded by Pfizer Inc. This
manuscript has received the approval of the OA Initiative Publications
Committee based on a review of its scientific content and data interpre-
tation. The analysis of the MR images used in this study were funded by
Pfizer Inc.
References
1. Kothari M, Guermazi A, von Ingersleben G, Miaux Y, Sieffert M,
Block JE, Stevens R, Peterfy CG: Fixed-flexion radiography of
the knee provides reproducible joint space width measure-
ments in osteoarthritis. Eur Radiol 2004, 14:1568-1573.
2. Peterfy C, Li J, Zaim S, Duryea J, Lynch J, Miaux Y, Yu W, Genant
HK: Comparison of fixed-flexion positioning with fluoroscopic
semi-flexed positioning for quantifying radiographic joint-
space width in the knee: test-retest reproducibility. Skeletal
Radiol 2003, 32:128-132.
Available online />Page 9 of 10
(page number not for citation purposes)
3. Botha-Scheepers S, Kloppenburg M, Kroon HM, Hellio Le Grav-
erand MP, Breedveld FC, Ravaud P, Dougados M: Fixed-flexion
knee radiography: the sensitivity to detect knee joint space
narrowing in osteoarthritis. Osteoarthritis Cartilage 2007,
15:350-353.
4. Charles HC, Kraus VB, Ainslie M, Hellio Le Graverand-Gastineau
MP: Optimization of the fixed-flexion knee radiograph. Oste-
oarthritis Cartilage 2007, 15:1221-1224.
5. Nevitt MC, Peterfy C, Guermazi A, Felson DT, Duryea J, Wood-
worth T, Chen H, Kwoh K, Harris TB: Longitudinal performance
evaluation and validation of fixed-flexion radiography of the
knee for detection of joint space loss. Arthritis Rheum 2007,
56:1512-1520.
6. Eckstein F, Hudelmaier M, Wirth W, Kiefer B, Jackson R, Yu J,
Eaton CB, Schneider E: Double echo steady state magnetic
resonance imaging of knee articular cartilage at 3 Tesla: a pilot
study for the Osteoarthritis Initiative. Ann Rheum Dis 2006,
65:433-441.
7. Eckstein F, Kunz M, Hudelmaier M, Jackson R, Yu J, Eaton CB,
Schneider E: Impact of coil design on the contrast-to-noise
ratio, precision, and consistency of quantitative cartilage mor-
phometry at 3 Tesla: a pilot study for the osteoarthritis initia-
tive. Magn Reson Med 2007, 57:448-454.
8. Eckstein F, Kunz M, Schutzer M, Hudelmaier M, Jackson RD, Yu J,
Eaton CB, Schneider E: Two year longitudinal change and test-
retest-precision of knee cartilage morphology in a pilot study
for the osteoarthritis initiative. Osteoarthritis Cartilage 2007,
15:1326-1332.
9. Eckstein F, Maschek S, Wirth W, Hudelmaier M, Hitzl W, Wyman
B, Nevitt M, Hellio Le Graverand MP: One year change of knee
cartilage morphology in the first release of participants from
the Osteoarthritis Initiative progression subcohort – associa-
tion with sex, body mass index, symptoms, and radiographic
OA status. Ann Rheum Dis 2009, 68:674-679.
10. Wirth W, Hellio Le Graverand MP, Wyman BT, Maschek S, Hudel-
maier M, Hitzl W, Nevitt M, Eckstein F: Regional analysis of fem-
orotibial cartilage loss in a subsample from the Osteoarthritis
Initiative progression subcohort. Osteoarthritis Cartilage 2009,
17:291-297.
11. Hunter DJ, Niu J, Zhang Y, Totterman S, Tamez J, Dabrowski C,
Davies R, Hellio Le Graverand MP, Luchi M, Tymofyeyev Y, Beals
CR: Change in cartilage morphometry: a sample of the pro-
gression cohort of the Osteoarthritis Initiative. Ann Rheum Dis
2009, 68:349-356.
12. OsteoArthritis Initiative [
]
13. Kellgren JH, Lawrence JS: Radiological assessment of osteo-
arthrosis. Ann Rheum Dis 1957, 16:494-502.
14. Brandt KD, Fife RS, Braunstein EM, Katz B: Radiographic grad-
ing of the severity of knee osteoarthritis: relation of the Kell-
gren and Lawrence grade to a grade based on joint space
narrowing, and correlation with arthroscopic evidence of artic-
ular cartilage degeneration. Arthritis Rheum 1991,
34:1381-1386.
15. Altman RD, Gold GE: Atlas of individual radiographic features
in osteoarthritis, revised. Osteoarthritis Cartilage 2007,
15(Suppl A):A1-56.
16. Altman RD, Hochberg M, Murphy WA Jr, Wolfe F, Lequesne M:
Atlas of individual radiographic features in osteoarthritis.
Osteoarthritis Cartilage 1995, 3(Suppl A):3-70.
17. Peterfy CG, Schneider E, Nevitt M: The osteoarthritis initiative:
report on the design rationale for the magnetic resonance
imaging protocol for the knee. Osteoarthritis Cartilage 2008,
16:1433-1441.
18. Eckstein F, Ateshian G, Burgkart R, Burstein D, Cicuttini F,
Dardzinski B, Gray M, Link TM, Majumdar S, Mosher T, Peterfy C,
Totterman S, Waterton J, Winalski CS, Felson D: Proposal for a
nomenclature for magnetic resonance imaging based meas-
ures of articular cartilage in osteoarthritis. Osteoarthritis Carti-
lage 2006, 14:974-983.
19. Wirth W, Eckstein F: A technique for regional analysis of femo-
rotibial cartilage thickness based on quantitative magnetic
resonance imaging. IEEE Trans Med Imaging 2008,
27:737-744.
20. Berthiaume MJ, Raynauld JP, Martel-Pelletier J, Labonte F, Beau-
doin G, Bloch DA, Choquette D, Haraoui B, Altman RD, Hochberg
M, Meyer JM, Cline GA, Pelletier JP: Meniscal tear and extrusion
are strongly associated with progression of symptomatic knee
osteoarthritis as assessed by quantitative magnetic reso-
nance imaging. Ann Rheum Dis 2005, 64:556-563.
21. Raynauld JP, Martel-Pelletier J, Berthiaume MJ, Beaudoin G, Cho-
quette D, Haraoui B, Tannenbaum H, Meyer JM, Beary JF, Cline
GA, Pelletier JP: Long term evaluation of disease progression
through the quantitative magnetic resonance imaging of
symptomatic knee osteoarthritis patients: correlation with
clinical symptoms and radiographic changes. Arthritis Res
Ther 2006, 8:R21.
22. Pelletier JP, Raynauld JP, Berthiaume MJ, Abram F, Choquette D,
Haraoui B, Beary JF, Cline GA, Meyer JM, Martel-Pelletier J:
Risk
factors associated with the loss of cartilage volume on weight-
bearing areas in knee osteoarthritis patients assessed by
quantitative magnetic resonance imaging: a longitudinal
study. Arthritis Res Ther 2007, 9:R74.
23. Raynauld JP, Martel-Pelletier J, Berthiaume MJ, Abram F, Cho-
quette D, Haraoui B, Beary JF, Cline GA, Meyer JM, Pelletier JP:
Correlation between bone lesion changes and cartilage vol-
ume loss in patients with osteoarthritis of the knee as
assessed by quantitative magnetic resonance imaging over a
24-month period. Ann Rheum Dis 2008, 67:683-688.
24. Ding C, Cicuttini F, Scott F, Boon C, Jones G: Association of
prevalent and incident knee cartilage defects with loss of tibial
and patellar cartilage: a longitudinal study. Arthritis Rheum
2005, 52:3918-3927.
25. Wluka AE, Ding C, Jones G, Cicuttini FM: The clinical correlates
of articular cartilage defects in symptomatic knee osteoarthri-
tis: a prospective study. Rheumatology (Oxford) 2005,
44:1311-1316.
26. Cicuttini F, Wluka A, Hankin J, Wang Y: Longitudinal study of the
relationship between knee angle and tibiofemoral cartilage
volume in subjects with knee osteoarthritis. Rheumatology
(Oxford) 2004, 43:321-324.
27. Eisenhart-Rothe R, Graichen H, Hudelmaier M, Vogl T, Sharma L,
Eckstein F: Femorotibial and patellar cartilage loss in patients
prior to total knee arthroplasty, heterogeneity, and correlation
with alignment of the knee. Ann Rheum Dis 2006, 65:69-73.
28. Sharma L, Eckstein F, Song J, Guermazi A, Prasad P, Kapoor D,
Cahue S, Marshall M, Hudelmaier M, Dunlop D: Relationship of
meniscal damage, meniscal extrusion, malalignment, and joint
laxity to subsequent cartilage loss in osteoarthritic knees.
Arthritis Rheum 2008, 58:1716-1726.
29. Eckstein F, Wirth W, Hudelmaier M, Stein V, Lengfelder V, Cahue
S, Marshall M, Prasad P, Sharma L: Patterns of femorotibial car-
tilage loss in knees with neutral, varus, and valgus alignment.
Arthritis Rheum 2008, 59:1563-1570.
30. Teichtahl AJ, Davies-Tuck ML, Wluka AE, Jones G, Cicuttini FM:
Change in knee angle influences the rate of medial tibial car-
tilage volume loss in knee osteoarthritis. Osteoarthritis Carti-
lage 2009, 17:8-11.
31. Urquhart DM, Soufan C, Teichtahl AJ, Wluka AE, Hanna F, Cicut-
tini FM:
Factors that may mediate the relationship between
physical activity and the risk for developing knee osteoarthri-
tis. Arthritis Res Ther 2008, 10:203.
32. Hill CL, Hunter DJ, Niu J, Clancy M, Guermazi A, Genant H, Gale
D, Grainger A, Conaghan P, Felson DT: Synovitis detected on
magnetic resonance imaging and its relation to pain and carti-
lage loss in knee osteoarthritis. Ann Rheum Dis 2007,
66:1599-1603.
33. Hanna F, Ebeling PR, Wang Y, O'Sullivan R, Davis S, Wluka AE,
Cicuttini FM: Factors influencing longitudinal change in knee
cartilage volume measured from magnetic resonance imaging
in healthy men. Ann Rheum Dis 2005, 64:1038-1042.
34. Hanna FS, Bell RJ, Cicuttini FM, Davison SL, Wluka AE, Davis SR:
The relationship between endogenous testosterone, prean-
drogens, and sex hormone binding globulin and knee joint
structure in women at midlife. Semin Arthritis Rheum 2007,
37:56-62.
35. Hunter DJ, LaValley M, Li J, Zhang Y, Bauer D, Nevitt M, Guermazi
A, DeGroot J, Sakkee N, Gale D, Felson DT: Urinary pentosidine
does not predict cartilage loss among subjects with sympto-
matic knee OA: the BOKS Study. Osteoarthritis Cartilage 2007,
15:93-97.
36. Wluka AE, Forbes A, Wang Y, Hanna F, Jones G, Cicuttini FM:
Knee cartilage loss in symptomatic knee osteoarthritis over
4.5 years. Arthritis Res Ther 2006, 8:R90.
Arthritis Research & Therapy Vol 11 No 3 Eckstein et al.
Page 10 of 10
(page number not for citation purposes)
37. Cicuttini FM, Jones G, Forbes A, Wluka AE: Rate of cartilage loss
at two years predicts subsequent total knee arthroplasty: a
prospective study. Ann Rheum Dis 2004, 63:1124-1127.
38. Felson DT, Gale DR, Elon GM, Niu J, Hunter DJ, Goggins J, LaVal-
ley MP: Osteophytes and progression of knee osteoarthritis.
Rheumatology (Oxford) 2005, 44:100-4.
39. Wolfe F, Lane NE: The longterm outcome of osteoarthritis:
rates and predictors of joint space narrowing in symptomatic
patients with knee osteoarthritis. J Rheumatol 2002,
29:139-146.
40. Mazzuca SA, Brandt KD, Katz BP, Ding Y, Lane KA, Buckwalter
KA: Risk factors for progression of tibiofemoral osteoarthritis:
an analysis based on fluoroscopically standardised knee radi-
ography. Ann Rheum Dis 2006, 65:515-519.
41. Le Graverand MP, Vignon EP, Brandt KD, Mazzuca SA, Piperno M,
Buck R, Charles HC, Hunter DJ, Jackson CG, Kraus VB, Link TM,
Schnitzer TJ, Vaz A, Wyman B: Head-to-head comparison of the
Lyon Schuss and fixed flexion radiographic techniques. Long-
term reproducibility in normal knees and sensitivity to change
in osteoarthritic knees. Ann Rheum Dis 2008, 67:1562-1566.
42. Bruyere O, Honore A, Ethgen O, Rovati LC, Giacovelli G, Henrotin
YE, Seidel L, Reginster JY: Correlation between radiographic
severity of knee osteoarthritis and future disease progression.
Results from a 3-year prospective, placebo-controlled study
evaluating the effect of glucosamine sulfate. Osteoarthritis
Cartilage 2003, 11:1-5.
43. Wluka AE, Stuckey S, Snaddon J, Cicuttini FM: The determinants
of change in tibial cartilage volume in osteoarthritic knees.
Arthritis Rheum 2002, 46:2065-2072.
44. Buckland-Wright C: Subchondral bone changes in hand and
knee osteoarthritis detected by radiography. Osteoarthritis
Cartilage 2004, 12(Suppl A):S10-19.
45. Bruyere O, Dardenne C, Lejeune E, Zegels B, Pahaut A, Richy F,
Seidel L, Ethgen O, Henrotin Y, Reginster JY: Subchondral tibial
bone mineral density predicts future joint space narrowing at
the medial femoro-tibial compartment in patients with knee
osteoarthritis. Bone 2003, 32:541-545.