Báo cáo y học: " The utility of MRI in predicting radiographic erosions in the metatarsophalangeal joints of the rheumatoid foot: a prospective longitudinal cohort study" pdf
Bạn đang xem bản rút gọn của tài liệu. Xem và tải ngay bản đầy đủ của tài liệu tại đây (458 KB, 10 trang )
Open Access
Available online />Page 1 of 10
(page number not for citation purposes)
Vol 11 No 3
Research article
The utility of MRI in predicting radiographic erosions in the
metatarsophalangeal joints of the rheumatoid foot: a prospective
longitudinal cohort study
Matthew L Mundwiler
1
, Paul Maranian
2
, Douglas H Brown
3
, Jeffrey M Silverman
3
, Daniel Wallace
4
,
Dinesh Khanna
2
, James Louie
2
, Daniel E Furst
2
and Michael H Weisman
4
1
North Suburban Rheumatologists, 9301 W. Golf Road, #205, Des Plaines, IL 60016, USA
2
David Geffen School of Medicine at the University of California in Los Angeles, 1000 Veteran Avenue, Los Angeles, CA 90095, USA
3
Landmark Imaging Medical Group, Inc., 11620 Wilshire Boulevard, #100, Los Angeles, CA 90025, USA
4
Cedars-Sinai Medical Center, 8700 Beverly Boulevard, Los Angeles, CA 90048, USA
Corresponding author: Michael H Weisman,
Received: 23 Nov 2008 Revisions requested: 24 Feb 2009 Revisions received: 5 May 2009 Accepted: 22 Jun 2009 Published: 22 Jun 2009
Arthritis Research & Therapy 2009, 11:R94 (doi:10.1186/ar2737)
This article is online at: />© 2009 Mundwiler et al.; licensee BioMed Central Ltd.
This is an open access article distributed under the terms of the Creative Commons Attribution License ( />),
which permits unrestricted use, distribution, and reproduction in any medium, provided the original work is properly cited.
Abstract
Introduction Magnetic resonance imaging (MRI) may reveal
rheumatoid arthritis (RA) changes in the feet when hands are
normal. The purpose of this study was to determine the
sensitivity, specificity, positive predictive value (PPV), and
negative predictive value (NPV) of a metatarsophalangeal (MTP)
erosion on MRI to predict a subsequent radiographic erosion in
the same joint. Similar analyses were performed for bone
marrow edema, predicting a subsequent MRI erosion.
Descriptive results of other lesions are reported.
Methods Fifty patients with RA of less than 5 years' duration
who were rheumatoid factor-positive and/or anti-cyclic
citrullinated peptide-positive were recruited. Patients on anti-
tumor necrosis factor (TNF) therapy were excluded. Anti-TNF
therapy could begin after enrollment. MRI and radiographs of the
3rd, 4th, and 5th MTP joints bilaterally were taken at baseline
and at 6, 12, and 24 months. Clinical data were collected.
Results Fifty patients were recruited; 46 patients had suitable
data. Results for MRI erosions predicting subsequent
radiographic erosions for 6, 12, and 24 months, respectively,
were as follows: sensitivity 0.75, 0.60, 0.75; specificity 0.93,
0.94, 0.94; PPV 0.086, 0.10, 0.17; NPV 0.998, 0.995, 0.995.
Results for MRI bone marrow edema predicting MRI erosions at
6 and 12 months, respectively, revealed sensitivity 0.50, 0.67;
specificity 0.97, 0.97; PPV 0.25, 0.50; NPV 0.99, 0.99.
Synovitis was the most common finding and, when present in
isolation, resolved on 67.3% of subsequent studies. MRI
erosions persisted on subsequent studies with one exception.
Forty-six percent of the cohort was on anti-TNF therapy after
study inception.
Conclusions The PPV of MRI erosions to predict subsequent
radiographic erosions was low. Similarly, the PPV of bone
marrow edema to predict a later MRI erosion was low.
Alternatively, the NPV of the absence of an MRI erosion or bone
marrow edema predicts that a later radiographic erosion or MRI
erosion will likely not develop. Anti-TNF therapies may have
resulted in the lower-than-anticipated PPVs. MRI descriptions of
bone edema may represent a more critical time to treat in order
to avoid damage, whereas an MRI erosion represents more
permanent damage. This study suggests that imaging modalities
more sensitive than radiographs are necessary to monitor
disease in the biologic era.
Introduction
It is becoming axiomatic that diagnosing and treating rheuma-
toid arthritis (RA) before radiographic damage and functional
disability occur are desirable [1]. Therefore, it would be bene-
ficial to employ non-invasive tests to reliably predict if and
when this radiographic damage might take place. Magnetic
anti-CCP: anti-cyclic citrullinated peptide; BME: bone marrow edema; CI: confidence interval; CRP: C-reactive protein; DAS28: disease activity score
using 28 joint counts; ESR: erythrocyte sedimentation rate; FOV: field of view; HAQ: health assessment questionnaire; HAQ-DI: health assessment
questionnaire disability index; MRI: magnetic resonance imaging; MTP: metatarsophalangeal; NPV: negative predictive value; OR: odds ratio; PPV:
positive predictive value; RA: rheumatoid arthritis; RAMRIS: rheumatoid arthritis magnetic resonance imaging score; RASS: rheumatoid arthritis sever-
ity scale; RF: rheumatoid factor; TE: echo time; TNF: tumor necrosis factor; TR: repetition time.
Arthritis Research & Therapy Vol 11 No 3 Mundwiler et al.
Page 2 of 10
(page number not for citation purposes)
resonance imaging (MRI) may fulfill this need. An earlier study
by Forslind and colleagues [2] revealed that MRI images from
RA patients demonstrate several positive findings even when
conventional radiographs are normal. Other investigations
demonstrated that erosions on radiographs were evident on
MRI a median of 2 years earlier [3] and that MRI could be a
superior tool for tracking progression of RA in patients [4].
Brown and colleagues [5] recently showed that evidence of
inflammatory activity on MRI persists despite the appearance
of clinical remission. To date, most of the MRI-related research
has focused on the hand and wrist; however, Boutry and col-
leagues [6] demonstrated that MRI findings in the feet were as
prevalent as hand findings in early-RA patients. Another study
showed that early-RA patients may have MRI findings in the
feet when the hand studies are normal [7].
As a result of the above considerations, we chose to concen-
trate on the feet of RA patients for our observations. The pri-
mary objective of this research was to determine the
sensitivity, specificity, and predictive values of MRI erosions in
metatarsophalangeal (MTP) joints to predict new radiographic
erosions in the same joint after 6, 12, and 24 months.
Materials and methods
Patient selection and recruitment
This study has a prospective longitudinal cohort design. Fifty
RA patients with less than 5 years of disease duration were
recruited from three centers in the Los Angeles area to
undergo repeat imaging studies. The study protocol was
approved by the institutional review boards of all study centers
(Cedars-Sinai Medical Center, University of California at Los
Angeles, and Harbor-University of California at Los Angeles).
Written informed consent was obtained from all patients prior
to their entrance into the study. The patients met the 1987
American College of Rheumatology classification criteria for
RA, were either rheumatoid factor (RF)-positive or anti-cyclic
citrullinated peptide (anti-CCP)-positive, and were at least 18
years old. Patients were excluded if they had been treated with
an anti-tumor necrosis factor (anti-TNF) biologic prior to the
start of the study, had a positive pregnancy test, or had any
contraindications to MRI. Patients who met study criteria were
followed for 2 years. To maximize the probability to detect new
radiographic erosions attributable to RA and their preceding
MRI findings, we chose to examine the 3rd, 4th, and 5th MTP
joints. This decision was based upon previous work that indi-
cated that the earliest radiographic erosions in RA would
occur in these areas [8,9].
At the initial visit, bilateral foot radiographs and MRI of the 3rd,
4th, and 5th bilateral MTP joints were obtained. In addition,
subject pain assessment, health assessment questionnaire
disability index (HAQ-DI), RA severity scale (RASS), swollen
and tender joint count, C-reactive protein (CRP), erythrocyte
sedimentation rate (ESR), RF, anti-CCP, complete blood cell
count, aspartate aminotransferase, alanine transaminase, alka-
line phosphatase, and a urine pregnancy test were recorded.
At the 6-month visit, MRI and radiographs of the forefeet were
again taken as well as a pain assessment, RASS, swollen and
tender joint count, and a urine pregnancy test. At the 1-year
visit, MRI and radiographs of the bilateral forefeet were taken.
At the 24-month visit, bilateral radiographs of the forefeet, sub-
ject pain assessment, HAQ-DI, RASS, and swollen and tender
joint count were obtained. At all visits, a list of patient medica-
tions was recorded. Therapy for the patient's RA was at the
discretion of the patient's physician. MRI results were not pro-
vided to the caregiver and did not influence management deci-
sions.
Protocol for magnetic resonance imaging of the bilateral
forefeet
Images were obtained with a 1.5-Tesla whole-body MRI scan-
ner (Signa Horizon, LX; General Electric Medical Systems, Mil-
waukee, WI, USA) with and without gadolinium contrast
enhancement (0.1 mmol/kg of gadopentetate dimeglumine;
Magnevist; Berlex, now part of Bayer HealthCare Pharmaceu-
ticals, Montville, NJ, USA) and an optimal field of view (FOV)
for the 3rd, 4th, and 5th MTP joints to be taken together. Each
MRI involved three sequences using a dual-TMJ coil (General
Electric Medical Systems) with an internal diameter of 3
inches. First, a multi-slice, coronal T1-weighted spin-echo
sequence (300/14 repetition time/echo time [TR/TE], slice
thickness of 4 mm) was completed. Next, a multi-slice, axial
fast inversion sequence (3,000/34 TR/TE, 130 inversion time,
slice thickness of 3 mm) was obtained. Finally, pre- and post-
contrast (Magnevist) multi-slice, axial fat-suppressed spoiled
gradient echo-recalled sequences (150/2.8 TR/TE, flip angle
70 degrees) were completed. Additional imaging parameters
were an FOV of 10 × 10 cm, matrix of 256 × 192, and two
acquisitions.
Protocol for radiographs of the bilateral forefeet
Radiographs (anterior-posterior, internal-oblique, and lateral
films of the feet) were performed with a computed radiography
system (Fuji System; Fujifilm Corporation, Tokyo, Japan). Aver-
age settings were 55 to 60 kV, 200 to 250 mA, and 2.5 mA.
Adjustments were made depending on body habitus.
Protocol for scoring of the forefeet magnetic resonance
imaging
Joints scored were the bilateral 3rd, 4th, and 5th MTP joints of
the feet. Findings in other structures were not documented.
Scoring was based on version 3 of the fully validated RA MRI
score (RAMRIS) reviewed at the OMERACT (outcome meas-
ures in RA clinical trials) 6 proceedings [10]. The same princi-
ples applied to scoring the hand films in those proceedings
were applied to the readings of the MTPs for this study. Ero-
sions were defined as bony defects with sharp margins, visible
in axial and coronal views with at least one view showing a cor-
tical break. The area of interest was the first 1 cm of subartic-
ular bone at both the metatarsal and phalangeal bases of the
Available online />Page 3 of 10
(page number not for citation purposes)
individual MTP being scored. The actual score was based on
the percentage of this area being eroded. If there was no ero-
sion, the score was 0. If 1% to 10% of the area was eroded,
the score was 1; 11% to 20% resulted in a score of 2; and
21% to 30% resulted in a score of 3; and so on up to a maxi-
mum score of 10. Each joint had a possible score of 20 since
the maximum score of each base was 10.
A defect was considered the loss of trabecular bone without a
visible cortical break; the same scoring principles used for ero-
sions applied to defects. Bone marrow edema (BME) was
defined as a high-intensity focus with ill-defined margins seen
on T2-weighted sequences. Again, the area of interest was the
first 1 cm of subarticular bone of the metatarsal and phalan-
geal bases. BME was also scored based on the percentage of
involvement of this area in the same manner as erosions. If
there was an erosion or defect present, BME scoring was
based on the percentage of involvement of the remaining
bone.
Synovitis was defined as synovial enhancement that appeared
thicker than the width of the joint capsule after the administra-
tion of gadolinium. Possible scores were 0 to 3 for the joint,
with 0 being no synovitis, 1 being mild synovitis, 2 being mod-
erate synovitis, and 3 being severe synovitis. Because the new
appearance of an erosion was the primary outcome of interest,
only the scores were recorded. The dimensions of the lesions
were not considered during this analysis.
Protocol for scoring of the forefeet radiographs
Scoring was based on the Sharp/van der Heijde method [11],
with the 3rd, 4th, and 5th bilateral MTPs being the joints of
interest. Erosions were defined as a discrete area of bone loss.
A score of 0 signified no erosion, 1 signified discrete erosion,
2 signified a larger erosion, and 3 signified an erosion covering
more than 50% of the joint surface. The maximum score for
each bone surface was 5, and the maximum score for one joint
was 10. Joint space narrowing was scored as follows: 0 was
no narrowing, 1 was focal, 2 was generalized with at least
50% of the joint space left, 3 was generalized with less than
50% of the joint space left, and 4 was ankylosis or complete
subluxation. The maximum score for one joint was 4. Because
the new appearance of an erosion was considered the primary
outcome of interest, only the score was recorded. The dimen-
sions of the lesions were not considered during analysis.
Protocol for reading of all images
Each study was read by two musculoskeletal radiologists with-
out knowledge of any clinical data; the studies were read in
unison, and consensus was required. MRI images were read
independently and without knowledge of radiographs, and
each limb was read independently. Readers were blinded to
the identity of the patient. MRI images and radiographs were
read after the imaging studies were completed for each time
period. Readings were performed at a dedicated reading
workstation (General Electric Medical Systems).
Magnetic resonance imaging erosions predicting
subsequent radiographic erosions
The primary objective of this study was to determine the sen-
sitivity, specificity, positive predictive value (PPV), and nega-
tive predictive value (NPV) of an MRI erosion to predict a new
radiographic erosion in the same joint at a subsequent time
point. The design of this study permitted the calculation of
these parameters at 6, 12, and 24 months between the detec-
tion of the MRI erosion and the subsequent appearance of a
new radiographic erosion.
It should be noted when determining the sensitivity, specificity,
PPV, and NPV at 6 and 12 months that, if patients completed
all studies, one joint could contribute two data points to each
individual calculation. For example, the progression of a single
MTP could be followed from the baseline MRI to the 6-month
radiograph and from the 6-month MRI to the 12-month radio-
graph. This strategy was considered appropriate for two rea-
sons. First, the age of any MRI erosion observed at baseline
was unknown. MRI erosions at baseline were considered
equivalent whether or not they were new or had been present
for some time. Second, this strategy enabled us to include
new MRI erosions occurring during the study after baseline.
Bone marrow edema predicting magnetic resonance
erosions
The sensitivity, specificity, PPV, and NPV of bone edema pre-
dicting a new MRI erosion in the same joint 6 and 12 months
later were calculated in the same manner as outlined above. If
an MRI erosion was already present when the BME was first
noted, the joint was not included in the analysis.
Descriptive data
The following calculations were made for each MRI finding
(synovitis, BME, bone defects, and bone erosions): (a) The
percentage of the patients completing more than one study (n
= 46) having each MRI finding at least once. (b) The percent-
age of the 276 joints studied (46 patients × 6 joints) having
each finding at least once. (c) The number of times a finding
was observed if each joint on each MRI is considered sepa-
rately. For example, consider one patient having three joints
imaged twice. If two joints had BME on the first image and one
joint had BME on the second image, then BME would have
been observed three times. (d) The frequency of other findings
when the finding of interest is present. Again, consider one
patient having three joints being imaged twice. If one joint had
an erosion on the first study and two joints had an erosion on
the second, then erosions would have been observed three
times. If synovitis was seen with the first joint on the first study
but was not seen with the two erosions on the second study,
synovitis would have been observed with erosions 33% of the
time. (e) The fate of each finding on subsequent MRIs.
Arthritis Research & Therapy Vol 11 No 3 Mundwiler et al.
Page 4 of 10
(page number not for citation purposes)
Because each patient completed different studies at different
time intervals and the initial appearance of each finding varied
widely, time intervals were not considered as part of the anal-
ysis. A persistent finding, however, had to be present for at
least 6 months as that was the minimal interval between MRI
studies.
Statistical methods
Comparison of baseline differences between subjects
Baseline differences between the five groups are summarized
in Table 1 with respect to clinical measures such as ESR,
CRP, disease activity score using 28 joint counts (DAS28),
HAQ, swollen and tender joint counts, physician global
assessment, and disease duration. Data analyses were
explored using a combination of global tests (analysis of vari-
ance and Kruskal-Wallis, as appropriate) and pairwise com-
parisons controlling the experiment-wise error rate (Tukey's
honestly significant differences test).
Calculation of sensitivity, specificity, positive predictive
value, and negative predictive value
For the purposes of the present study, a study can be repre-
sented as an ordered pair ('a, b'), where 'a' takes on the value
1 or 0 based on whether or not for a given joint an erosion
appears on MRI at time 1, and 'b' takes on the value 1 or 0
based on whether or not an erosion appears on radiograph at
time 2. When the time interval of interest is 6 months, this
gives rise to a possible total of 12 studies per subject, there
being 6 joints per subject and two 6-month intervals repre-
sented in the data: baseline (time 1) to 6 months (time 2), and
6 months (time 1) to 12 months (time 2). When the time inter-
val of interest is 12 months, the number of studies per subject
is also 12 (indicating two 12-month intervals), while for the 24-
month interval, the number of studies per subject is 6 (only one
24-month interval is possible). Based on the total number of
studies, 2 × 2 classification tables were generated for each
time interval of interest (6 months, 12 months, and 24 months)
and used to determine the sensitivity, specificity, PPV, NPV,
and odds ratio (OR) for the presence of radiographic erosions
relative to the prior appearance of erosions on MRI. The same
method was used to generate tables for examining the rela-
tionship between BME and their predictive value for MRI ero-
sions. Computations were achieved by using the statistical
software packages SAS System Release 9.1.3 (SAS Institute
Inc., Cary, NC, USA) and Stata/SE 9.2 (StataCorp LP, Col-
lege Station, TX, USA).
Table 1
Magnetic resonance imaging (MRI) erosions predicting subsequent radiographic erosions and MRI bone marrow edema predicting
subsequent MRI erosions
MRI erosions predicting subsequent radiographic erosions
Time interval
between
studies
Patients New x-ray
erosions
preceded by
MRI erosion
MRI erosions
NOT leading to
x-ray erosion
New x-ray
erosion NOT
preceded by
MRI erosion
Studies not
having an
x-ray or MRI
erosion
Sensitivity Specificity PPV NPV Odds ratio
(CI)
6 months 43 3 32 1 430 0.75 0.93 0.086 0.998
a
40.3
(4.08–398.7)
12 months 39 3 27 2 417 0.6 0.94 0.10 0.995
a
32.2
(3.7–144.6)
24 months 41 3 15 1 218 0.75 0.94 0.17 0.995
a
43.6
(4.27–445)
MRI bone marrow edema predicting subsequent MRI erosions
Time interval
between
studies
Patients New MRI
erosions
preceded by
BME
BME NOT
leading to MRI
erosion
New MRI
erosion NOT
preceded by
BME
Studies not
having an MRI
erosion or BME
Sensitivity Specificity PPV NPV Odds ratio
(CI)
6 months 43 4 12 4 410 0.50 0.97 0.25 0.99
a
34.17
(7.62–153.1)
12 months 39 6 6 3 204 0.67 0.97 0.50 0.99
a
68.0
(13.6–338.9)
The data for the major endpoints of the study are summarized here. The number of patients at each time interval varies because not all patients
completed all studies. All radiographic erosions not preceded by an MRI erosion were preceded by MRI defects. There were only five new
radiographic erosions for the entire cohort.
a
Statistically significant. BME, bone marrow edema; CI, confidence interval; NPV, negative predictive
value; PPV, positive predictive value.
Available online />Page 5 of 10
(page number not for citation purposes)
Results
Patients
Fifty patients were recruited; 46 patients completed at least
one study beyond baseline and 34 patients completed all the
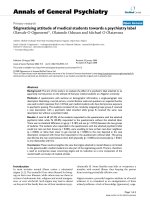
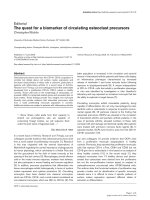
protocol-scheduled studies. Figure 1 indicates which studies
were or were not completed by the cohort. Of the 46 patients
who completed at least one study, 36 were female, 21 were
placed on an anti-TNF agent during the study, 17 were on
methotrexate or leflunomide without a biologic, 37 were RF-
positive, and 31 were anti-CCP-positive; the average disease
duration was 1.34 years. The following subgroups were com-
pared within the cohort: patients with no MRI or radiographic
findings, patients with synovitis on MRI only, patients with
edema or defect or erosion on MRI, patients with erosions on
MRI, and patients with radiographic findings. Although there
was no pre-specified stratification, there were no differences
between groups in regard to disease duration, biologic use,
methotrexate use, or the following parameters at baseline:
ESR, CRP, DAS28, HAQ, swollen joint count, tender joint
count, and physician global assessment.
Magnetic resonance imaging erosions predicting
radiographic erosions
The data for MRI erosions predicting subsequent radiographic
erosions are summarized in Table 1. For all time intervals stud-
ied, the PPV of an MRI erosion for a later radiographic erosion
was low (6-month = 0.086, 12-month = 0.10, 24-month =
0.17). On the other hand, the high NPV indicates that the
absence of an MRI erosion almost guarantees that a radio-
graphic erosion will not form over the time intervals studied (6-
month = 0.93, 12-month = 0.94, 24-month = 0.94). Having an
MRI erosion, however, dramatically increases the chance of
the formation of a radiographic erosion as indicated by the
ORs (6-month = 40.3, 12-month = 32.2, 24-month = 43.6).
We caution, however, that confidence intervals (CIs) were
constructed without taking into account the hierarchical nature
of the data and therefore are likely to underestimate the stand-
ard error of the OR estimates. The number of new radio-
graphic erosions was much lower than we anticipated,
perhaps because many patients used anti-TNF agents.
Despite the increased sensitivity of MRI to pick up bone
lesions, we were surprised to find that the sensitivity of MRI for
detecting radiographic erosions at a later time was 0.60 to
0.75 in our study. When this issue was explored, the radio-
graphic lesions not preceded by an erosion were preceded by
a bone defect, a bony lesion without a cortical break. If defects
were taken into account, the sensitivity of this combined find-
ing on MRI would be 1.00.
Bone marrow edema predicting magnetic resonance
erosion formation
Table 1 also summarizes the results for BME predicting MRI
erosions. BME has a low PPV for predicting an MRI erosion (6-
month = 0.25, 12-month = 0.50), but its absence makes the
formation of an MRI erosion over the course of 1 year highly
unlikely as indicated by the high NPV (6- and 12-month =
0.99). Having BME, however, dramatically increases the
chance of an MRI erosion to form as indicated by the ORs (6-
month = 34.17, 12-month = 68.0). As is the case for MRI ero-
sions, the large CIs indicate that caution is required when
using BME as a predictor in an individual patient.
Descriptive data
Table 2 summarizes the frequency of BME, bone defect, bone
erosion, and synovitis on MRI by the absolute number of times
each was observed, by patient, and by joint. Also reported is
the percentage of time the other findings are present when the
Figure 1
Studies completed by cohortStudies completed by cohort. All 50 patients underwent the initial magnetic resonance imaging (MRI) and radiograph. Patients who completed only
two MRI/radiograph studies underwent the initial studies and either the 6-month or 12-month study.
Arthritis Research & Therapy Vol 11 No 3 Mundwiler et al.
Page 6 of 10
(page number not for citation purposes)
finding of interest is taken into account. Synovitis was the most
common finding in the study and was often accompanied by
the other findings. BME was accompanied by synovitis in all
but one instance. Next, we analyzed the resolution and persist-
ence of each lesion. The lesion of interest had to be present
and a subsequent MRI of that joint had to be completed for
this analysis. Among 24 MTPs with appropriate data, 70.8%
of BME resolved and 28.2% persisted on the subsequent
studies. We then assessed bone defects and bone erosions
on MRI. Because the actual dimensions of each lesion were
unknown, we could analyze only those lesions that occurred
without the other being present. For example, we could ana-
lyze an erosion only if there was no defect. Bone defects were
an isolated finding 28.8% of the time. Among 16 MTPs with
appropriate data, 31.1% of these defects persisted without
change on subsequent studies, 37.5% completely resolved
on the subsequent studies, and 31.1% were followed by the
development of bone erosions on subsequent studies. Bone
erosions were an isolated finding 17.1% of the time. Twenty-
eight MTPs had a bone erosion and a subsequent MRI; 96%
of these erosions persisted on subsequent studies, and only
one small erosion resolved on a subsequent MRI.
Synovitis was usually present with other lesions but was an
isolated finding 29.9% of the time. Synovitis was detected as
an isolated finding in 52 MTP joints that had subsequent stud-
ies. On subsequent studies, 67.3% of the isolated synovitis
resolved without the appearance of other lesions and 26.9%
persisted without other lesions appearing. Five point eight per-
cent of MTPs with synovitis as an initial isolated finding devel-
oped bony (defect or erosion) lesions. The synovitis persisted
in two instances and resolved in one instance when these
bony lesions appeared.
Therapeutic effects
Because there were few new radiographic types of erosion,
we proceeded to determine whether therapies had an effect.
We could not accurately relate the timing of therapies (started
in an uncontrolled or unrecorded fashion) to the occurrence of
radiographic erosions. No distinct pattern relating new radio-
graphic erosions to therapy received during the study
emerged (data not shown). We also attempted to determine
whether therapies had an impact on MRI findings and chose
to base this analysis on bone erosions because these lesions
are persistent on subsequent studies. The reversibility of the
other lesions did not allow meaningful analysis since we could
not relate the timing of therapies to the timing of the MRI stud-
ies. When we compared the initial and final RAMRIS erosion
scores of patients on different therapies, we found that the
majority of patients with worsening erosion scores were on
anti-TNF therapy, whereas the patients on methotrexate or
leflunomide usually had stable or improving scores. This
numerical difference may reflect selection bias, as patients
with more active disease (and more likely to show active dis-
ease on MRI) were probably placed on anti-TNF agents (data
not shown).
Discussion
The major finding in this study was that detection of an erosion
in the MTP joints of an RA patient by MRI does not have a high
predictive value for subsequent formation of a radiographic
erosion in the same joint over a 2-year time period. Despite our
focus on the joints that are believed to be most likely to erode
in an RA patient [12], the number of new radiographic ero-
sions was low in the face of numerous MRI erosions in our
study (87 total MRI erosions as compared with 5 new radio-
graphic erosions). The low number of radiographic findings
was surprising given the risk of erosive disease expected in a
population selected for RF and/or anti-CCP positivity.
Three well-done similar studies of the rheumatoid wrist (sum-
marized in Table 3) reported more rapidly developing erosive
lesions. Comparing these studies to ours might provide insight
into these differences. Wrist images include approximately 18
Table 2
Summary of secondary endpoints: descriptive statistics
Bone marrow edema Defects Erosions Synovitis
Patients with this finding at least once during the study, number (percentage) 16 (34.8%) 13 (28.3%) 16 (34.8%) 44 (73.9%)
Joints with this finding at least once during the study, number (percentage) 28 (10.1%) 24 (8.7%) 30 (10.9%) 102 (37%)
Number of times the finding was observed 45 45 70 174
Percentage of time the finding was observed with bone marrow edema - 26.7% 35.7% 21.8%
Percentage of time the finding was observed with defects 26.7% - 20% 14.4%
Percentage of time the finding was observed with erosions 60% 31.1% - 33.9%
Percentage of time the finding was observed with synovitis 91.1% 64.4% 74.1% -
The 46 patients who completed more than one study are considered here. Two hundred seventy-six joints were imaged by magnetic resonance
imaging (MRI) at least twice. A single joint was considered to have the finding if it appeared once in that joint during any of the MRI studies. The
total number of times each characteristic was found was also counted, as was the percentage of the time each finding occurred with another. For
examples of how these data were calculated, please refer to items (c) and (d) of the Descriptive data section of Materials and methods.
Available online />Page 7 of 10
(page number not for citation purposes)
potential articulations per patient and a larger potential surface
area for erosion when compared with 6 MTP joints per patient.
Also, two of these studies followed patients for longer periods
of time, increasing the chances of seeing a subsequent radio-
graphic erosion. Furthermore, there may be pathologic differ-
ences between the wrist joints and MTPs. Despite
radiographic studies indicating that MTP erosions occur ear-
lier in the disease course [8,9] and MRI studies indicating that
MTP erosions are present on MRI when not present in the
hand [7], few studies examine how fast MRI erosions progress
to radiographic erosions in the MTPs. More evaluations that
have a design similar to ours would be necessary to draw
accurate conclusions. Histologic studies that include compar-
isons with wrist studies would be necessary to determine
pathologic reasons.
The radiologists' knowledge of the timing of the imaging stud-
ies being read could account for the large number or MRI ero-
sions read in comparison with the number of radiographic
erosions. Although our radiologists were blinded to the identity
of the subjects and did not compare the image being read with
other images from the same subject, they were aware at what
time point in the study the image was taken. It is usually
expected for patients with a longer disease duration to accu-
mulate more damage. It is possible that the radiologists were
more likely to be sensitive to small lesions, especially when
reading images taken later in the study. Future investigations
should be designed to specifically address this issue.
The disease durations of our subjects may also have contrib-
uted to the low number of new erosions seen. Approximately
half of our cohort had a disease duration of less than 1 year at
the start of the study, and a small percentage had a disease
duration of up to 5 years. A study by McQueen and colleagues
[13] demonstrated that the highest rates of erosive activity
may occur within the first year of disease. Although there were
only five new radiographic erosions in our study, six radio-
graphic erosions were already present in our cohort at base-
line. Limiting the cohort to patients with less than 1 year of
disease may have increased our PPV of an MRI erosion pre-
dicting a subsequent radiographic erosion.
The use of anti-TNF agents also likely contributed to the low
number of new radiographic erosions. Forty-six percent of our
patients were on anti-TNF agents at some time during the
study. It is now accepted that the anti-TNF agents are highly
effective in suppressing radiographic damage even in the
presence of some continued disease activity [14,15]. Further-
more, the use of anti-TNF inhibitors in the first 2 years of dis-
ease halts radiographic progression even more effectively
[15]. When we evaluated the MRI findings in our study, we
found that the patients with more severe erosive disease on
MRI were being treated with anti-TNF therapies. Our study
was not designed to directly assess the impact of treatments
on the imaging outcomes, and the treatment data may reflect
the selection bias that the most severe patients were placed
on anti-TNF therapy during the study. To accurately assess the
effects of anti-TNF agents on MRI outcomes, a study control-
ling for such therapy would need to be performed.
Despite the low number of new radiographic erosions, 10% of
the joints imaged had MRI erosions. Furthermore, these ero-
sions persisted on the subsequent MRI 96% of the time. Thus,
the presence of an MRI erosion likely indicates more perma-
nent damage and more severe disease. Ultimately, our data
may indicate that imaging modalities more sensitive than radi-
ographs are needed since regular use of biologics will sup-
press radiographic changes. MRI erosions, however, are
readily visible even when a large percentage of the cohort are
exposed to TNF inhibition.
BME is being accepted as an important lesion on MRI in RA
because studies have indicated that it may predict future joint
damage. McQueen and colleagues [16] elegantly showed that
total BME score of the wrist predicted erosive progression on
radiographs 6 years later. Haavardsholm and colleagues [17]
and Hetland and colleagues [18] reproduced these findings at
1 and 2 years, respectively.
Table 3
Summary of similar studies
Study Results summary
Østergaard et al. [3] (wrist) Most radiographic erosions were evident 2 years prior on MRI.
a
The PPV of MRI erosion predicting radiograpic erosion over the course of 5 years was estimated to be 52%.
The relative risk of developing radiographic erosion when MRI erosion is present is 4.1 after 5 years.
Scheel et al. [23] (wrist) Forty-one percent of MRI erosions were seen on radiographs 7 years later.
a
The estimated PPV of MRI erosion predicting radiographic erosion at 7 years is 50%.
a
The estimated relative risk of MRI erosion for future radiographic erosion at 7 years is 43.
McQueen et al. [24] (wrist) This is a study of early rheumatoid arthritis with symptoms of 6 months or less.
Statistical results of an MRI erosion in the wrist predicting future radiographic erosion in the wrist at 1 year were
sensitivity of 83%, specificity of 70%, PPV of 58%, NPV of 91%, and odds ratio of 11.6.
Twelve new erosions over a 1-year period were seen in the dominant wrist of 42 patients.
All three of these studies featured the wrist.
a
Estimated from data reported in the article. MRI, magnetic resonance imaging; NPV, negative
predictive value; PPV, positive predictive value.
Arthritis Research & Therapy Vol 11 No 3 Mundwiler et al.
Page 8 of 10
(page number not for citation purposes)
As opposed to analyzing total BME score, we wanted to deter-
mine whether BME predicts erosive changes in the same joint
on MRI. BME predicted a 50% likelihood of a new bone ero-
sion on MRI in the same joint over a 1-year period (PPV = 0.50,
OR = 68.0 at 12 months, CI = 13.6 to 338.9); the absence of
BME almost guarantees that a bone lesion would not develop
on subsequent MRI over a 1-year period (NPV = 0.99). BME,
however, seems to be a readily reversible lesion, resolving on
70.8% of subsequent studies. Recent histologic studies have
touched on why this association between BME and joint
destruction exists. Jimenez-Boj and colleagues [19] con-
cluded that bone marrow infiltration by inflammatory cells may
be secondary to small breaks in cortical bone that allow the
inflammatory cells to enter. Dalbeth and colleagues [20], how-
ever, concluded that bone marrow infiltrates reflected by BME
upregulate RANKL (receptor activator of nuclear factor kappa-
B ligand) that leads to bone resorption seen in RA. Given the
results of both the MRI and histologic studies, BME represents
pathology that is linked to potential macroscopic destruction
[20]. The reversibility of BME shown in our study, however,
may indicate that this damage can be halted or repaired before
macroscopic bone damage is seen on imaging. In the future,
BME on MRI may prove to determine which patients are can-
didates for the most aggressive treatment early in disease.
Synovitis was definitely the most frequent finding in our sub-
jects, appearing alone and with other lesions. Its ubiquity likely
reflects the concept that synovitis is a primary lesion seen on
MRI in RA patients. Other studies have similarly concluded
that synovitis is the primary lesion in RA [21]. Synovitis
resolved in two thirds of MTPs when present in isolation. Fur-
thermore, only a very small percentage of patients developed
bony lesions on subsequent studies over the 2-year period
when isolated synovitis was seen at baseline, and very few
bony lesions or erosions were noted on follow-up of those
joints in our patients.
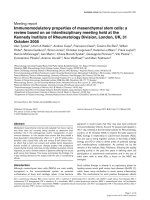
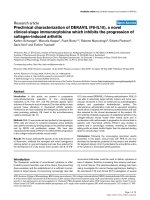
Bone defects, lesions depicting loss of trabecular bone with-
out a cortical break, are of special interest. When new radio-
graphic erosions occurred, the erosions not preceded by an
MRI erosion were preceded by an MRI defect (example shown
in Figure 2). If one generalizes both MRI erosions and defects
as a bone lesion, then a bone lesion was always present prior
to the development of a radiographic erosion in our study.
Thus, their presence may be pathologically significant at the
clinical level. Unlike MRI erosions, however, some bone
defects seem reversible though not as reversible as BME or
synovitis (defects reversed 37.5%, BME 70.8%, synovitis
67.3%). When this study was designed and after we collected
a significant amount of data, bone defects were an official part
of the RAMRIS scoring system; after this study's inception,
bone defects were dropped from RAMRIS because of poor
inter-reader reliability [10]. In our study, we cannot measure
inter-reader reliability between our two radiologists, because
they read the studies in unison and recorded their findings
when they reached agreement. This is a potential weakness in
the study and impacts the degree to which our findings con-
cerning bone defects can be generalized. Nonetheless, even
though the predictive value of an MRI bone lesion is low, our
findings show that an MRI lesion depicting the absence of
bone (either an erosion or defect) is usually evident before a
radiographic erosion appears in the same joint. Thus, com-
pared with the conclusions of future formal studies that would
demand findings that are more precisely defined, our conclu-
sions would probably be more applicable to clinical situations.
When considering all of our findings and those in other stud-
ies, one may postulate that lesions in RA progress in a certain
sequence. Synovitis is a primary lesion but is highly reversible.
Its presence alone does not clearly indicate that joint damage
will take place. The presence of BME, on the other hand, indi-
cates a higher potential for progression to a bone erosion and
represents a critical pathologic period in the development of
an RA erosion [22]. A bone erosion (and in certain cases, a
bone defect) represents a more permanent lesion and is relia-
bly present before a radiographic lesion develops. A reasona-
ble assertion is that BME may represent the most significant
period to therapeutically intervene before joint damage occurs.
Conclusions
Our studies demonstrate that MRI erosions and BME in MTPs
have a low PPV for predicting subsequent radiographic dam-
age and a high NPV where their absence indicates a low prob-
ability of future radiographic damage (that is, if MRI reveals no
MRI erosion or BME, the likelihood that an erosion will appear
in that location is very low). All radiographic erosions in our
cohort, however, were preceded by a bone lesion on MRI.
Even though some of these lesions were defects and are no
longer scored under RAMRIS, we do provide some evidence
that bone defects should be considered significant at least at
the clinical level. Synovitis is often transient and does not reli-
ably lead to further damage. Because there were few radio-
graphic erosions and a large percentage of the cohort were on
anti-TNF therapy, this study suggests that modalities more
sensitive than plain radiographs will likely be necessary in the
biologic era to evaluate the progression of RA.
Competing interests
The authors declare that they have no competing interests.
Authors' contributions
MLM compiled all data, determined the analysis strategy,
helped design the study, recruited patients, and wrote the
manuscript and prepared its submission. PM performed the
statistical analysis and wrote the statistics portion of the man-
uscript. DHB and JMS read all imaging and helped determine
study design. DW helped design the study and recruited
patients. DK helped design the study and assisted with data
analysis. JL helped design the study, helped determine analy-
sis strategy, and advised throughout the completion of the
Available online />Page 9 of 10
(page number not for citation purposes)
manuscript. DEF helped determine study design, recruit
patients, and determine analysis strategy and advised through-
out the completion of the manuscript. MHW determined study
design, recruited patients, helped determine analysis strategy,
advised throughout the completion of the manuscript, and
approved the submitted version of the manuscript. All authors
read and approved the final manuscript.
Acknowledgements
The authors thank Caryn Lane for all her great work coordinating the
imaging efforts and Emma Hasan and Felice Lin for their excellent work
in coordinating the clinical and data organization efforts.
References
1. Odegard S, Landewe R, Heijde D Van der, Kvien TK, Mowinckel P,
Uhlig T: Association of early radiographic damage with
impaired physical function in rheumatoid arthritis. Arthritis
Rheum 2006, 54:68-75.
2. Forslind K, Larsson EM, Johansson A, Svensson B: Detection of
joint pathology by magnetic resonance imaging in patients
with early rheumatoid arthritis. Br J Rheumatol 1997,
36:683-688.
3. Østergaard M, Hansen M, Stoltenberg M, Jensen KE, Szkudlarek
M, Pedersen-Zbinden P, Lorenzen I: New radiographic bone ero-
sions in the wrists of patients with rheumatoid arthritis are
detectable with magnetic resonance imaging a median of two
years earlier. Arthritis Rheum 2003, 48:2128-2131.
4. Ejbjerg B, Vestergaard A, Jacobsen S, Thomsen HS, Østergaard
M: The smallest detectable difference and sensitivity to
change of magnetic resonance imaging and radiographic
scoring of structural joint damage in rheumatoid arthritis fin-
ger, wrist, and toe joints. Arthritis Rheum 2005, 52:2300-2306.
5. Brown AK, Conaghan P, Karim Z, Quinn MA, Ikeda K, Peterfy C,
Hensor E, Wakefield RJ, O'Connor P, Emery P: An explanation
for the apparent dissociation between clinical remission and
continued structural deterioration in rheumatoid arthritis.
Arthritis Rheum 2008, 58:2958-2967.
6. Boutry N, Larde A, Lapegue F, Solau-Gervais E, Flipo R-M, Cotten
A: Magnetic resonance imaging appearance of the hands and
feet in patients with early rheumatoid arthritis. J Rheumatol
2003, 30:671-679.
7. Ostendorf B, Scherer A, Modder U, Schneider M: Diagnostic
value of magnetic resonance imaging of the forefeet in early
rheumatoid arthritis when findings of the metacarpophalan-
geal joints of the hands remain normal. Arthritis Rheum 2004,
50:2094-2102.
8. Hulsmans HMJ, Jacobs JWG, Heijde DMFM van der, van Albada-
Kuipers GA, Schenk Y, Bijlsma JW: The course of radiologic
Figure 2
Sample imaging depicting bone defect on magnetic resonance imaging before radiographic erosionSample imaging depicting bone defect on magnetic resonance imaging before radiographic erosion. Images (a-c) were taken 1 year before images
(d-f). Image (a) is T1-weighted and has a small defect (arrow). Image (b) is T2-weighted with fat saturation clearly showing synovitis (arrow). Image
(c), the radiograph, was read as normal because the cortex was intact. Image (d), T1-weighted, clearly shows absence of bone read as erosion
(arrow). Image (e) shows synovitis and bone marrow edema (arrow). Image (f) clearly shows bone erosion (arrow).
Arthritis Research & Therapy Vol 11 No 3 Mundwiler et al.
Page 10 of 10
(page number not for citation purposes)
damage during the first six years of rheumatoid arthritis.
Arthritis Rheum 2000, 43:1927-1940.
9. Pensec VD, Saraux A, Berthelot JM, Alapetite S, Jousse S, Le Hen-
aff C, Chales G, Thorel JB, Hoang S, Nouy-Trolle I, Martin A, Chi-
occhia G, Youinou P, Le Goff P: Ability of foot radiographs to
predict rheumatoid arthritis in patients with early arthritis. J
Rheumatol 2004, 31:66-70.
10. Peterfy C, Edmonds J, Lassere M, Conaghan P, Østergaard M,
McQueen FM, Genant H, Klarlund M, Ejbjerg B, Stewart N, Bird P,
Shnier R, O'Connor P, Emery P: OMERACT Rheumatoid arthritis
MRI studies module. J Rheumatol 2003, 30:1364-1392.
11. Heijde D van der: How to read radiographs according to the
Sharp/van der Heijde method. J Rheumatol 1999, 26:743-745.
12. Mottonen TT: Prediction of erosiveness and rate of develop-
ment of new erosion in early rheumatoid arthritis. Ann Rheum
Dis 1988, 47:648-653.
13. McQueen FM, Benton N, Crabbe J, Robinson E, Yeoman S,
McClean L, Stewart N: What is the fate of erosions in early rheu-
matoid arthritis? Tracking individual lesions using x rays and
magnetic resonance imaging over the first two years of dis-
ease. Ann Rheum Dis 2001, 60:859-868.
14. Smolen J, Han C, Bala M, Maini RN, Kalden JR, Heijde D van der,
Breedveld FC, Furst DE, Lipsky PE: Evidence of radiographic
benefit of treatment with infliximab plus methotrexate in rheu-
matoid arthritis patients who had no clinical improvement.
Arthritis Rheum 2005, 52:1020-1030.
15. Yvonne PM, Goekoop-Ruiterman YPM, de Vries-Bouwstra JK,
Allart CF, van Zeben D, Kerstens PJSM, Hazes MW, Zwinderman
AH, Peeters AJ, de Jonge-Bok JM, Mallee C, de Beus WM, de Son-
naville PBJ, Ewals JAPM, Breedveld FC, Dijkmans BAC: Compar-
ison of treatment strategies in early rheumatoid arthritis: a
randomized trial. Ann Intern Med 2007, 146:406-415.
16. McQueen FM, Benton N, Perry D, Crabbe J, Robinson E, Yeoman
S, McClean L, Stewart N: Bone edema scored on magnetic res-
onance imaging scans of the dominant carpus at presentation
predicts radiographic joint damage of the hands and feet six
years later in patients with rheumatoid arthritis. Arthritis
Rheum 2003, 48:1814-1827.
17. Haavardsholm EA, Bøyesen P, Østergaard M, Schildvold A, Kvien
TK: Magnetic resonance imaging findings in 84 patients with
early rheumatoid arthritis: bone marrow oedema predicts ero-
sive progression. Ann Rheum Dis
2008, 67:794-800.
18. Hetland ML, Ejbjerg B, Hørslev-Petersen K, Jacobsen S, Vester-
gaard A, Jurik AG, Stengaard-Pedersen K, Junker P, Lottenburger
T, Hansen I, Andersen LS, Tarp U, Skjødt H, Pedersen JK, Maj-
gaard O, Svendsen AJ, Ellingsen T, Lindegaard H, Christensen AF,
Vallø J, Torfing T, Narvestad E, Thomsen HS, Østergaard M,
CIMESTRA study group: MRI bone oedema is the strongest
predictor of subsequent radiographic progression in early
rheumatoid arthritis. Results from a 2-year randomised con-
trolled trial (CIMESTRA). Ann Rheum Dis 2009, 68:384-390.
19. Jimenez-Boj E, Redlich K, Turk B, Hanslik-Schnabel B, Waniven-
haus A, Chott A, Smolen J, Schett G: Interaction between syno-
vial inflammatory tissue and bone marrow in rheumatoid
arthritis. J Immunol 2005, 175:2579-2588.
20. Dalbeth N, Smith T, Gray S, Doyle A, Antill P, Lobo M, Robinson E,
King A, Cornish J, Shalley G, Gao A, McQueen FM: Cellular char-
acterisation of magnetic resonance imaging bone oedema in
rheumatoid arthritis; implications for pathogenesis of erosive
disease. Ann Rheum Dis 2009, 68:279-282.
21. Conaghan P, O'Connor P, McGonagle D, Astin P, Wakefield RJ,
Gibbon W, Quinn MA, Karim Z, Green M, Proudman S, Isaacs J,
Emery P: Elucidation of the relationship between synovitis and
bone damage: a randomized magnetic resonance imaging
study of individual joints in patients with early rheumatoid
arthritis. Arthritis Rheum 2003, 48:64-71.
22. McQueen FM, Ostendorf B: What is MRI bone oedema in rheu-
matoid arthritis and why does it matter? Arthritis Res Ther
2006, 8:222-227.
23. Scheel AK, Hermann KG, Ohrndorf S, Werner C, Schirmer C,
Detert J, Bollow M, Hamm B, Muller GA, Burmester GR, Backhaus
M: Prospective 7 year follow up imaging study comparing radi-
ography, ultrasonography, and magnetic resonance imaging
in rheumatoid arthritis finger joints. Ann Rheum Dis 2006,
65:595-600.
24. McQueen FM, Stewart N, Crabbe J, Robinson E, Yeoman S, Paul
L, Tan J, McClean L: Magnetic resonance imaging of the wrist
in early rheumatoid arthritis reveals progression of erosions
despite clinical improvement. Ann Rheum Dis 1999,
58:156-163.