Báo cáo y học: "Methotrexate therapy associates with reduced prevalence of the metabolic syndrome in rheumatoid arthritis patients over the age of 60- more than just an anti-inflammatory effect? A cross sectional study" pptx
Bạn đang xem bản rút gọn của tài liệu. Xem và tải ngay bản đầy đủ của tài liệu tại đây (315.83 KB, 10 trang )
Open Access
Available online />Page 1 of 10
(page number not for citation purposes)
Vol 11 No 4
Research article
Methotrexate therapy associates with reduced prevalence of the
metabolic syndrome in rheumatoid arthritis patients over the age
of 60- more than just an anti-inflammatory effect? A cross
sectional study
Tracey E Toms
1,2
, Vasileios F Panoulas
1
, Holly John
1
, Karen MJ Douglas
1
and George D Kitas
1,2
1
Department of Rheumatology, Dudley Group of Hospitals NHS Trust, Russells Hall Hospital, Dudley, West Midlands, DY1 2HQ, UK
2
ARC Epidemiology Unit, Manchester University, Oxford Road, Manchester, M13 9PT, UK
Corresponding author: George D Kitas,
Received: 1 Apr 2009 Revisions requested: 11 May 2009 Revisions received: 22 Jun 2009 Accepted: 16 Jul 2009 Published: 16 Jul 2009
Arthritis Research & Therapy 2009, 11:R110 (doi:10.1186/ar2765)
This article is online at: />© 2009 Toms et al.; licensee BioMed Central Ltd.
This is an open access article distributed under the terms of the Creative Commons Attribution License ( />),
which permits unrestricted use, distribution, and reproduction in any medium, provided the original work is properly cited.
Abstract
Introduction The metabolic syndrome (MetS) may contribute to
the excess cardiovascular burden observed in rheumatoid
arthritis (RA). The prevalence and associations of the MetS in
RA remain uncertain: systemic inflammation and anti-rheumatic
therapy may contribute. Methotrexate (MTX) use has recently
been linked to a reduced presence of MetS, via an assumed
generic anti-inflammatory mechanism. We aimed to: assess the
prevalence of the MetS in RA; identify factors that associate with
its presence; and assess their interaction with the potential
influence of MTX.
Methods MetS prevalence was assessed cross-sectionally in
400 RA patients, using five MetS definitions (National
Cholesterol Education Programme 2004 and 2001,
International Diabetes Federation, World Health Organisation
and European Group for Study of Insulin Resistance). Logistic
regression was used to identify independent predictors of the
MetS. Further analysis established the nature of the association
between MTX and the MetS.
Results MetS prevalence rates varied from 12.1% to 45.3% in
RA according to the definition used. Older age and higher HAQ
scores associated with the presence of the MetS. MTX use, but
not other disease modifying anti-rheumatic drugs (DMARDs) or
glucocorticoids, associated with significantly reduced chance of
having the MetS in RA (OR = 0.517, CI 0.33–0.81, P = 0.004).
Conclusions The prevalence of the MetS in RA varies
according to the definition used. MTX therapy, unlike other
DMARDs or glucocorticoids, independently associates with a
reduced propensity to MetS, suggesting a drug-specific
mechanism, and makes MTX a good first-line DMARD in RA
patients at high risk of developing the MetS, particularly those
aged over 60 years.
Introduction
Rheumatoid arthritis (RA) patients have a reduced life expect-
ancy and higher mortality rates than the general population
[1,2], with cardiovascular disease (CVD) accounting for
approximately half of this [3,4]. Although traditional cardiovas-
cular risk factors such as hypertension [5,6], central obesity
[7,8] and insulin resistance [9] may occur more frequently
among RA patients, this does not fully account for the rates of
CVD observed [10], and besides genetic predisposition [11],
novel risk factors and mechanisms, including systemic inflam-
mation per se, have also been implicated [12].
The metabolic syndrome (MetS) reflects a clustering of classi-
cal cardiovascular risk factors including insulin resistance,
central obesity, elevated blood pressure, high triglyceride (TG)
levels and low levels of high-density lipoprotein (HDL) [13].
Apo: apolipoprotein; CI: confidence interval; CRP: C-reactive protein; CVD: cardiovascular disease; DAS28: 28-joint disease assessment score;
DMARD: disease-modifying anti-rheumatic drugs; EGIR: European Group for Study of Insulin Resistance; ESR: erythrocyte sedimentation rate; HAQ:
health assessment questionnaire; HDL: high-density lipoprotein; HOMA IR: homeostasis model assessment of insulin resistance; IDF: International
Diabetes Federation; LDL: low-density lipoprotein; MetS: metabolic syndrome; NCEP: National Cholesterol Education Programme; NSAIDs: non-ster-
oidal anti-inflammatory drugs; OR: odds ratio; QUICKI: quantitative insulin sensitivity check index; RA: rheumatoid arthritis; TC: total cholesterol; TG:
triglycerides; TNF: tumour necrosis factor; WHO: World Health Organization.
Arthritis Research & Therapy Vol 11 No 4 Toms et al.
Page 2 of 10
(page number not for citation purposes)
The MetS has been identified as an independent cardiovascu-
lar risk factor, conferring risk above and beyond the sum of its
individual components [14], although this has recently been
questioned [15]. The MetS has been shown to be highly prev-
alent among American patients with RA, with rates being four
times those reported in the general population [16]. In con-
trast, another study among Mediterranean RA patients also
showed a high MetS prevalence but failed to demonstrate a
significant difference from local general population controls
[17].
To date, five definitions for the MetS have been developed:
The National Cholesterol Education Programme (NCEP)
2004 [18] and NCEP 2001 [19], the World Health Organiza-
tion (WHO) [20], the International Diabetes Federation (IDF)
[21] and the European Group for Study of Insulin Resistance
(EGIR) [22]. These share many similarities; however, they dif-
fer in some of the components, as well as their specified cut-
offs and weighting. In the general population, prevalence rates
of the MetS have been shown to vary dramatically according
to the definition used [23,24], with the IDF classification [21]
tending to report the highest and the EGIR classification [22]
the lowest within a European study population [25-27]. To
date, two comparative studies have been performed in an RA
population, both of which found a similar prevalence of the
MetS according to the WHO and NCEP 2001 criteria [16,28].
Several of the individual components of the MetS have been
shown to be influenced by demographic, anthropometric and
RA-specific factors [6,8,29], but there has been very little work
aimed at identifying factors that may be associated with the
presence of MetS as a whole in patients with RA [30]. Such
associations may be key to tackling MetS and reducing CVD-
related morbidity and mortality in RA. Studies have demon-
strated significant reductions in CVD-related mortality in
patients treated with methotrexate [31,32]. This finding has
been attributed to the potent anti-inflammatory properties of
methotrexate. Interestingly, another study in 107 exclusively
female RA patients has recently reported a negative associa-
tion between methotrexate use and the MetS [30]. This rela-
tionship was again assumed to be the result of the anti-
inflammatory properties exhibited by methotrexate, but no fur-
ther sub-analyses were performed to confirm or refute this.
In this study we aimed to: (1) assess the prevalence of the
MetS in a large RA population according to all definitions cur-
rently used, in order to develop a bench-mark allowing com-
parisons between other relevant studies in the future; (2) to
identify demographic, anthropometric and RA-disease spe-
cific factors that may be associated with the presence of the
MetS in RA patients; (3) to establish if anti-rheumatic drug use
(in particular methotrexate), is associated with the presence of
the MetS, and whether this occurs in a drug-specific manner
or as a result of an overall anti-inflammatory effect.
Materials and methods
Four hundred RA patients fulfilling the 1987 revised American
College of Rheumatology classification criteria [33], were
recruited from outpatient clinics at the Dudley Group of Hos-
pitals NHS Foundation Trust between 2004 and 2006 (the
Dudley Rheumatoid Arthritis Comorbidity Cohort, the charac-
teristics of which have been previously described in detail)
[6,34]. Of them, 387 with a complete dataset required for this
study were analysed, and results presented refer to those
patients. The study was granted full ethical approval from the
local ethics committee and all patients gave their informed
written consent prior to commencement of the study.
Patient data was obtained via case note analysis and a face-
to-face interview performed by a rheumatologist. The dual
approach facilitated the documentation of a detailed history to
include: disease course/characteristics (including disease
duration), drug use (all anti-rheumatic drugs, glucocorticoid
use, cardiovascular drugs and analgesics among others), co-
morbid conditions, and family history of rheumatic and cardio-
vascular diseases. Details of current medication prescriptions
were recorded at baseline (no prospective data was col-
lected), and previous anti-rheumatic drug use were recorded
via retrospective case note analysis and patient interview.
Baseline demographics were recorded and anthropometric
characteristics were measured as previously described [9].
Current disease activity and physical function were assessed
using the 28-joint disease activity score (DAS28) [35] and the
health assessment questionnaire (HAQ) [36], respectively.
Baseline blood samples were obtained from each patient and
were analysed in a single laboratory. Blood tests included: C-
reactive protein (CRP), erythrocyte sedimentation rate (ESR),
fasting lipid profile (total cholesterol (TC), HDL, low density
lipoproteins (LDL), TG), rheumatoid factor, anti-cyclic citrulli-
nated peptide antibodies, thyroid function tests), liver function
tests, renal function, insulin and fasting glucose. All lipid com-
ponents were analysed using the Vitros
®
5,1FS chemistry
system (Ortho Clinical Diagnostics, Markham, Ontario, Can-
ada), with multilayered slides used to measure TC, HDL, and
TGs, whereas a dual chamber package was used to assess
LDL, apolipoprotein (Apo) A and ApoB. Insulin resistance was
evaluated from fasting glucose and insulin using the Homeos-
tasis Model Assessment of Insulin Resistance (HOMA IR) [37]
and the Quantitative Insulin Sensitivity Check Index (QUICKI)
[38], and was defined as the presence of diabetes mellitus or
HOMA IR of 2.5 or more or QUICKI of 0.333 or less. Renal
function assessment was made by estimation of glomerular fil-
tration rate according to the Modification of Diet in Renal Dis-
ease equation [39].
For the purposes of this study, the prevalence of the MetS was
analysed according to all existing definitions (NCEP 2004,
NCEP 2001, WHO, IDF, EGIR; Table 1) in order to establish
the range of discrepancy between them. For further analysis of
Available online />Page 3 of 10
(page number not for citation purposes)
the predictors of the metabolic syndrome only the NCEP 2004
definition is presented, as this is most up to date and widely
used definition reported in the literature, thus allowing compar-
isons to be drawn with other studies.
Statistical analysis
This was carried out using SPSS 15.0 (SPSS Inc, Chicago, IL,
USA). The distribution of each variable was examined using
Kolmogorov-Smirnov function. Results are expressed as mean
± standard deviation, median (25
th
to 75
th
percentile), or per-
centages, as appropriate. For the univariate analysis, chi-
squared, t-test and Mann-Whitney U tests were used to test
categorical, normally and not normally distributed data,
respectively. The independence of the predictors of the MetS
was tested in the multivariate models using binary logistic
regression.
Results
Descriptive characteristics of study population
The study population comprised of 72.9% females (282/387)
and had a median age of 63.1 years. Patients had a median
disease duration of 10 years, and had moderate disease activ-
ity (mean DAS28 score 4.2).
Disease-modifying anti-rheumatic drugs (DMARDs) were
widely prescribed among this cohort (340/387), either as
monotherapy (218/387) or combination therapy (122/387).
The breakdown of DMARD usage was: 218 (56%) patients
were taking methotrexate, 114 (29.5%) sulphasalazine, 77
(19.9%) hydroxychloroquine and 16 (4.1%) leflunomide. Bio-
logic therapy and glucocorticoids were prescribed in 45
(11.6%) and 56 (14.5%) patients, respectively. The use of
other drugs known to influence components of the MetS
included: statins in 83 (21.4%), anti-hypertensives in 171
(44.2%) and NSAIDs/cyclo-oxygenase-II inhibitors in 108
(27.9%) patients.
Prevalence of the metabolic syndrome according to
definition used
There was great diversity in the reported prevalence rates
according to the definition used (Table 2). The prevalence
ranged from 12.1% to 45.3%, with EGIR reporting the lowest
rate, the IDF criteria reporting the highest rate, and the cur-
rently most commonly used NCEP 2004 criteria reporting a
rate of 40.1%. A small variation in the total number of patients
included for analysis of prevalence of the metabolic syndrome
according to each definition was observed. This phenomenon
was the result of incomplete data on a few patients. The prev-
alence of the MetS increased with age up until the seventh
decade and fell off thereafter, and was similar in males and
females (P = 0.429; Table 3).
Associations of the metabolic syndrome in patients with
RA
Results presented are only for the MetS as defined by NCEP
2004, but were very similar using any of the other definitions,
despite the difference in prevalence.
In univariate analysis, patients with the MetS were significantly
older (P = 0.001), had shorter disease duration (P = 0.008),
Table 1
A summary of the definitions of the metabolic syndrome
NCEP 2004 [18] NCEP 2001 [19] WHO [20] EGIR [22] IDF [21]
Number of criteria Three or more of: Three or more of: And two or more of: And two or more of: And two or more of:
Obesity WC ≥ 102 cm (men),
WC ≥ 88 cm
(women)
WC ≥ 102 cm (men),
WC ≥ 88 cm
(women)
BMI > 30 and/or
WHR > 0.9 (men),
WHR > 0.85
(women)
WC ≥ 94 cm (men,
WC ≥ 80 cm
(women)
WC
≥
94 cm men,
WC
≥
80 cm women*
Hypertension
(mmHg)
≥ 130/85** ≥ 130/85** ≥ 140/90 ≥ 140/90** ≥ 130/85**
Dyslipidaemia:
HDL-C (mmol/L)
< 1.0 (men),
< 1.3 (women)**
< 1.0 (men),
< 1.3 (women)**
< 0.9 (men)
< 1.0 (women) or
< 1.0** < 1.0 (men)
< 1.3 (women)**
TG (mmol/L) ≥ 1.7** ≥ 1.7** ≥ 1.7 > 2.0** > 1.7**
Glucose intolerance
or fasting plasma
glucose (mmol/L)
≥ 5.6** ≥ 6.1** ≥ 6.1, DM, IGT, IR ≥ 6.1
(excludes diabetics)
Insulin in top 25%
≥ 5.6**
Albumin/creatinine
ratio (mg/L)
N/A N/A ≥ 30 N/A N/A
Text in bold italics: prerequisite for diagnosis, in addition to the number of other criteria needed to be met. ** or treated for abnormality, * cut-off
values differ according to ethnic origin.
BMI = body mass index; DM = diabetes mellitus; EGIR = European Group against Insulin Resistance; HDL-C = high-density lipoprotein-
cholesterol; IDF = International Diabetes Federation; IGT = impaired glucose tolerance; IR = insulin resistance; N/A = not applicable;NCEP =
National Cholesterol Education Programme; TG = triglyceride; WC = waist circumference; WHO = World Health Organization; WHR = waist hip
ratio.
Arthritis Research & Therapy Vol 11 No 4 Toms et al.
Page 4 of 10
(page number not for citation purposes)
higher ESR (P = 0.006), higher HAQ scores (P = 0.036) and
significantly less of them were treated with methotrexate (P =
0.001), compared with those who did not have the MetS
(Table 4).
The independence of each of these associations (and for com-
pleteness also sex) were tested in a multivariate logistic
regression model. Older age (β = 0.034, P ≤ 0.001), higher
HAQ scores (β = 0.335, P = 0.024) and less methotrexate
use (β = -0.663, P = 0.001) values remained significant inde-
pendent predictors of the presence of the MetS in RA
patients. Patients on methotrexate had half the odds of having
the metabolic syndrome compared with those not taking meth-
otrexate (odds ratio (OR) = 0.525, 95% confidence interval
(CI) = 0.96 to 1.56, P = 0.003). The odds were not signifi-
cantly altered when other DMARD, anti-TNF therapies, gluco-
corticoid use and NSAID medications were added to the
model (OR = 0.517, 95% CI = 0.33 to 0.81, P = 0.004; Table
5).
The multivariate model was repeated, replacing ESR with
DAS28 score and subsequently with CRP, to check for any
differences among these potential confounders. The results
were not found to differ significantly by using DAS28 or CRP
instead of ESR (OR = 0.480, 95% CI = 0.26 to 0.88, P =
0.017; or OR = 0.466, 95% CI = 0.26 to 0.83, P = 0.010,
respectively).
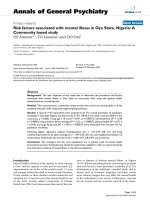
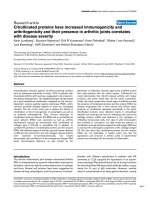
Methotrexate and the metabolic syndrome
Methotrexate was found to be an independent predictor for
the MetS according to all definitions except WHO (Figure 1).
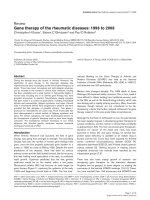
Methotrexate use was associated with improvements in lipid
parameters and fasting plasma glucose levels, with lower TG
levels (P = 0.019), higher HDL levels (P ≤ 0.001), and lower
fasting plasma glucose levels (P ≤ 0.001; Figure 2). Meth-
otrexate use did not associate with waist circumference, blood
pressure or insulin resistance. No significant association was
found between previous methotrexate use and having the
MetS.
Discussion
In this study we confirm that the MetS is highly prevalent in RA
(in up to 45.3% of patients) but its prevalence depends on the
definition used, in a very similar manner to that seen in the gen-
eral population, with the IDF criteria reporting the highest and
the EGIR criteria the lowest rates. We also demonstrate for
the first time that, irrespective of the definition used, factors
including older age and disease severity (HAQ) are associated
with the presence of the MetS in patients with RA. More impor-
tantly, methotrexate therapy appears to significantly decrease
Table 2
Prevalence of metabolic syndrome according to definition used
Definition of MetS used Prevalence
Total Males Females P value
IDF n (%) 159 (45.3) 49 (52.7) 110 (42.6) 0.095
NCEP 2004 n (%) 156 (40.1) 45 (42.5) 111 (39.2) 0.563
NCEP 2001 n (%) 149 (38.3) 42 (40.0) 107 (37.7) 0.676
WHO n (%) 70 (19.4) 25 (25.5) 45 (17.2) 0.075
EGIR n (%) 47 (12.1) 24 (22.6) 23 (8.2) < 0.001
EGIR = European Group for Insulin Resistance; IDF = International Diabetes Federation; MetS = metabolic syndrome; NCEP = National
Cholesterol Education Programme; WHO = World Health Organization.
Table 3
Prevalence of the metabolic syndrome in specific age ranges
Prevalence
NCEP 2004
n = 156
NCEP 2001
n = 149
WHO
n = 70
IDF
n = 159
EGIR
n = 47
Age < 40 years n (%) 2 (0.5) 2 (0.5) 2 (0.6) 3 (0.9) 0 (0)
Age 40 to 49 years n (%) 12 (3.1) 12 (3.1) 4 (1.1) 12 (3.4) 0 (0)
Age 50 to 59 years n (%) 32 (8.2) 29 (7.5) 15 (4.2) 32 (9.1) 12 (3.1)
Age ≥ 60 years n (%) 110 (28.3) 106 (27.2) 49 (13.6) 112 (31.9) 35 (9.0)
EGIR = European Group for Insulin Resistance; IDF = International Diabetes Federation; NCEP = National Cholesterol Education Programme;
WHO = World Health Organization.
Available online />Page 5 of 10
(page number not for citation purposes)
Table 4
Demographic, clinical and laboratory characteristics of the study population (NCEP 2004 definition used)
Total (n = 387) MetS present (n = 156) MetS abscent
(n = 232)
P value
General demographics
Age (years) 63.1 (55.5 to 69.6) 65.3 (58.2 to 69.8) 61.4 (51.9 to 75.4) 0.001
Sex female n (%) 282 (72.9) 110 (71) 172 (74.1) 0.429
RA characteristics
General characteristics
RF positive n (%) 287 (75.9) 121 (79.1) 166 (73.8) 0.236
Anti-CCP positive n (%) 250 (67.6) 101 (68.2) 149 (67.1) 0.821
Disease duration (years) 10 (4 to 18) 9 (4 to 18.5) 10 (4 to 17) 0.008
Disease activity
CRP (mg/L) 8 (5 to 20) 9 (5 to 20) 8 (4 to 18) 0.155
ESR 21 (9 to 37) 23 (15 to 40) 18 (8 to 32) 0.006
DAS28 4.2 +/- 1.4 4.25 +/- 1.29 4.14 +/- 1.44 0.437
Disease severity
HAQ 1.5 (0.63 to 2.13) 1.63 (0.88 to 2.25) 1.5 (0.38 to 2) 0.036
EAD n (%) 257 (66.4) 11 (71.6) 146 (62.9) 0.076
Joint replacement surgery n (%) 276 (71.3) 110 (71) 166 (71.6) 0.901
Medication
Methotrexate n (%) 218 (56.0) 72 (46.5) 148 (63.8) 0.001
Sulphasalazine n (%) 114 (29.5) 46 (29.7) 68 (29.3) 0.938
Hydroxychloroquine n (%) 77 (19.9) 26 (16.8) 51 (22) 0.209
Anti-TNF n (%) 45 (11.6) 20 (12.9) 25 (10.8) 0.522
Leflunomide n (%) 16 (4.1) 8 (5.2) 8 (3.4) 0.407
Prednisol medium dose n (%) 56 (14.5) 28 (12.1) 28 (18.1) 0.241
NSAIDs/COX-II n (%) 108 (27.9) 37 (23.9) 71 (30.6) 0.148
Anti-hypertensives n (%) 171 (44.2) 107 (69) 64 (24.6) < 0.001
Statin/fibrate n (%) 83 (21.4) 80 (51.6) 3 (1.3) < 0.001
Risk factors for the MetS
Waist (cm) 97.7 +/- 13.13 103.5 +/- 13.13 93.8 +/- 11.69 < 0.001
Triglycerides (mmol/L) 1.2 (1 to 1.6) 1.5 (1.1 to 2.1) 1.1 (0.9 to 1.4) < 0.001
Systolic BP (mmHg) 140 (127 to 154.5) 144 (132.5 to 159.5) 65.3 (58.1 to 69.8) < 0.001
Diastolic BP (mmHg) 78.9 +/- 11.18 79.68 +/- 11.14 78.56 +/- 11.05 0.331
HDL (mmol/L) 1.6 (1.3 to 1.8) 1.4 (1.1 to 1.7) 1.6 (1.4 to 1.9) < 0.001
Insulin resistance n (%) 140 (37.2) 87 (62.1) 53 (37.9) < 0.001
Criteria for MetS
WaistM n(%) 230 (65.7) 122 (86.5) 108 (51.7) < 0.001
TriglyceridesM n(%) 147 (38) 125 (80.6) 22 (9.5) < 0.001
HypertensionM n(%) 311 (80.4) 151 (97.4) 160 (69) < 0.001
HDLM n(%) 136 (35.1) 116 (74.8) 20 (8.6) < 0.001
FPGM1 n(%) 57 (14.8) 47 (30.5) 10 (4.3) < 0.001
Albumin/Creatinine ratio 42 (10.9) 21 (10.6) 21 (14.6) 0.269
Results expressed as percentages, median (25
th
to 75th percentile values) or mean ± standard deviation as appropriate. insulin resistance =
homeostasis model assessment ≥ 2.5 or quantitative insulin sensitivity check index = 0.333; waist M = waist circumference > 102 cm in males
and > 88 cm in females; triglyceridesM = triglycerides ≥ 1.7 mmol/L or on drug treatment for elevated triglycerides, hypertensionM = systolic BP
≥ 130/85 mmHg or on antihypertensive medication; HDLM = high-density lipoprotein level < 1.0 mmol/L in males or < 1.3 mmol/L in females;
FPGM = fasting plasma glucose ≥ 6.1 or on drug treatment for elevated blood glucose.
anti-CCP = anti-cyclic citrullinated peptide; BP = blood pressure; COX-II = cyclooxygenase II inhibitors; CRP = C-reactive protein; DAS =
Disease Activity Score; EAD = extra-articular disease; ESR = erythrocyte sedimentation rate; HAQ = Health Assessment Questionnaire; HDL =
high-density lipoprotein; MetS = metabolic syndrome; NCEP = National Cholesterol Education Programme; NSAIDs = non-steroidal anti-
inflammatory drugs; RA = rheumatoid arthritis; RF = rheumatoid factor; TG = triglycerides; TNF = tumour necrosis factor.
Arthritis Research & Therapy Vol 11 No 4 Toms et al.
Page 6 of 10
(page number not for citation purposes)
the odds of having the MetS, independently of any of these
factors, suggesting the possibility of a drug-specific protective
mechanism.
To date, four other studies have commented on the prevalence
of the MetS in patients with RA, reporting prevalence rates
ranging from 14% to 44% [16,17,28,30]. Such diversity can
be explained by differences in the baseline characteristics and
disease characteristsics. Overall, we have reported similar
prevalence rates according to the NCEP 2001 as other inves-
tigators (38.3%). However, we report a lower prevalence
when using the WHO criteria (19.4%) and find this discrep-
ancy difficult to explain, particularly in the context of the relative
concordance between the prevalence rates defined by the
NCEP and WHO criteria in two other studies [16,28].
In this study we observed similar prevalence rates of the MetS
among males and females (P = 0.429). This was consistent
across all definitions of the metabolic syndrome, apart from the
EGIR classification, which diagnosed significantly more males
than females (P < 0.001). These findings differ from those
observed in the general population, where age-matched
females have been reported to have significantly higher rates
of the MetS [40]. This discrepancy may be a consequence of
the ongoing inflammatory burden in the RA population, altering
some of the components of the metabolic syndrome.
The factors found to associate independently with the meta-
bolic syndrome in RA included older age, higher HAQ scores
and less methotrexate usage. The association with older age
is not surprising, because in the general population the MetS
has been shown to affect primarily older subjects, as a conse-
quence of age-related modification of some of its components
[41]. Higher HAQ scores are also likely to associate with the
MetS in RA, because patients with more severe disabling dis-
ease are likely to lead a less active lifestyle, resulting in
increased obesity and alterations in the lipid profile [42,43].
One of the most interesting findings from this study, however,
is the negative association between methotrexate use and the
presence of the MetS, which suggests that MTX may protect
against its development. This association has also recently
been observed in a study by Zonana-Nacach and colleagues
[30]. In that study, this association was assumed to be purely
due to the anti-inflammatory effect of MTX, leading to modifi-
cation of the components that collectively make up the MetS,
although no data were presented to support this contention.
The results of our study suggest that any protective effect of
methotrexate is likely to be drug-specific, and not the result of
a generic anti-inflammatory effect, because it was not
observed with any of the other DMARDs. Alongside this, we
have recently presented data demonstrating that the use of
glucocorticoids is not associated with the presence of the
MetS [44], thus again arguing against a potential anti-inflam-
matory mechanism of action of methotrexate.
In view of patient age acting as an independent predictor for
the MetS, we performed a further subanalysis to examine the
potential effects of methotrexate on the MetS according to age
(age ≥ 60 years versus age < 60 years). This demonstrated
that the 'protective' effects of methotrexate on the presence of
the MetS are only present in patients over the age of 60 years.
These findings are unsurprising given that patients over the
Table 5
Odds ratios for having the metabolic syndrome in patients
receiving methotrexate compared with those not on
methotrexate
Odds ratio 95% confidence interval P value
Crude 0.483 0.32 to 0.73 0.001
Model a 0.505 0.33 to 0.77 0.001
Model b 0.525 0.34 to 0.80 0.003
Model c 0.517 0.33 to 0.80 0.004
Crude = unadjusted model
Model a = adjusted for age and sex
Model b = adjusted for age, sex, disease duration, erythrocyte
sedimentation rate and health assessment questionnaire score
Model c = adjusted for age, sex, disease duration, erythrocyte
sedimentation rate, health assessment questionnaire score,
sulphasalazine, hydroxyxhloroquine, leflunomide, anti-tumour
necrosis factor therapy, glucocorticoid use and NSAID use.
Figure 1
The relationship between methotrexate use and the presence of the metabolic syndrome according to the definition usedThe relationship between methotrexate use and the presence of the metabolic syndrome according to the definition used. * P < 0.05. EGIR
= European Group Against Insulin Resistance; IDF = International Diabetes federation; NCEP = National Cholesterol Education Programme; WHO
= World Health Organisation.
Available online />Page 7 of 10
(page number not for citation purposes)
age of 60 years have a higher prevalence of the metabolic syn-
drome, upon which methotrexate can act.
In order to gain further understanding of potential mechanisms
that may underlie this phenomenon, we analysed the impact of
methotrexate on the individual components of the MetS. Meth-
otrexate use is associated with lower TG, higher HDL and
lower fasting glucose levels, but did not appear to be associ-
ated with either blood pressure or obesity (as assessed by
waist circumference). Although the inflammatory process has
been shown to directly modify many of these parameters
[29,45,46], this would not explain the specificity of the effect
to MTX but not other DMARDs, including biologics, as well as
glucocorticoids.
These observations provide interesting insights into the poten-
tial mode of action of MTX. One possible mode of action may
be through alterations in adenosine concentrations. Extracellu-
lar adenosine levels are increased by methotrexate and are
known to mediate its anti-inflammatory effect [47,48]. To
accompany this, there is evidence that adenosine enhances
the effects of insulin on glucose transport and metabolism, and
may also alter aspects of lipid metabolism [49]. A recent study
has also provided evidence that MTX may offer an atheropro-
tective effect, through activation of the adenosine A
2A
, thus
promoting reverse cholesterol transport [50]. Another possi-
ble mode of action may be indirect, in that it may occur not as
a consequence of methotrexate use per se, but as a conse-
quence of concurrent folic acid supplementation. Folic acid
has been shown to suppress plasma homocysteine levels
[51]. This may be particularly important in the context of the
MetS, which is known to be associated with high homo-
cysteine levels [52]. Insulin resistance is thought to be the key
to the underlying pathophysiology of the MetS, and can
improve with folate replacement therapy [53]. Thus, suppres-
sion of a potential precipitant (homocysteine) via the use of
folic acid may protect against the development of the MetS in
patients such as these, who take MTX with concurrent folate
supplementation. With this in mind, we scrutinised our data
further to look at folate and homocysteine levels according to
the prescription of methotrexate and the effect these factors
have on the development of the MetS. Although significantly
higher levels of folate were seen in the patients receiving meth-
otrexate (P < 0.001), this did not result in significantly lower
levels of homocysteine (P = 0.406). We also failed to demon-
strate any significant impact of folate levels on the develop-
ment of the MetS in a binary logistic model (unadjusted OR =
1.006, 95% CI = 0.996 to 1.02, P = 0.247, adjusted for age,
sex, HAQ OR = 1.005, 95% CI = 0.996 to 1.02, P = 0.281).
Thus, although this mechanism is still plausible it is not sup-
ported by the findings of this study. All of the possible under-
lying mechanisms of action require further investigation in
studies designed specifically for the purpose. However, it
remains that the observation described in this study may be
important in the clinical context. Methotrexate may be the most
appropriate first-line DMARD therapy for RA patients at partic-
ular risk of developing the metabolic syndrome, such as the
elderly and obese with severe, active RA of relatively short
duration.
The association between methotrexate use and the MetS car-
ries further complexities. A strongly significant negative asso-
ciation is apparent with all but the WHO definition. This
phenomenon may be explained by differences in the compo-
nents and cut-off values used in the definitions. The WHO is
the only definition to include albumin/creatinine ratio as a cri-
terion, a factor that was not found to be influenced by meth-
otrexate use. Conversely, it could be explained in differences
in the sensitivity and specificity of each definition. The use of
the NCEP criteria in RA has been questioned over recent
years, because it has been found to confer a low sensitivity for
predicting insulin resistance [54] and may be less strongly
linked to the development of atherosclerosis in RA [28]. Fur-
Figure 2
Frequency of individual components of the metabolic syndrome (NCEP 2004) among patients taking methotrexate and not taking methotrexateFrequency of individual components of the metabolic syndrome (NCEP 2004) among patients taking methotrexate and not taking meth-
otrexate. * P < 0.05. BP = blood pressure; FPGM = fasting plasma glucose > 5.6 mmol/L; HDL = high density lipoproteins; NCEP = National Cho-
lesterol Education programme; TG = triglycerides.
Arthritis Research & Therapy Vol 11 No 4 Toms et al.
Page 8 of 10
(page number not for citation purposes)
ther longitudinal studies are required to confirm or refute these
initial findings.
Over recent years, scepticism has arisen over whether the
MetS is independently associated with CVD [15]. This issue
can only be fully resolved through large-scale prospective tri-
als; however, we attempted to study the association of the
MetS and traditional CVD risk factors with CVD. Following
adjustment for multiple potential confounders in the present
cohort, we found that patients with the MetS had a four-fold
increased risk of having CVD compared with those without
CVD (OR = 4.069, 95% CI = 2.34 to 7.07, P < 0.001). How-
ever, apart from diabetes mellitus (OR = 2.76, 95% CI = 1.12
to 6.83, P = 0.028), all other components of the MetS had a
non-significant association (data not shown).
In addition to the originality of most of the findings, this study
has several other strengths. These include the use of all of the
existing MetS criteria for the first time in RA, in the largest RA
population studied thus far: these data can be used for bench-
marking purposes to compare past or future studies, irrespec-
tive of the MetS criteria they use. Also, the detailed,
prospective data collection minimised selection and recall bias
as well as missing data and allowed meaningful sub-analysis
with corrections for multiple potential confounders. Despite
this, the cross-sectional design is a major limitation and pre-
cludes the ability to prove the causality or directionality of the
associations found. Our study was also limited to secondary
care RA patients from a single geographical location in the UK
and did not assess the MetS in local general population con-
trols, although another study of patients with diabetes from the
geographically neighbouring (6 miles) area of Wolverhampton
suggest that the local population is demographically repre-
sentative of the total UK population [55]. We cannot therefore
claim either that the prevalence of the MetS in patients with RA
is higher than in the general population, or that the results
regarding prevalence of MetS are generalisable to other pop-
ulations. However, the associations found with disease char-
acteristics and medication, are unlikely to be subject to
geographical differences and the impact they may have on
demographics. Although, disease activity was not found to be
an independent predictor for the metabolic syndrome, we felt
this potentially important association warranted further interro-
gation, by comparing patients in remission to those with active
disease. Unfortunately, the sub-analysis had insufficient power
to produce meaningful results. With this in mind we would
encourage further longitudinal studies to confirm the drug-
specific protective effect of methotrexate against the develop-
ment of the MetS in other geographical populations, and also
in subgroups of RA patients according to their disease activity.
Conclusions
The MetS is common among RA patients, and may contribute
significantly to their excess cardiovascular morbidity and mor-
tality. In order to aggressively address this issue and minimise
the associated risk we suggest that the NCEP 2004 criteria
should be used as an annual screening tool in RA patients over
the age of 60 years to identify RA patients with the MetS. Con-
sideration should be given to using methotrexate with folate
supplementation as first-line DMARD therapy in RA patients
deemed to be at the highest risk, such as the elderly with early
severe active disease.
Competing interests
The authors declare that they have no competing interests.
Authors' contributions
TET analysed and interpreted the data and drafted the manu-
script. VFP acquired, analysed and interpreted the data. HJ
drafted the manuscript. KMD acquired the data. GDK made
substantial contributions to the conception and design of the
study and revised the draft manuscript. All authors read and
approved the final manuscript.
Acknowledgements
This work is supported by an Arthritis Research Campaign Clinical Fel-
lowship grant (grant number 18848 to T.E.T), and an Arthritis Research
Campaign infrastructure support grant (grant number 17682, given to
the Dudley Group of Hospitals NHS Foundation Trust, Department of
Rheumatology). Dr Vasileios F. Panoulas is supported by a PhD schol-
arship from Empirikion Institute, Athens, Greece
References
1. Kitas GD, Erb N: Tackling ischaemic heart disease in rheuma-
toid arthritis. Rheumatology 2003, 42:607-613.
2. Van Doornum S, McColl G, Wicks IP: Accelerated atherosclero-
sis: an extraarticular feature of rheumatoid arthritis? Arthritis
Rheum 2002, 46:862-873.
3. Goodson N: Coronary artery disease and rheumatoid arthritis.
Curr opin Rheumatol 2002, 14:115-120.
4. Reilly PA, Cosh JA, Maddison PJ, Rasker JJ, Silman AJ: Mortality
and survival in rheumatoid arthritis: a 25 year prospective
study of 100 patients. Ann Rheum Dis 1990, 49:363-369.
5. Han C, Robinson DWJ, Hackett MV, Paramore LC, Fraeman KH,
Bala MV: Cardiovascuar disease and risk factors in patients
with rheumatoid arthritis, psoriatic arthritis, and ankylosing
spondylitis. J Rheumatol 2006, 33:2167-2172.
6. Panoulas VF, Douglas KM, Millionis HJ, Stavropoulos-Kalinglou A,
nightingale P, Kita MD, Tselios AL, Metsios GS, Elisaf MS, Kitas
GD: Prevalence and associations of hypertension and its con-
trol in patients with rheumatoid arthritis. Rheumatology
(Oxford) 2007, 46:1477-1482.
7. Rall LC, Roubenoff R: Rheumatoid cachexia: metabolic abnor-
malities, mechanisms and interventions. Rheumatology 2004,
43:1219-1223.
8. Stavropoulos-Kalinglou A, Metsios GS, Koutedakis Y, Nevill AM,
Douglas KMJ, Jamurtas A, Veldhuijzen van Zanten JJCS, Labib M,
Kitas GD: Redefining overweight and obesity in rheumatoid
arthritis patients. Ann Rheum Dis 2007, 66:1316-1321.
9. Stavropoulos-Kalinglou A, Metsios GS, Panoulas VF, Douglas KM,
Nevill AM, Jamurtas AZ, Kita M, Koutedakis Y, Kitas GD: Associa-
tions of obesity with modifiable risk factors for the develop-
ment of cardiovascular disease in patients with rheumatoid
arthritis. Ann Rheum Dis 2009, 68:242-245.
10. Gonzalez A, Maradir-Kremers H, Crowson CS, Ballman KV, Roger
VL, Jacobsen SJ, O'Fallon WM, Gabriel SE: Do cardiovascular
risk factors confer the same risk for cardiovascular outcomes
in rheumatoid arthritis patients as in non-rheumatoid arthritis
patients?
Ann Rheum Dis 2008, 67:64-69.
11. Gonzalez-Gay MA, Gonzalez-Juanatey C, Lopez-Diaz MJ, Pineiro
A, Garcia-Porrua C, Miranda-Filloy JA, Ollier WE, Martin J, Llorca J:
HLA-DRB1 and persistent chronic inflammation contribute to
Available online />Page 9 of 10
(page number not for citation purposes)
cardiovascular events and cardiovascular mortality in patients
with rheumatoid arthritis. Arthritis Rheum 2007, 57:125-132.
12. Stevens RJ, Douglas KM, Saeatzis AN, Kitas GD: Inflammation
and atherosclerosis in rheumatoid arthritis. Expert Rev Mol
Med 2005, 7:1-24.
13. Reaven GM: Banting lecture 1988. Role of insulin resistance in
human disease. Diabetes 1988, 37:1595-1607.
14. Reilly MP, Rader DJ: The metabolic syndrome: more than the
sum of its parts? Circulation 2003, 108:1546-1551.
15. Sattar N, McConnachie A, Shaper AG, Blauw GJ, Buckley BM, de
Craen AJ, Ford I, Forouhi NG, Freeman DJ, Jukema JW, Lennon L,
Macfarlane PW, Murphy MB, Packard CJ, Stott DJ, Westendorp
RG, Whinchup PH, Shepherd J, Wannamethee SG: Can meta-
bolic syndrome usefully predict cardiovascular disease and
diabetes? Outcome data from two prospective studies. Lancet
2008, 371:1927-1935.
16. Chung CP, Oeser A, Solus JF, Avalos I, Gebretsadik T, Shintani ,
Raggi P, Sokka T, Pincus T, Stein CM: Prevalence of the meta-
bolic syndrome is increased in rheumatoid arthritis and is
associated with coronary atherosclerosis. Atherosclerosis
2007, 196:756-763.
17. Karvounaris SA, Sidiropoulos PI, Papadakis JA, Spanakis EK, Bert-
sias GK, Ganotakis S, Boumpas DT: Metabolic syndrome is
common amongst middle-to-older aged mediterranean
patients with rheumatoid arthritis and correlates with disease
activity: a retrospective, cross-sectional, controlled study. Ann
Rheum Dis 2007, 66:28-33.
18. Implications of recent clinial trials for the National Cholesterol
Education Programme Adult Treatment Panel III guidelines.
Circulation 2004, 110:227-239.
19. Executive Summary of The Third Report of The National Cho-
lesterol Education Program (NCEP) Expert Panel on Detection,
Evaluation, And Treatment of High Blood Cholesterol In Adults
(Adult Treatment Panel III). JAMA 2001, 285:2486-2497.
20. Alberti KG, Zimmet PZ: Definition, diagnosis and classification
of diabetes mellitus and its complications. Part 1: diagnosis
and classification of diabetes mellitus provisional report of a
WHO consultation. Diabet Med 1998, 15:539-553.
21. Alberti KG, Zimmet P, Shaw J:
The metabolic syndrome – a new
worldwide definition. Lancet 2005, 366:1059-1062.
22. Balkau B, Charles MA: Comment on the provisional report from
the WHO consultation. Diabet Med 1999, 16:442-443.
23. The rising prevalence of diabetes and impaired glucose toler-
ance. The Australian diabetes, obesity and lifestyle study. Dia-
betes Care 2002, 25:829-834.
24. Koehler C, Ott P, Benke I, Hanefeld M, DIG study group: Compar-
ison of the prevalence of the metabolic syndrome by WHO,
AHA/NHLBI and IDF definitions in a German population with
type II diabetes mellitus: The Diabetes In Germany (DIG)
study. Horm Metab Res 2007, 39:632-635.
25. Nilsson PM, Engstrom G, Hedblad B: The metabolic syndrome
and incidence of cardiovascular disease in non-diabetic sub-
jects – a population-based study comparing three different
definitions. Diabet Med 2007, 24:464-472.
26. Qiaa Q, DECODE study group: Comparison of different defini-
tions of the metabolic syndrome in relation to cardiovasculr
mortality in European men and women. Diabetologia 2006,
49:2837-2846.
27. Sandhofer A, Iglseder B, Paulweber B, Ebenbichler CF, Patsch JR:
Comparison of different definitions of the metabolic syn-
drome. Eur J Clin Invest 2007, 37:109-116.
28. Dessein PH, Tobias M, Veller MG: Metabolic syndrome and sub-
clinical atherosclerosis in rheumatoid arthritis. J Rheumatol
2006, 33:2425-2432.
29. Svenson KL, Pollare T, Lithell H, Hallgren R: Impaired glucose
handling in active rheumatoid arthritis: relationship to periph-
eral insulin resistance. Metabolism 1988, 37:125-130.
30. Zonana-Nacach A, Santana-Sahagun E, Jimenez-Balderas FJ,
Camargo-Coronel A: Prevalence and factors associated with
metabolic syndrome in patients with rheumatoid arthritis and
systemic lupus erythematosus. J Clin Rheumatol 2008,
14:74-77.
31. Choi HK, Hernán MA, Seegar JD, Robins JM, Wolfe F: Methotrex-
ate and mortality in patients with rheumatoid arthritis: a pro-
spective study. Lancet 2002, 359:1173-1177.
32. Dessein PH, Joffe BI, Stanwix AE: Effects of disease modifying
agents and dietary intervention on insulin resistance and dys-
lipidemia in inflammatory arthritis – a pilot study. Arthritis Res
2002, 4:R12.
33. Arnett FC, Edworthy SM, Bloch DA, McShane DJ, Fries JF, Cooper
NS, Healey LA, Kaplan SR, Liang MH, Luthra HS: The American
Rheumatism Association 1987 revised criteria for the classifi-
cation of rheumatoid arthritis. Arthritis Rheum 1988,
31:315-324.
34. Panoulas VF, Millionis HJ, Douglas KMJ, nightingale P, Kita MD,
Klocke R, Elisaf MS, Kitas GD: Association of serum uric acid
with cardiovascular disease in rhuemtoid arthritis. Rheumatol-
ogy 2007, 46:1466-1470.
35. Prevoo ML, 't Hof MA, Kuper HH, van Leeuwen MA, Putte LB van
de, van Riel PL: Modified disease activity scores that include
twenty-eight-joint counts. Development and validation in a
prospective longitudinal study of patients with rheumatoid
arthritis. Arthritis Rheum 1995, 38:44-48.
36. Kirwan JR, Reeback JS: Stanford Health Assessment Question-
naire modified to assess disability in British patients with
rheumatoid arthritis. Br J Rheumatol 1986, 25:206-209.
37. Matthews DR, Hosker JP, Rudenski AS, Naylor BA, Treacher DF,
Turner RC: Homeostasis model assessment: insulin resist-
ance and beta-cell function from fasting plasma glucose and
insulin concentrations in man. Diabetologia 1985, 28:412-419.
38. Katz A, Nambi SS, Mather K, Baron AD, Follmann DA, Sullivan G,
Quon MJ: Quantitative insulin sensitivity check index: a simple,
accurate method for assessing insulin sensitivity in humans. J
Clin Endocrinol Metab 2000, 85:2402-2410.
39. Traynor J, Mactier R, Geddes CC, Fox JG: How to measure renal
function in clinical practice. BMJ 2006, 333:733-737.
40. Ford ES, Giles WH, Dietz WH: Prevalence of the metabolic syn-
drome among US adults: findings from the third National
Health and Nutrition Examination Survey. JAMA 2002,
287:356-359.
41. Alexander CM, Landsman PB, Grundy SM: The influence of age
and body mass index on the metabolic syndrome and its com-
ponents. Diabetes Obes Metab 2008, 10:246-250.
42. Kelley GA, Kelley KS: Aerobic exercise and lipids and lipopro-
teins in men: a meta-analysis of randomized controlled trials.
J Mens Health Gend
2006, 3:61-70.
43. Metsios GS, Stavropoulos-Kalinglou A, Panoulas VF, Wilson M,
Nevill AM, Koutedakis Y, Kitas GD: Association of physical inac-
tivity with increased cardiovascular risk in patients with rheu-
matoid arthritis. Eur J Cardiovasc Prev Rehabil 2009,
16:188-194.
44. Toms TE, Panoulas VF, Douglas KM, Griffiths HR, Kitas GD: Lack
of association between glucocorticoid use and presence of
the metabolic syndrome with rheumatoid arthritis: a cross-
sectional study. Arthritis Res Ther 2008, 10:R145.
45. Choi HK, Seeger JD: Lipid profiles among US elderly with
untreated rheumatoid arthritis – the Third National Health and
Nutrition Examination Survey. J Rheumatol 2005,
32:2311-2316.
46. Park YB, Lee SK, Lee WK, Suh CH, Lee CW, Lee CH, Song CH,
Lee J: Lipid profiles in untreated patients with rheumatoid
arthritis. J Rheumatol 1999, 26:1701-1704.
47. Montensinos MC, Desai A, Delano D, Chen JF, Fink JS, Jacobson
MA: Adenosine A2A or A3 receptors are required for inhibition
of inflammation by methotrexate and its analog MX-68. Arthri-
tis Rheum 2003, 48:240-247.
48. Tian H, Cronstein BN: Understanding the mechanisms of action
of methotrexate: implications for the treatment of rheumatoid
arthritis. Bull N Y Hosp Jt Dis. 2007, 65:168-173.
49. Joost HG, Steinfelder HJ: Modulation of insulin sensitivity by
adenosine. Effects on glucose transport, lipid synthesis, and
insulin receptors of the adipocyte. Molecular Pharmacol. 1982,
22:614-618.
50. Reiss AB, Carsons SE, Anwar K, Rao S, Edelman SD, Hongwie Z,
Fernandez P, Cronstein BN, Chan ESL: Atheroprotective effects
of methotrexate on reverse cholesterol transport proteins and
foam cell transformation in human THP-1 monocyte/macro-
phages. Arthritis Rheum 2008, 58:3675-3683.
51. The heart outcomes prevention evaluation (HOPE) 2 investi-
gators: Homocystein lowering with folic acid and B vitamins in
vascular disease. N Engl J Med 2006, 354:1567-1577.
52. Hajer GR, Graaf Y Van der, Olijhoek JK, Verhaar MC, Visseren FLJ:
Levels of homocysteine are increased in metabolic syndrome
patients but are not associated with an increased cardiovascu-
Arthritis Research & Therapy Vol 11 No 4 Toms et al.
Page 10 of 10
(page number not for citation purposes)
lar risk, in contrast to patients without the metabolic syn-
drome. Heart 2007, 93:216-220.
53. Setola E, Monti LD, Galluccio E, Palloshi A, Fragasso G, Paroni R,
Magni F, Sandoli EP, Lucotti P, Costa S, Fermo I, Galli-Kienle M,
Origgi A, Margonato A, Piatti P: Insulin resistance and endothe-
lial function are improved after folate and vitamin B12 therapy
in patients with the metabolic syndrome:relationship between
homocysteine levels and hyperinsulinaemia. Eur J Endocrinol.
2004, 151:483-489.
54. Dessein JH, Joffe BI, Stanwix AE: Should we evaluate insulin
sensitivity in rheumatoid arthritis? Semin Arthritis Rheum
2005, 35:5-7.
55. Baskar V, Kamalakannan D, Holland MR, Singh BM: Hypertension
in diabetes: is there a place for age-adjusted centre cut-offs in
those aged < 50 years? QJM. 2004, 97:747-753.