Insulin Action and Its Disturbances in Disease - part 4 pdf
Bạn đang xem bản rút gọn của tài liệu. Xem và tải ngay bản đầy đủ của tài liệu tại đây (704.67 KB, 62 trang )
170 INSULIN RESISTANCE IN GLUCOSE DISPOSAL AND PRODUCTION IN MAN
different approach Lewis et al.
90
also found evidence of resistance to the direct
suppressive effect of insulin on hepatic glucose production in T2D. In addi-
tion, we found that suppression of both plasma FFA and glucagon levels were
markedly impaired in T2D (Figure 6.3).
41
This may reflect impaired insulin-
mediated suppression of lipolysis in adipocytes and impaired suppression of
glucagon secretion from the α-cells. Since elevated FFA levels per se have
been shown to stimulate both glycogenolysis as well as gluconeogenesis,
91, 92
impaired insulin-mediated suppression of FFA may obviously influence hepatic
insulin sensitivity. Similarly, because hepatic glucagon sensitivity is normal in
T2D,
93, 94
impaired insulin-mediated suppression of glucagon secretion may also
influence hepatic insulin sensitivity.
95
Using the tracer technique in combina-
tion with the
2
H
2
O technique, Gastaldelli et al. have quantitated gluconeogenesis
in obesity and in T2D. In obese subjects, the gluconeogenic rate was directly
related to the degree of obesity,
96
and in clamp studies of type 2 diabetic sub-
jects gluconeogenic fluxes were elevated in the basal state and suppression in
response to insulin was markedly impaired during the clamp.
97
Thus, from in vivo studies, there is evidence of hepatic insulin resistance both
in the direct and in the indirect actions (through FFA and glucagon), and both
in the glycogenolytic and in the gluconeogenic pathways.
Biochemical defects in hepatic insulin action
Control of hepatic glucose output may occur through regulation of gluconeo-
genesis or glycogenolysis. However, glucose-6-phosphatase [G6Pase] and glu-
cokinase [GK] are believed to play prominent roles in the regulation of glucose
production by controlling the rate of glucose efflux and uptake in hepatocytes.
The competing activity between the two enzymes has been described as the
glucose cycle and represents an important potential site of regulation.
98
Glucose
cycling has been found to be increased in mild T2D.
98
Insulin sensitivity of the
glucose cycle is reduced in obese non-diabetic and more so in obese type 2 dia-
betic patients,
99
suggesting that G6Pase activity is increased in both groups.
99
This increased activity may be secondary to a decreased insulin-induced sup-
pression of the enzyme activity at the level of the liver cell. Alternatively, it
may possibly be secondary to the increased peripheral lipolysis and enhanced
plasma FFA concentrations, since chronically elevated plasma FFAs have been
shown to enhance liver G6Pase gene expression.
100
Moreover, in liver biopsies
from type 2 diabetic patients, G6Pase activity has been found to be increased
101
and GK activity to be reduced.
101, 102
Increased hepatic VLDL production
Another important aspect of hepatic insulin resistance is an atherogenic dys-
lipidaemia profile characterized by hypertriglyceridaemia, low plasma HDL-
cholesterol and raised small dense LDL-cholesterol profile. The physiologic
CONCLUSION AND PERSPECTIVES 171
basis for this metabolic dyslipidaemia appears to be hepatic overproduction of
apoB-containing VLDL particles, which may result from a composite set of fac-
tors including increased flux of FFAs from adipose tissue to the liver and directly
from lipoprotein remnant uptake, increased de novo fatty acid synthesis, pref-
erential esterification versus oxidation of fatty acids, reduced post-translational
degradation of apo-B and overexpression of microsomal triglyceride transfer
protein (MTP).
103, 104
These conditions, together with resistance to the normal
suppressive effect of insulin on VLDL secretion, act in concert to channel fatty
acids into secretory and storage rather than degradative pathways.
105, 106
Primary/genetic defects in insulin action in liver
Whether hepatic insulin resistance is a primary trait or a secondary phenomenon
is as yet undetermined. However, if hepatic insulin resistance is a secondary phe-
nomenon it may be reversible. Given the serious consequences of hepatic insulin
resistance, both for glucose metabolism and, in particular, for development of
dyslipidaemia, the answer to this question and possible rational treatments might
be quite important.
6.4 Conclusion and perspectives
Insulin resistance in glucose disposal and production seems to play an important
role for the development of the metabolic syndrome and T2D. Both diseases dis-
pose to cardiovascular disease and cardiovascular mortality. Therefore, insulin
resistance may be considered as a serious risk factor in the modern society,
and because insulin resistance is in itself symptomless it has been named ‘the
secret killer’.
In this short description of insulin resistance, and glucose disposal and hep-
atic glucose production, we have focused on various aspects of methodologies
to measure insulin resistance, in order to alert researchers and clinicians to the
importance of accurate diagnosis of insulin resistance. We have also focused
on the potential cellular mechanisms that could explain the development of
insulin resistance. In skeletal muscle, insulin-mediated glucose disposal is clearly
dependent on glycogen synthesis. This pathway is impaired, due to hyperphos-
phorylation of the key enzyme, glycogen synthase. Therefore, regulation of
glycogen synthase activity may be central to our understanding of insulin resis-
tance in the metabolic syndrome and T2D. We believe that obesity is linked to
insulin resistance, metabolic syndrome and T2D, through the accumulation of
lipids, particularly long chain acylCoAs in the skeletal muscle, and that these
intracellular fatty acids and triglycerides may directly inhibit the dephosphory-
lation of glycogen synthase and thereby impair glucose disposal.
Thus, future studies will need to examine the relationship between intramy-
ofibril lipid accumulation, skeletal muscle glycogen synthase activity and GLUT4
172 INSULIN RESISTANCE IN GLUCOSE DISPOSAL AND PRODUCTION IN MAN
translocation. Although hepatic insulin resistance may play only a minor role in
the development of the metabolic syndrome per se, the role of the liver in the
dyslipidaemia of the syndrome is important. Also, the altered peripheral regu-
lation of FFAs and their effect on hepatic glyconeogenesis and glycogenolysis
is a critical factor in the dysregulation of glucose metabolism in the metabolic
syndrome. These latter observations also highlight the importance of a direct
effect of peripheral insulin resistance on hepatic glucose production and hepatic
insulin resistance.
Finally, as mentioned, the increased secretion of lipoproteins from the liver
represents a vital link between hepatic insulin resistance and the arteriosclerosis
and cardiovascular diseases of the metabolic syndrome. Therefore, the relation-
ship between insulin resistance in the liver and lipoprotein turnover remains an
important area of future research.
References
1. Freychet, P., Roth, J. and Neville, D. M., Jr. (1971) Insulin receptors in the liver: spe-
cific binding of (125 I) insulin to the plasma membrane and its relation to insulin
bioactivity. Proc Natl Acad Sci USA 68, 1833–1837.
2. Himsworth, H. P. and Kerr, R. B. (1939) Insulin-sensitive and insulin insensitive types
of diabetes mellitus. Clin Sci 4, 119–152.
3. Yalow, R. S. and Berson, S. A. (1960) Plasma insulin concentrations in nondiabetic
and early diabetic subjects. Determinations by a new sensitive immuno-assay technic.
Diabetes 9, 254–260.
4. Ferrannini, E. (1998) Insulin resistance versus insulin deficiency in non-insulin-
dependent diabetes mellitus: problems and prospects. Endocr Rev 19, 477–490.
5. Beck-Nielsen, H. and Groop, L. C. (1994) Metabolic and genetic characterization of
prediabetic states. Sequence of events leading to non-insulin-dependent diabetes melli-
tus. J Clin Invest 94, 1714–1721.
6. Matthaei, S., Stumvoll, M., Kellerer, M. and Haring, H. U. (2000) Pathophysiology and
pharmacological treatment of insulin resistance. Endocr Rev 21, 585–618.
7. Reaven, G. M. (1995) Pathophysiology of insulin resistance in human disease. Physiol
Rev 75, 473–486.
8. Radziuk, J. (2000) Insulin sensitivity and its measurement: structural commonalities
among the methods. J Clin Endocrinol Metab 85, 4426–4433.
9. Wallace, T. M. and Matthews, D. R. (2002) The assessment of insulin resistance in
man. Diabet Med 19, 527–534.
10. Bergman, R. N., Finegood, D. T. and Ader, M. (1985) Assessment of insulin sensitivity
in vivo. Endocr Rev 6, 45–86.
11. Best, J. D., Kahn, S. E., Ader, M., Watanabe, R. M., Ni, T. C. and Bergman, R. N.
(1996) Role of glucose effectiveness in the determination of glucose tolerance. Diabetes
Care 19, 1018–1030.
12. Kahn, S. E., Prigeon, R. L., McCulloch, D. K., Boyko, E. J., Bergman, R. N.,
Schwartz, M. W., Neifing, J. L., Ward, W. K., Beard, J. C. and Palmer, J. P., et al.
(1993) Quantification of the relationship between insulin sensitivity and beta-cell func-
tion in human subjects. Evidence for a hyperbolic function. Diabetes 42, 1663–1672.
13. Matthews, D. R., Hosker, J. P., Rudenski, A. S., Naylor, B. A., Treacher, D. F. and
Turner, R. C. (1985) Homeostasis model assessment: insulin resistance and beta-cell
REFERENCES 173
function from fasting plasma glucose and insulin concentrations in man. Diabetologia
28, 412–419.
14. Katz, A., Nambi, S. S., Mather, K., Baron, A. D., Follmann, D. A., Sullivan, G. and
Quon, M. J. (2000) Quantitative insulin sensitivity check index: a simple, accurate
method for assessing insulin sensitivity in humans. J Clin Endocrinol Metab 85,
2402–2410.
15. DeFronzo, R. A., Tobin, J. D. and Andres, R. (1979) Glucose clamp technique: a
method for quantifying insulin secretion and resistance. Am J Physiol 237, E214–E223.
16. Hother-Nielsen, O., Henriksen, J. E., Holst, J. J. and Beck Nielsen, H. (1996) Effects
of insulin on glucose turnover rates in vivo: isotope dilution versus constant specific
activity technique. Metabolism 45, 82–91.
17. Scheen, A. J., Paquot, N., Castillo, M. J. and Lefebvre, P. J. (1994) How to measure
insulin action in vivo. Diabetes Metab Rev 10, 151–188.
18. Landau, B. R., Wahren, J., Chandramouli, V., Schumann, W. C., Ekberg, K. and
Kalhan, S. C. (1996) Contributions of gluconeogenesis to glucose production in the
fasted state. J Clin Invest 98, 378–385.
19. Chandramouli, V., Ekberg, K., Schumann, W. C., Kalhan, S. C., Wahren, J. and
Landau, B. R. (1997) Quantifying gluconeogenesis during fasting. Am J Physiol 273,
E1209–E1215.
20. Ferrannini, E. (1988) The theoretical bases of indirect calorimetry: a review. Metabolism
37, 287–301.
21. Kelley, D. E. and Mandarino, L. J. (2000) Fuel selection in human skeletal muscle in
insulin resistance: a reexamination. Diabetes 49, 677–683.
22. Rossetti, L. and Giaccari, A. (1990) Relative contribution of glycogen synthesis and
glycolysis to insulin-mediated glucose uptake. A dose–response euglycemic clamp
study in normal and diabetic rats. J Clin Invest 85, 1785–1792.
23. Blaak, E. E., Wagenmakers, A. J., Glatz, J. F., Wolffenbuttel, B. H., Kemerink, G. J.,
Langenberg, C. J., Heidendal, G. A. and Saris, W. H. (2000) Plasma FFA utilization
and fatty acid-binding protein content are diminished in type 2 diabetic muscle. Am J
Physiol Endocrinol Metab 279, E146–E154.
24. Christopher, M. J., Rantzau, C., Ward, G. M. and Alford, F. P. (1994) Impact of vari-
able insulinemia and glycemia on in vivo glycolysis and glucose storage in dogs. Am
J Physiol 266, E62–71.
25. Rossetti, L., Lee, Y. T., Ruiz, J., Aldridge, S. C., Shamoon, H. and Boden, G. (1993)
Quantitation of glycolysis and skeletal muscle glycogen synthesis in humans. Am J
Physiol 265, E761–E769.
26. Del Prato, S., Bonadonna, R. C., Bonora, E., Gulli, G., Solini, A., Shank, M. and
DeFronzo, R. A. (1993) Characterization of cellular defects of insulin action in type 2
(non-insulin-dependent) diabetes mellitus. J Clin Invest 91, 484–494.
27. Vaag, A., Alford, F., Henriksen, F. L., Christopher, M. and Beck Nielsen, H. (1995)
Multiple defects of both hepatic and peripheral intracellular glucose processing con-
tribute to the hyperglycaemia of NIDDM. Diabetologia 38, 326–336.
28. Bergman, R. N., Ider, Y. Z., Bowden, C. R. and Cobelli, C. (1979) Quantitative esti-
mation of insulin sensitivity. Am J Physiol 236, E667–E677.
29. Weber, K. M., Martin, I. K., Best, J. D., Alford, F. P. and Boston, R. C. (1989) Alter-
native method for minimal model analysis of intravenous glucose tolerance data. Am J
Physiol 256, E524–E535.
30. Finegood, D. T. and Tzur, D. (1996) Reduced glucose effectiveness associated with
reduced insulin release: an artifact of the minimal-model method. Am J Physiol 271,
E485–E495.
174 INSULIN RESISTANCE IN GLUCOSE DISPOSAL AND PRODUCTION IN MAN
31. Vicini, P., Caumo, A. and Cobelli, C. (1997) The hot IVGTT two-compartment minimal
model: indexes of glucose effectiveness and insulin sensitivity. Am J Physiol 273,
E1024–E1032.
32. Bergman, R. N., Prager, R., Volund, A. and Olefsky, J. M. (1987) Equivalence of the
insulin sensitivity index in man derived by the minimal model method and the eug-
lycemic glucose clamp. J Clin Invest 79, 790–800.
33. Henriksen, J. E., Alford, F., Handberg, A., Vaag, A. and Beck Nielsen, H. (1996) Glu-
cose processing during the intravenous glucose tolerance test. Metabolism 45, 598–605.
34. Ward, G. M., Walters, J. M., Barton, J., Alford, F. P. and Boston, R. C. (2001) Phys-
iologic modeling of the intravenous glucose tolerance test in type 2 diabetes: a new
approach to the insulin compartment. Metabolism 50, 512–519.
35. Ward,G.M., Weber,K.M., Walters,I.M., Aitken,P.M., Lee,B., Best,J.D.,
Boston, R. C. and Alford, F. P. (1991) A modified minimal model analysis of
insulin sensitivity and glucose-mediated glucose disposal in insulin-dependent diabetes.
Metabolism 40, 4–9.
36. Henriksen, J. E., Alford, F., Handberg, A., Vaag, A., Ward, G. M., Kalfas, A. and
Beck-Nielsen, H. (1994) Increased glucose effectiveness in normoglycemic but insulin-
resistant relatives of patients with non-insulin-dependent diabetes mellitus. A novel
compensatory mechanism. J Clin Invest 94, 1196–1204.
37. Martin, B. C., Warram, J. H., Krolewski, A. S., Bergman, R. N., Soeldner, J. S. and
Kahn, C. R. (1992) Role of glucose and insulin resistance in development of type
2 diabetes mellitus: results of a 25-year follow-up study. Lancet 340, 925–929.
38. Galvin, P., Ward, G., Walters, J., Pestell, R., Koschmann, M., Vaag, A., Martin, I.,
Best, J. D. and Alford, F. (1992) A simple method for quantitation of insulin sensitivity
and insulin release from an intravenous glucose tolerance test. Diabet Med 9, 921–928.
39. Anderson, R. L., Hamman, R. F., Savage, P. J., Saad, M. F., Laws, A., Kades, W. W.,
Sands, R. E. and Cefalu, W. (1995) Exploration of simple insulin sensitivity measures
derived from frequently sampled intravenous glucose tolerance (FSIGT) tests. The
Insulin Resistance Atherosclerosis Study. Am J Epidemiol 142, 724–732.
40. Alberti, K. G. and Zimmet, P. Z. (1998) Definition, diagnosis and classification of dia-
betes mellitus and its complications. Part 1: diagnosis and classification of diabetes
mellitus provisional report of a WHO consultation [see comments]. Diabet Med 15,
539–553.
41. Staehr, P., Hother-Nielsen, O., Levin, K., Holst, J. J. and Beck-Nielsen, H. (2001)
Assessment of hepatic insulin action in obese type 2 diabetic patients. Diabetes 50,
1363–1370.
42. Shulman, G. I., Rothman, D. L., Jue, T., Stein, P., DeFronzo, R. A. and Shul-
man, R. G. (1990) Quantitation of muscle glycogen synthesis in normal subjects and
subjects with non-insulin-dependent diabetes by 13C nuclear magnetic resonance spec-
troscopy. N Engl J Med 322, 223–228.
43. DeFronzo, R. A., Jacot, E., Jequier, E., Maeder, E., Wahren, J. and Felber, J. P. (1981)
The effect of insulin on the disposal of intravenous glucose. Results from indirect
calorimetry and hepatic and femoral venous catheterization. Diabetes 30, 1000–1007.
44. Thiebaud, D., Jacot, E., DeFronzo, R. A., Maeder, E., Jequier, E. and Felber, J. P.
(1982) The effect of graded doses of insulin on total glucose uptake, glucose oxidation,
and glucose storage in man. Diabetes 31, 957–963.
45. Mandarino, L. J., Wright, K. S., Verity, L. S., Nichols, J., Bell, J. M., Kolter-
man, O. G. and Beck-Nielsen, H. (1987) Effects of insulin infusion on human skeletal
muscle pyruvate dehydrogenase, phosphofructokinase, and glycogen synthase. Evidence
for their role in oxidative and nonoxidative glucose metabolism. J Clin Invest 80,
655–663.
REFERENCES 175
46. Young, A. A., Bogardus, C., Wolfe Lopez, D. and Mott, D. M. (1988) Muscle glycogen
synthesis and disposition of infused glucose in humans with reduced rates of insulin-
mediated carbohydrate storage. Diabetes 37, 303–308.
47. Thorburn, A. W., Gumbiner, B., Brechtel, G. and Henry, R. R. (1990) Effect of hyper-
insulinemia and hyperglycemia on intracellular glucose and fat metabolism in healthy
subjects. Diabetes 39, 22–30.
48. Yki-Jarvinen, H., Bogardus, C. and Howard, B. V. (1987) Hyperglycemia stimulates
carbohydrate oxidation in humans. Am J Physiol 253, E376–E382.
49. Levin, K., Daa, S. H., Alford, F. P. and Beck-Nielsen, H. (2001) Morphometric doc-
umentation of abnormal intramyocellular fat storage and reduced glycogen in obese
patients with Type II diabetes. Diabetologia 44, 824–833.
50. Damsbo, P., Vaag, A., Hother-Nielsen, O. and Beck-Nielsen, H. (1991) Reduced glyco-
gen synthase activity in skeletal muscle from obese patients with and without type 2
(non-insulin-dependent) diabetes mellitus. Diabetologia 34, 239–245.
51. Højlund, K., Staehr, P., Hansen, B. F., Green, K. A., Hardie, D. G., Richter, E. A.,
Beck-Nielsen, H. and Wojtaszewski, J. F. (2003) Increased phosphorylation of skeletal
muscle glycogen synthase at NH2-terminal sites during physiological hyperinsulinemia
in type 2 diabetes. Diabetes 52, 1393–1402.
52. Vaag, A., Alford, F. and Beck-Nielsen, H. (1996) Intracellular glucose and fat
metabolism in identical twins discordant for non-insulin-dependent diabetes mellitus
(NIDDM): acquired versus genetic metabolic defects? Diabet Med 13, 806–815.
53. Golay, A., DeFronzo, R. A., Ferrannini, E., Simonson, D. C., Thorin, D., Acheson, K.,
Thiebaud, D., Curchod, B., Jequier, E. and Felber, J. P. (1988) Oxidative and non-
oxidative glucose metabolism in non-obese type 2 (non-insulin-dependent) diabetic
patients. Diabetologia 31, 585–591.
54. Groop, L. C., Bonadonna, R. C., DelPrato, S., Ratheiser, K., Zyck, K., Ferrannini, E.
and DeFronzo, R. A. (1989) Glucose and free fatty acid metabolism in non-insulin-
dependent diabetes mellitus. Evidence for multiple sites of insulin resistance. J Clin
Invest 84, 205–213.
55. Felber, J. P., Golay, A., Felley, C. and Jequier, E. (1988) Regulation of glucose storage
in obesity and diabetes: metabolic aspects. Diabetes Metab Rev 4, 691–700.
56. Thorburn, A. W., Gumbiner, B., Bulacan, F., Wallace, P. and Henry, R. R. (1990)
Intracellular glucose oxidation and glycogen synthase activity are reduced in non-
insulin-dependent (type II) diabetes independent of impaired glucose uptake. J Clin
Invest 85, 522–529.
57. Randle, P. J., Garland, P. B., Hales, C. N. and Newsholme, E. A. (1963) The glucose
fatty-acid cycle. Its role in insulin sensitivity and the metabolic disturbances of diabetes
mellitus. Lancet 1, 785–789.
58. Boden, G., Jadali, F., White, J., Liang, Y., Mozzoli, M., Chen, X., Coleman, E. and
Smith, C. (1991) Effects of fat on insulin-stimulated carbohydrate metabolism in normal
men. J Clin Invest 88, 960–966.
59. Roden, M., Price, T. B., Perseghin, G., Petersen, K. F., Rothman, D. L., Cline, G. W.
and Shulman, G. I. (1996) Mechanism of free fatty acid-induced insulin resistance in
humans. J Clin Invest 97, 2859–2865.
60. Kelley, D. E., Mokan, M., Simoneau, J. A. and Mandarino, L. J. (1993) Interaction
between glucose and free fatty acid metabolism in human skeletal muscle. J Clin Invest
92, 91–98.
61. Andres, R., Cadar, G. and Zierler, K. (1956) The quantitative minor role of oxida-
tive metabolism by skeletal muscle in intact man in the basal state. J Clin Invest 35,
671–682.
176 INSULIN RESISTANCE IN GLUCOSE DISPOSAL AND PRODUCTION IN MAN
62. Colberg, S. R., Simoneau, J. A., Thaete, F. L. and Kelley, D. E. (1995) Skeletal muscle
utilization of free fatty acids in women with visceral obesity [see comments]. J Clin
Invest 95, 1846–1853.
63. Kelley, D. E., Goodpaster, B., Wing, R. R. and Simoneau, J. A. (1999) Skeletal muscle
fatty acid metabolism in association with insulin resistance, obesity, and weight loss.
Am J Physiol 277, E1130–E1141.
64. Kelley, D. E. and Simoneau, J. A. (1994) Impaired free fatty acid utilization by skeletal
muscle in non-insulin-dependent diabetes mellitus. J Clin Invest 94, 2349–2356.
65. Shulman, G. I. (2000) Cellular mechanisms of insulin resistance. J Clin Invest 106,
171–176.
66. Zierath, J. R., Krook, A. and Wallberg-Henriksson, H. (2000) Insulin action and insulin
resistance in human skeletal muscle. Diabetologia 43, 821–835.
67. Lund, S., Pedersen, O., Holman, G. D., Clark, A. E., Zierath, J. R. and Wallberg-
Henriksson, H. (1997) GLUT4 translocation in human muscle strips. Biochem Soc Trans
25, 466S.
68. Dresner, A., Laurent, D., Marcucci, M., Griffin, M. E., Dufour, S., Cline, G. W.,
Slezak, L. A., Andersen, D. K., Hundal, R. S., Rothman, D. L., Petersen, K. F. and
Shulman, G. I. (1999) Effects of free fatty acids on glucose transport and IRS-1-
associated phosphatidylinositol 3-kinase activity. J Clin Invest 103, 253–259.
69. Krook, A., Bjornholm, M., Galuska, D., Jiang, X. J., Fahlman, R., Myers, M. G.,
Jr., Wallberg-Henriksson, H. and Zierath, J. R. (2000) Characterization of signal
transduction and glucose transport in skeletal muscle from type 2 diabetic patients.
Diabetes 49, 284–292.
70. Meyer, M. M., Levin, K., Grimmsmann, T., Beck-Nielsen, H. and Klein, H. H. (2002)
Insulin signalling in human skeletal muscle of subjects with or without Type II-diabetes
and first degree relatives of patients with the disease. Diabetologia 45, 813–822.
71. Grimmsmann, T., Levin, K., Meyer, M. M., Beck-Nielsen, H. and Klein, H. H. (2002)
Delays in insulin signaling towards glucose disposal in human skeletal muscle. J
Endocrinol 172, 645–651.
72. Krook, A., Roth, R. A., Jiang, X. J., Zierath, J. R. and Wallberg-Henriksson, H. (1998)
Insulin-stimulated Akt kinase activity is reduced in skeletal muscle from NIDDM sub-
jects. Diabetes 47, 1281–1286.
73. Gaster, M., Staehr, P., Beck-Nielsen, H., Schroder, H. D. and Handberg, A. (2001)
GLUT4 is reduced in slow muscle fibers of type 2 diabetic patients: is insulin resistance
in type 2 diabetes a slow, type 1 fiber disease? Diabetes 50, 1324–1329.
74. Gaster, M., Petersen, I., Hojlund, K., Poulsen, P. and Beck-Nielsen, H. (2002) The dia-
betic phenotype is conserved in myotubes established from diabetic subjects: evidence
for primary defects in glucose transport and glycogen synthase activity. Diabetes 51,
921–927.
75. Hother-Nielsen, O. and Beck-Nielsen, H. (1990) On the determination of basal glucose
production rate in patients with type 2 (non-insulin-dependent) diabetes mellitus using
primed-continuous 3-3H-glucose infusion. Diabetologia 33, 603–610.
76. Hother-Nielsen, O. (1996) Constant tracer infusion technique for assessment of glucose
turnover in vivo: current status. In: Marshall SM, Home PD, Rizza RA, eds. Diabetes
Annual/10. Amsterdam: Elsevier, 301–336.
77. Radziuk, J. and Pye, S. (2002) Quantitation of basal endogenous glucose production in
Type II diabetes: importance of the volume of distribution. Diabetologia 45, 1053–1084.
78. Hother-Nielsen, O. and Beck-Nielsen, H. (1991) Insulin resistance, but normal basal
rates of glucose production in patients with newly diagnosed mild diabetes mellitus.
Acta Endocrinol Copenh 124, 637–645.
REFERENCES 177
79. Hother-Nielsen, O. and Beck-Nielsen, H. (1991) Basal glucose metabolism in type 2
diabetes. A critical review. Diabet Metab 17, 136–145.
80. Rigalleau, V., Beylot, M., Laville, M., Guillot, C., Deleris, G., Aubertin, J. and Gin, H.
(1996) Measurement of post-absorptive glucose kinetics in non-insulin-dependent dia-
betic patients: methodological aspects. Eur J Clin Invest 26, 231–236.
81. Beck-Nielsen, H., Hother-Nielsen, O., Vaag, A. and Alford, F. (1994) Pathogenesis of
type 2 (non-insulin-dependent) diabetes mellitus: the role of skeletal muscle glucose
uptake and hepatic glucose production in the development of hyperglycaemia. A critical
comment. Diabetologia 37, 217–221.
82. Beck-Nielsen, H., Hother-Nielsen, O. and Staehr, P. (2002) Is hepatic glucose produc-
tion increased in Type 2 diabetes mellitus? Curr Diabetes Rep 2 (3), 231–236.
83. Vranic, M. (1992) Banting Lecture: Glucose turnover. A key to understanding the patho-
genesis of diabetes (indirect effects of insulin). Diabetes 41, 1188–1206.
84. Giacca, A., Fisher, S. J., Shi, Z. Q., Gupta, R., Lickley, H. L. and Vranic, M. (1992)
Importance of peripheral insulin levels for insulin-induced suppression of glucose pro-
duction in depancreatized dogs. J Clin Invest 90, 1769–1777.
85. Cherrington, A. D., Edgerton, D. and Sindelar, D. K. (1998) The direct and indirect
effects of insulin on hepatic glucose production in vivo. Diabetologia 41, 987–996.
86. Cherrington, A. D. (1999) Banting Lecture 1997. Control of glucose uptake and release
by the liver in vivo. Diabetes 48, 1198–1214.
87. Hother-Nielsen, O., Henriksen, J. E., Staehr, P. and Beck-Nielsen, H. (1995) Labelled
glucose infusate technique in clamp studies. Is precise matching of glucose specific
activity important? Endocrinol Metab 2, 275–287.
88. Turk, D., Alzaid, A., Dinneen, S., Nair, K. S. and Rizza, R. (1995) The effects of non-
insulin-dependent diabetes mellitus on the kinetics of onset of insulin action in hepatic
and extrahepatic tissues. J Clin Invest 95, 755–762.
89. Edgerton, D. S., Cardin, S., Emshwiller, M., Neal, D., Chandramouli, V., Schu-
mann, W. C., Landau, B. R., Rossetti, L. and Cherrington, A. D. (2001) Small
increases in insulin inhibit hepatic glucose production solely caused by an effect on
glycogen metabolism. Diabetes 50, 1872–1882.
90. Lewis, G. F., Carpentier, A., Vranic, M. and Giacca, A. (1999) Resistance to insulin’s
acute direct hepatic effect in suppressing steady-state glucose production in individuals
with type 2 diabetes. Diabetes 48, 570–576.
91. Staehr, P., Hother-Nielsen, O., Landau, B. R., Chandramouli, V., Holst, J. J. and Beck-
Nielsen, H. (2003) Effects of free fatty acids per se on glucose production, gluconeo-
genesis, and glycogenolysis. Diabetes 52, 260–267.
92. Boden, G., Cheung, P., Stein, T. P., Kresge, K. and Mozzoli, M. (2002) FFA cause
hepatic insulin resistance by inhibiting insulin suppression of glycogenolysis. Am J
Physiol Endocrinol Metab 283, E12–E19.
93. Matsuda, M., DeFronzo, R. A., Glass, L., Consoli, A., Giordano, M., Bressler, P. and
DelPrato, S. (2002) Glucagon dose–response curve for hepatic glucose production and
glucose disposal in type 2 diabetic patients and normal individuals. Metabolism 51,
1111–1119.
94. Nielsen, M. F., Wise, S., Dinneen, S. F., Schwenk, W. F., Basu, A. and Rizza, R. A.
(1997) Assessment of hepatic sensitivity to glucagon in NIDDM: use as a tool to esti-
mate the contribution of the indirect pathway to nocturnal glycogen synthesis. Diabetes
46, 2007–2016.
95. Shah, P., Vella, A., Basu, A., Basu, R., Schwenk, W. F. and Rizza, R. A. (2000) Lack
of suppression of glucagon contributes to postprandial hyperglycemia in subjects with
type 2 diabetes mellitus. J Clin Endocrinol Metab 85, 4053–4059.
178 INSULIN RESISTANCE IN GLUCOSE DISPOSAL AND PRODUCTION IN MAN
96. Gastaldelli, A., Baldi, S., Pettiti, M., Toschi, E., Camastra, S., Natali, A., Landau, B. R.
and Ferrannini, E. (2000) Influence of obesity and type 2 diabetes on gluconeogenesis
and glucose output in humans: a quantitative study. Diabetes 49, 1367–1373.
97. Gastaldelli, A., Toschi, E., Pettiti, M., Frascerra, S., Quinones-Galvan, A., Sironi,
A. M., Natali, A. and Ferrannini, E. (2001) Effect of physiological hyperinsulinemia
on gluconeogenesis in nondiabetic subjects and in type 2 diabetic patients. Diabetes
50, 1807–1812.
98. Efendic, S., Karlander, S. and Vranic, M. (1998) Mild type II diabetes markedly
increases glucose cycling in the postabsorptive state and during glucose infusion
irrespective of obesity. J Clin Invest 81, 1953–1961.
99. Paquot, N., Scheen, A. J., Dirlewanger, M., Lefebvre, P. J. and Tappy, L. (2002) Hep-
atic insulin resistance in obese non-diabetic subjects and in type 2 diabetic patients.
Obes Res 10, 129–134.
100. Massillon, D., Barzilai, N., Hawkins, M., Prus-Wertheimer, D. and Rossetti, L. (1997)
Induction of hepatic glucose-6-phosphatase gene expression by lipid infusion [published
erratum appears in Diabetes 1997 Mar; 46 (3): 536]. Diabetes 46, 153–157.
101. Clore, J. N., Stillman, J. and Sugerman, H. (2000) Glucose-6-phosphatase flux in vitro
is increased in type 2 diabetes. Diabetes 49, 969–974.
102. Caro, J. F., Triester, S., Patel, V. K., Tapscott, E. B., Frazier, N. L. and Dohm, G. L.
(1995) Liver glucokinase: decreased activity in patients with type II diabetes. Horm
Metab Res 27, 19–22.
103. Adeli, K., Taghibiglou, C., Van Iderstine, S. C. and Lewis, G. F. (2001) Mechanisms
of hepatic very low-density lipoprotein overproduction in insulin resistance. Trends
Cardiovasc Med 11, 170–176.
104. Taghibiglou, C., Carpentier, A., Van Iderstine, S. C., Chen, B., Rudy, D., Aiton, A.,
Lewis, G. F. and Adeli, K. (2000) Mechanisms of hepatic very low density lipopro-
tein overproduction in insulin resistance. Evidence for enhanced lipoprotein assembly,
reduced intracellular ApoB degradation, and increased microsomal triglyceride transfer
protein in a fructose-fed hamster model. JBiolChem275, 8416–8425.
105. Malmstrom, R., Packard, C. J., Caslake, M., Bedford, D., Stewart, P., Yki-Jarvinen, H.,
Shepherd, J. and Taskinen, M. R. (1997) Defective regulation of triglyceride metabolism
by insulin in the liver in NIDDM. Diabetologia 40, 454–462.
106. Lewis, G. F., Carpentier, A., Adeli, K. and Giacca, A. (2002) Disordered fat storage
and mobilization in the pathogenesis of insulin resistance and type 2 diabetes. Endocr
Rev 23, 201–229.
7
Central Regulation of Peripheral
Glucose Metabolism
Stanley M. Hileman and Christian Bjørbæk
7.1 Introduction
Glucose is the primary and preferred fuel for the brain. Thus, maintaining glu-
cose homeostasis is of critical concern for this organ. Mechanisms in the central
nervous system (CNS) have evolved both to detect changes in available energy
and to initiate appropriate responses, including effects on appetite and modula-
tion of peripheral glucose levels, to ensure sufficient supply of glucose.
Plasma glucose level is the most important determinant of the secretion
of classical glucoregulatory hormones, such as insulin and glucagon. Clearly,
hypoglycaemia can be sensed directly by the brain and counter-regulatory mech-
anisms can be mounted in the CNS to drive glucose levels back toward the
normoglycaemic range. Activation of neuroendocrine systems and the auto-
nomic nervous system are the main effector pathways invoked by the brain.
Combined, these central and peripheral regulatory events result in increased
production of glucose by the liver and decreased utilization by peripheral tis-
sues. Counter-regulatory responses are relevant during prolonged starvation and
are particularly important for diabetic patients using insulin, where hypogly-
caemia often occurs inadvertently. We will herein discuss the role of the brain
in counter-regulation to severe hypoglycaemia and mechanisms whereby the
CNS may sense small day-to-day changes in glucose levels. This chapter will
also focus on a number of other afferent signals to the CNS, including leptin,
insulin and free fatty acids, that may influence glucose homeostasis independent
of their effects on feeding behaviour.
Insulin Resistance. Edited by Sudhesh Kumar and Stephen O’Rahilly
2005 John Wiley & Sons, Ltd ISBN: 0-470-85008-6
180 CENTRAL REGULATION OF PERIPHERAL GLUCOSE METABOLISM
7.2 Counter-regulation of hypoglycaemia – role of the CNS
Although the brain depends primarily upon glucose for energy, it does not syn-
thesize glucose and brain glycogen stores are very limited. It is therefore not
surprising that mechanisms are in place to ensure a sufficient supply of glucose
to protect brain function during hypoglycaemia. The importance of these mecha-
nisms in regulating glucose levels from meal to meal or during overnight fasting
in normal individuals is not clear, but they are critical during extended fasts,
acute insulin-induced hypoglycaemia, prolonged or repeated hypoglycaemia due
to insulinomas or intensive diabetic therapy and hypoglycaemic episodes that
occur in diabetic patients overnight. They may also be important during periods
of prolonged undernutrition such as occurs during cachexia or anorexia nervosa.
Counter-regulation of hypoglycaemia involves a compendium of hormones
and neurotransmitters that are released with the goal of providing glucose for
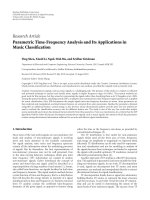
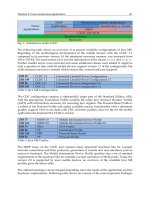
brain utilization while decreasing glucose need in peripheral tissues (Figure 7.1).
The primary players involved in counter-regulation are insulin, glucagon,
epinephrine, norepinephrine, cortisol and growth hormone. A hierarchy exists
for invoking release of these factors.
1–3
Decreased insulin release occurs when
glucose levels drop to ∼4.5 mM from a normal level of ∼6.0 mM. Glucose
levels that trigger decreased insulin release lie just at or below values normally
seen during the postadsorptive state (∼4.5–5.0 mM), so further absence of
food leads to compensatory reduction in pancreatic insulin release. Increases
in counter-regulatory release of glucagon, epinephrine, norepinephrine, cortisol
and growth hormone occur when glucose levels reach ∼3.6–3.8 mM. Symptoms
of hypoglycaemia that are of neural origin (i.e. sweating, hunger, tingling,
weakness, dizziness) and cognitive dysfunction appear at glucose levels of
∼3.0 and ∼2.6 mM, respectively. Counter-regulatory mechanisms are invoked
at glycaemic thresholds that are higher than thresholds for symptoms of
hypoglycaemia. Of particular importance to diabetic patients is the fact that
these thresholds are not absolute, but instead are dynamic and vary depending
on the antecedent glucose levels. Thus, thresholds are lowered in diabetic
individuals receiving intense insulin therapy as they undergo recurring bouts of
hypoglycaemia, and this is thought to be an underlying cause of hypoglycaemia
unawareness.
4–8
As described above, the earliest response to falling glucose is decreased
pancreatic secretion of insulin, and this is also the major means of regulat-
ing circulating glucose levels between meals. Further reductions in blood glu-
cose stimulate glucagon release from the α-cells of the pancreas, stimulat-
ing hepatic glucose production, but unlike insulin glucagon does not influ-
ence glucose utilization.
9
Decreasing levels of glucose also elicit release of
epinephrine from the adrenal medulla, which stimulates glucose production and
limits glucose utilization through a β2-adrenergic-receptor-mediated mechanism.
Epinephrine also stimulates mobilization of fatty acids and inhibits pancreatic
insulin secretion.
10
COUNTER-REGULATION OF HYPOGLYCAEMIA – ROLE OF THE CNS 181
Less critical to the initial counter-regulatory response are norepinephrine
(NE), growth hormone and cortisol. Circulating NE levels increase markedly
during hypoglycaemia and mainly reflect release from the sympathetic nervous
system. As discussed later, sympathetic innervation of the liver and pancreas
plays a role in controlling glucagon and insulin release, and influences hep-
atic glucose production. Release of growth hormone from the anterior pituitary
and of cortisol from the adrenal cortex plays a role during prolonged hypogly-
caemia, leading to elevation of alternative fuels such as free fatty acids and
ketones.
11
Cortisol and growth hormone, along with catecholamines, may play
a role in the Somogyi phenomenon, wherein hypoglycaemia leads to rebound
hyperglycaemia and posthypoglycaemic insulin resistance due to the inputs of
counter-regulatory hormones outweighing that of insulin.
12–14
Growth hormone
is also thought to be involved in the ‘dawn phenomenon’, wherein early morning
hyperglycaemia occurs in the absence of antecedent hypoglycaemia.
15
In response to acute hypoglycaemia, fasting and prolonged starvation, the
CNS regulates several efferent signals. Key sensory and effector sites are located
in the hypothalamus, the brainstem and in the spinal cord, which communicate
with each other via direct or indirect neuronal circuitries. Efferent signals are of
neuronal (dotted lines) and humoral (full lines) nature. Hypoglycaemia reduces
the activity of the parasympathetic nervous system (PNS) and stimulates the
sympathetic nervous system (SNS), which innervates the adrenals, the pancreas
and the liver, and ultimately leads to increased glucose production (GP) by the
liver. Additional hypothalamic-pituitary hormonal systems play a role during
fasting and prolonged starvation, stimulating release into the circulation of free
fatty acids (FFA) and ketones, which serve as alternative fuels. Stimulatory or
inhibitory effects on hepatic glucose production are indicated by (+) and (−),
respectively; DMV = dorsal motor complex of the vagus nerve; PIT = pituitary.
The idea that the brain is important in generating the counter-regulatory
response to hypoglycaemia was proposed as early as 1849 by Claude Bernard,
16
who found that puncturing the fourth cerebroventricle caused glucosuria in
dogs. Subsequent investigators observed that damage to the ventral hypothala-
mus led to hyperglycaemia or glucosuria.
17
In addition, electrical stimulation of
the ventromedial hypothalamus (VMH) increases blood glucose levels within 3
minutes
18
and intracerebroventricular delivery of 2-deoxyglucose (2-DG), a glu-
cose antagonist, stimulates serum glucose levels and increases glucagon, cortisol,
epinephrine and norepinephrine levels,
19, 20
a response attenuated by hypotha-
lamic deafferentation.
21
A combination of spinal cord and vagal transection
blocked the counter-regulatory increase of glucose following insulin admin-
istration in dogs.
22
Moreover, insulin infusion into the carotid artery induces
a hypoglycemic state,
23
and preventing neuroglucopenia by infusing glucose
through the carotid and/or vertebral arteries
24, 25
significantly attenuates the glu-
coregulatory response to systemic hypoglycaemia. Frizzell et al.
26
showed that
selective carotid or vertebral artery glucose infusion was not nearly as effective
182 CENTRAL REGULATION OF PERIPHERAL GLUCOSE METABOLISM
GLUCOSE
Liver
GP
Brainstem
Spinal cord
Insulin
Pancreas
Glucagon
Epinephrine
PIT
Cortisol
Growth
hormone
Fat
FFA
SNS
(–)
(+)
(–)
(+)
(+)
Hypothalamus
ACTH
Vagal
efferents
Adrenal
DMV
PNS
FFA
Ketones
αβ
Figure 7.1 Central efferent responses to hypoglycaemia
as infusion through both arteries in preventing the glucoregulatory response to
insulin-induced hypoglycemia. Since vertebral and carotid artery infusion target
different areas of the brain, this finding implies that several distinct regions are
involved in counter-regulation to hypoglycaemia.
7.3 Brain regions involved in counter-regulation
Food intake and energy balance are primarily controlled by the hypothalamus
and by the brainstem.
27–31
As described below, evidence also supports roles
for these two brain regions in controlling central responses to hypoglycaemia
(Figure 7.2).
The importance of the hypothalamus is supported by studies showing that
injections of the glucose antagonist 3-O-methyl glucose into the ventrolateral
hypothalamus results in epinephrine secretion and hyperglycaemia, an effect that
is blocked by functional denervation of the adrenal gland.
32
In addition, elec-
trical stimulation of the VMH elicits a rapid increase in plasma glucose, which
is attenuated by adrenalectomy and by injection of glucagon antiserum.
18
Borg
et al.
33
lesioned the VMH, LHA or cortex and then manipulated serum glucose
concentrations to achieve euglycaemia (6.0 mM) or hypoglycaemia (3.0 mM)
by insulin clamp. As expected, hypoglycaemia increased epinephrine, nore-
pinephrine and glucagon. VMH lesions reduced the magnitude of this response
by about 60 per cent whereas lesions of the LHA or frontal lobe were inef-
fective. In less invasive studies, Borg et al.
34
reported an increase in plasma
glucose in freely moving rats within 30 minutes of inducing glucopenia in the
BRAIN REGIONS INVOLVED IN COUNTER-REGULATION 183
1
2
1
VMH
LHA
PVN
ARC
OT
AP
NTS
CC
CTX
CER
Hypothalamus
DMH
ME
DMV
PIT
Spinal cord
Caudal brainstem
2
CER
3V
Figure 7.2 Key regions of the CNS involved in peripheral gluceregulation
VMH by local delivery of 2-DG via microdialysis. Delivery of glucose to the
same site had the opposite effect,
35
and delivery of 2-DG to the frontal lobes of
the brain were ineffective.
33
The figure above shows a schematic drawing of a sagital section of the rodent
brain. Coronal sections of the hypothalamus and caudal brainstem are indicated
by vertical lines and marked as
1
and
2
, respectively. CTX = cortex; CER =
cerebellum; PIT = pituitary.
1
Schematic drawing of key nuclei in a coronal
section of the hypothalamus. PVN = paraventricular hypothalamic nucleus;
LHA = lateral hypothalamic area; DMH = dorsomedial hypothalamic nucleus;
VMH = ventromedial hypothalamic nucleus; ARC = arcuate nucleus; ME =
median eminence; OT = optical tract; 3V = third ventricle.
2
Schematic
drawing of key nuclei in a coronal section of the caudal brainstem. CER =
cerebellum; AP = area postrema; NTS = nucleus of the solitary tract; DMV =
dorsal motor complex of the vagus nerve; CC = central canal.
Ritter et al.
36
localized glucoregulatory sites in the hindbrain of awake rats
using the 5-thio-D-glucose (5TG) glucose analogue. Multiple injection sites were
analysed for hyperglycaemic or hyperphagic responses between 30 min and 4
hours post-injection, and many injection sites, including the nucleus of the soli-
tary tract (NTS), were associated with increased blood glucose. However, in the
same study and in contrast to the results by Borg et al., Ritter et al. did not find
any responsive sites in the VMH. The explanation for this discrepancy is unclear,
184 CENTRAL REGULATION OF PERIPHERAL GLUCOSE METABOLISM
but one possibility is that the 2-DG compound used by Borg et al. reached
the hindbrain sites identified by Ritter et al., although Borg et al. reported that
hypothalamic regions close to the injection site did not contain 2-DG following
injection. In further support of the hindbrain sites, but not of the forebrain region,
Ritter et al.
37
showed that blood glucose levels were unaffected by 5TG injec-
tions into the third ventricle when flow of cerebrospinal fluid from the third
to fourth ventricle was blocked, yet 5TG injections into the fourth ventricle
were still effective. Also pointing to the presence of hindbrain glucoresponsive
regions as primary mediators of the counter-regulatory response are findings by
DiRocco and Grill
27, 38
demonstrating hyperglycaemic responses to systemic
administration of 2-DG in decerebrate rats. While further studies are needed to
resolve the discrepancy between these studies, the data clearly support the notion
that specific regions within the central nervous system can sense hypoglycemia.
In addition, injections of glucose into the carotid artery supplying the brain, in
amounts that do not affect systemic glycemia, rapidly increase plasma insulin
concentrations,
39
an effect probably mediated by the parasympathetic nervous
system. Combined with the above data, these data demonstrate a role of the
brain in sensing both low and high glucose levels, and the ability of the CNS
to generate an appropriate response affecting peripheral glucose metabolism.
7.4 Glucosensing neurons
As described above, the CNS can sense and respond to changes in available
glucose.
40, 41
However, these studies have mostly been carried out under con-
ditions where local glucose levels were outside the normal physiological range
and not in response to the complete changes in blood glucose that only vary
slightly from meal to meal or with the diurnal swing. In order for the brain to
influence peripheral glucose metabolism under such circumstances, it must at
least be able to sense relatively minor changes in blood glucose.
All brain neurons become silent when they experience a rapid fall in glucose
levels below 1 mM,
42
a response that may be protective in the short term.
43
In
contrast to neuronal silencing at very low glucose levels, rare but highly special-
ized neurons exist in the CNS that are sensitive to changes in blood glucose that
are only slightly above or below the normal range. Generally, two approaches
have been taken to study this in detail. One involves single-cell recordings in
brain-slice preparations during exposure to varying concentrations of glucose,
the other using implanted electrodes in animals and measuring neuronal activity
in response to changes in blood glucose levels in situ. By recording individual
neuronal discharge frequencies in anaesthetized cats, Oomura et al.
44
reported
that hypothalamic neurons either became increasingly active (glucose stimu-
lated) or increasingly inactive (glucose inhibited) in response to intracarotid
injection of glucose. In later studies, Oomura et al.
45, 46
showed that about 30
per cent of all tested cells in the LHA reduced their firing rates and about 20 per
GLUCOSENSING NEURONS 185
cent were activated in response to local intrahypothalamic delivery of glucose
in rats. In contrast, approximately 35 per cent of examined VMH cells were
activated and only a few were inhibited. Using similar methods, 45 per cent
of tested neurons in the NTS increase firing frequency in response to locally
injected glucose.
47
An elegant and more recent investigation has studied this in further detail.
Silver and Erecinska
48
measured blood glucose, brain extracellular glucose and
neuronal firing rates in anaesthetized rats while gradually increasing or decreas-
ing circulating blood glucose levels within the physiological range. In the LHA,
increasing glucose inhibited 33 per cent of the tested neurons while about seven
per cent were activated and 60 per cent were unresponsive. The investigators
classified the cellular responses into four groups. The predominant type gradually
decreased firing as glucose rose (maximal firing rate at 3 mM blood glucose),
becoming completely inhibited at 10–12 mM. In the VMH, most cells were
silent at blood glucose of 3–4 mM and progressively increased their activity
as glucose rose to ∼15 mM, and could not be inhibited by higher glucose lev-
els. No cells in the VMH were inhibited by glucose, consistent with earlier
reports.
45
In summary, this work by Silver and Erecinska suggests that highly
specialized cells in the hypothalamus alter firing rates in response to very small,
physiological changes in blood glucose levels.
The study by Silver and Erecinska could not entirely exclude the possibil-
ity that circulating factors other than glucose were mediating the effect on the
hypothalamic neurons. Furthermore, it could not be determined whether the
affected cells were directly influenced by extracellular glucose, or whether they
were indirectly modulated via synaptic inputs from true glucosensing cells. Other
investigators
49, 43
have addressed this question by using thin brain slices and
patch clamp recordings, while controlling glucose concentrations present in the
medium. Neurons were found that were directly inhibited or directly stimulated
by glucose as well as other neurons that were activated or inhibited via presynap-
tic modulation, presumably by the true glucosensing neurons. Several additional
brain regions harbouring glucosensing cells have been reported using similar
methods, including the arcuate nucleus (ARC),
50
the paraventricular nucleus of
the hypothalamus (PVN),
51
and the hindbrain.
52
These in vitro studies demon-
strate that specific brain regions contain specialized neurons that respond to
physiologically relevant changes in extracellular glucose levels. However, it
remains to be determined whether these specific cells play a role in regulat-
ing peripheral glucose metabolism, either in the counterregulatory response to
hypoglycemia or within meal-to-meal variation of blood glucose levels.
The exact cellular mechanism by which glucosensing neurons detect changes
in extracellular glucose is not fully understood. Evidence suggesting that hypo-
thalamic glucose-stimulated neurons utilize an ATP-sensitive K
+
channel was
first reported by Ashford et al.
53, 54
They showed that blocking the K
+
-ATP
channel activates neurons in isolated hypothalamic slices. Furthermore, injection
186 CENTRAL REGULATION OF PERIPHERAL GLUCOSE METABOLISM
of another K
+
-ATP blocker, glibenclamide, into the VMH impairs the coun-
terregulatory increase in blood glucose after insulin-induced hypoglycaemia,
and decreases blood glucose in normoglycemic rats.
55
In pancreatic β-cells,
membrane-bound K
+
-ATP channels are comprised of a pore-forming subunit
(Kir6.2) through which potassium ions travel out of the cell, and of a regulatory
unit (SUR1) that binds synthetic sulfonylureas (tolbutamide, glibenclamide),
which close the channel and lead to increased insulin secretion.
56
The SUR reg-
ulates Kir6.2 in response to the intracellular ATP/ADP ratio. Thus, stimulating
β-cells with glucose increases the ATP/ADP ratio, inhibiting Kir6.2 activity, and
causing accumulation of intracellular K
+
. Influx of calcium ions via Ca
2+
chan-
nels finally triggers insulin secretion.
57
This model has led to the hypothesis that
hypothalamic glucose-stimulated neurons have significant similarities to pancre-
atic β-cells. The neuronal model envisions that glucose induces depolarization
of the neuron by closing K
+
-ATP channels, leading to increased firing rates and
increased cellular Ca
2+
at axon terminals, ultimately causing release of neu-
rotransmitters and neuropeptides. Less is known about how glucose-inhibited
neurons sense glucose, since these cells become hyperpolarized with increasing
glucose levels.
Lee et al. have shown by single-cell PCR that glucosensing neurons express
ATP-sensitive potassium channels.
58
Additional evidence for a role of the K
+
-
ATP channel in glucosensing by the brain arises from recent results of Miki
et al.
59
Mice lacking the Kir6.2 gene were devoid of glucose-stimulated neu-
rons in brain slices containing the VMH. Furthermore, in response to systemic
hypoglycaemia or neuroglucopenia, the ability to increase circulating glucagon
and glucose levels was greatly impaired. Based on this, the authors concluded
that K
+
-ATP channels in VMH-glucose-stimulated neurons are required for
glucose responsiveness and that K
+
-ATP channels in this brain region are
essential for maintenance of glucose homeostasis. While the first conclusion
is clearly supported by the data, the latter must be considered speculative, since
it is doubtful that the VMH is solely responsible for the counterregulatory
response. Also, the K
+
-ATP channel (Kir6.2) is widely expressed throughout
the brain and is not restricted to the VMH.
42, 60–62
Thus, presence of this
channel is not sufficient to act as the only critical component of glucosens-
ing neurons.
Of higher potential for use in defining glucosensing neurons is the pancre-
atic form of hexokinase, i.e. glucokinase (GK). This enzyme is rate limiting
for glycolysis in the β-cell because its K
m
, in contrast to the K
m
of other
hexokinases, lies within the physiological range for blood glucose.
63
The CNS
sites of expression include the VMH, DMH, PVN, ARC, LHA and the caudal
brain stem.
42, 64–67
This expression pattern thus resembles that of glucosensing
neurons and opens the possibility that GK is expressed in these cells. In dis-
sociated neurons from the VMH, about 70 per cent of both glucose-inhibited
and stimulated cells are affected by inhibition of GK,
66
while non-glucosensing
CONTROL OF PERIPHERAL ORGANS INVOLVED IN GLUCOREGULATION 187
neurons are largely unaffected. This suggests that GK is not expressed in non-
glucosensing cells, although this requires further investigation since GK expres-
sion is relatively wide as described above. Although GK is expressed in both
glucose-inhibited and glucose-stimulated neurons and may be a component of
the glucosensing mechanism, the question remains that if GK is expressed in
both cells, what then distinguishes the two types of neuron?
7.5 Central control of peripheral organs involved
in glucoregulation
The liver
The liver is richly innervated by both sympathetic and parasympathetic
nerves.
68, 69
The sympathetic fibres derive from the splanchnic nerves and
their postganglionic fibres originate from the celiac ganglia. Parasympathetic
innervation arises from both the left and right vagus nerves. The majority
of the nerve supply enters along the common hepatic artery and portal
vein. Stimulation of the vagus nerve increases the activity of liver glycogen
synthase, the rate-limiting enzyme in glycogen synthesis from glucose-6-
phosphate.
70
This effect is not influenced by pancreatectomy, suggesting that
this occurs directly in the liver and is not mediated by changing insulin
levels. Systemic infusion of glucose increases vagal efferent activity, a
relationship that is linear over the physiological range of circulating glucose
concentrations.
71
In contrast, stimulation of the splanchnic nerves depletes
glycogen reserves and increases serum glucose levels.
72, 73
Furthermore,
splanchnic nerve stimulation in rabbits activates two glycogenolytic enzymes,
phosphorylase and glucose-6-phosphatase, within 30 seconds, suggesting a direct
effect on liver glucoregulation.
73, 74
Moreover, decreases in serum glucose levels
in response to a carotid artery insulin injection have been ascribed to direct
neural effects on liver glucose production and glucose uptake.
23
Altogether,
this data points to a role for the CNS in regulating liver glucose metabolism,
although the exact quantitative impact of this regulation under physiological
circumstances is unclear.
The pancreas
As the primary source of insulin and glucagon, the pancreas is of obvious
importance in regulating peripheral glucose levels. Regulation of insulin and
glucagon release from the pancreas by the central nervous system arises from
three inputs, two of which are neural while one is hormonal: (1) parasympathetic
innervation, (2) sympathetic innervation and (3) sympathoadrenal input. Inner-
vation of the pancreas by the parasympathetic nervous system is accomplished
by the vagus nerve and consists mainly of cholinergic input,
75
although there
appears to be some peptidergic innervation as well, namely vasoactive intestinal
188 CENTRAL REGULATION OF PERIPHERAL GLUCOSE METABOLISM
peptide and gastric releasing peptide.
76
Postganglionic sympathetic input enters
the pancreas in conjunction with the arterial blood vessels to enter as part of
the mixed autonomic nerve. There may also be preganglionic sympathetic effer-
ents that enter the pancreas directly and innervate intrapancreatic sympathetic
ganglia.
78, 79
These sympathetic nerve fibres contain mostly norepinephrine, but
may also include neuropeptides such as neuropeptide Y and galanin.
77
Insulin-induced decreases in blood glucose decrease the firing rate of the
pancreatic branch of the vagus nerve.
80
In contrast, carotid artery infusion of
isotonic glucose stimulates coeliac–pancreatic vagus firing rate and intracarotid
infusion is more effective than intravenous administration.
80
Stimulation of
parasympathetic inputs increases insulin release in the dog and the baboon
81, 19
and increases glucagon release from α-cells in dogs and calves.
82, 83
Further-
more, stimulation of the mixed pancreatic nerve increases insulin levels in the
pancreatic duodenal vein and vagal stimulation increases insulin release in per-
fused preparations of pancreas, responses that are blocked by administration
of the anticholinergic drug atropine.
10
Stimulation of sympathetic input or of
the splanchnic nerve decreases insulin release, likely via the α-adrenoreceptor,
and increases glucagon release.
84–88
Norepinephrine release from the pancreatic
sympathetic nervous system increases with increased severity of glucopenia
89
and ganglionic blockade inhibits this response.
90
Pancreatic sympathetic nerve
activity is stimulated by 2-DG administration to the lateral cerebroventricles.
91
Finally, denervation of the pancreas blocks the response to systemically admin-
istered 2-DG and intrapancreatic arterial infusion of 2-DG fails to reproduce the
pancreatic norepinephrine response, clearly supporting a central role in these
processes.
91
The adrenal glands
As mentioned above, the adrenal glands provide input for glucoregulation both via
epinephrine release and via secretion of glucocorticoids. Regarding the former,
the adrenals receive sympathetic input through the greater and lesser splanchnic
nerves and lumbar ganglia of the abdominal sympathetic chains.
69
The vagus
does not appear to contribute directly.
69
Cannon
92
first showed that hypogly-
caemia elicited epinephrine release, a response later shown to increase progres-
sively with the magnitude of glucopenia.
2, 89, 93, 94
Additionally, epinephrine
release in response to hypoglycemia or to the 3-O-methylglucose is blocked
by isolating the adrenal glands from neural input.
94, 95, 90, 96
The hypothalamus
appears to be involved in the sympathoadrenal response to hypoglycaemia since
hypothalamic deafferentation reduces the adrenomedullary response to 2-DG.
21
Indeed, VMH lesions increase adrenal nerve activity and catecholamine release,
while LHA stimulation and lesions increase and decrease adrenal nerve activity,
respectively.
97
In contrast, VMH stimulation did not affect adrenal nerve activity.
Intracerebroventricular administration of 2-DG increased adrenal nerve activity,
ADDITIONAL AFFERENT SIGNALS TO THE CNS 189
a response blocked by LHA lesions but unaffected by VMH lesions. However,
stimulation of the VMH prior to 2-DG treatment reduced the 2-DG-induced
increase in adrenal nerve activity.
97
Based on this data, the authors concluded
that the LHA is sensitive to 2-DG and comprises a major part of the sym-
pathoadrenal response, but that the VMH response may depend on antecedent
adrenal nerve activity and be mediated by other neuronal structures that func-
tion as relay points of integrating sites between the VMH and sympathetic
efferents. Also, adrenalectomy influences the insulin and glucose response to
VMH stimulation.
18
Thus, the brain is an important component of the pathways
influencing sympathoadrenal epinephrine release during hypoglycemia.
Release of cortisol (humans) or corticosterone (rodents) is increased during
hypoglycaemia.
11
This reflects hypothalamic output of corticotropin-releasing
hormone (CRH), which in turn stimulates adrenocorticotrophic hormone (ACTH)
release from the anterior pituitary, ultimately leading to increased glucocorti-
coid secretion from the adrenals. As mentioned earlier, increased cortisol release
probably plays a minor role in glucoregulation, mainly during the later stages
of prolonged hypoglycaemia. However, there is some indication that CRH itself
influences sympathoadrenal activity, since CRH administration prior to hypo-
glycemia blunts the counter-regulatory epinephrine response, a result not observed
after prior treatment with ACTH or corticosterone.
98
7.6 Additional afferent signals to the CNS regulating
peripheral glucose metabolism
Pancreatic and hepatic glucosensing
Russek
99
first postulated that specific receptors in the liver monitor glucose
levels and send information via the vagus nerve to brain regions important
for controlling food intake. These glucosensing entities appear to be localized
specifically to the portal vein
100
and histological studies have revealed extensive
afferent innervation of the portal vein adventitia.
101 – 103
Portal vein glucose infu-
sion decreases the firing rate of the hepatic branch of the afferent vagus nerve
in perfused liver preparations
104
and discharge rates of hepatic vagal afferents
are inversely proportional to portal vein glucose concentrations.
105
Furthermore,
systemic infusion of 2-DG increases the hepatic vagal afferent discharge rate.
106
Interestingly, fluctuations in portal vein glucose levels influence the firing rate
of neurons in the LHA and NTS.
107
Thus, hepatoportal vagal afferents carry
information regarding portal vein glucose levels to hypothalamic areas known
for generating a counter-regulatory response (Figure 7.3). This figure depicts
factors and pathways that can act on the CNS to influence peripheral glu-
cose metabolism, independent of long-term effects on energy intake. Glucose is
sensed by specialized glucosensing neurons located primarily in the hypotha-
lamus and in the caudal brainstem. Neurons that are regulated by leptin are
190 CENTRAL REGULATION OF PERIPHERAL GLUCOSE METABOLISM
BLOOD
GLUCOSE
Liver
Pancreas
Fat
LeptinFFA Insulin
NTS
Hypothalamus
Vagal
afferents
Brainstem
Figure 7.3 Central afferent signals involved in regulation of peripheral glucose metabolism
located in the same regions of the brain and may overlap directly with those
that sense glucose. Moreover, both insulin and FFA may act in similar regions
of the hypothalamus to affect peripheral glucose metabolism. Glucosensory neu-
rons of the vagus nerve are also present in the pancreas and in the portal vain
of the liver, transmitting information to the CNS about local glucose levels.
NTS = nucleus of the solitary tract; FFA = free fatty acids.
Perseghin et al.
108
assessed the importance of neural input from and to the
liver in glucoregulation by examining liver transplant patients. They observed
that glucose levels in liver transplant patients were maintained in the lower phys-
iological range within a few weeks of transplant. These authors also observed
that fasting glucose levels and glucose production were lower, that glucose pro-
duction during insulin-induced hypoglycaemia was significantly less and that
the counterregulatory response was blunted in transplant patients. Bolli et al.
109
pharmacologically blocked counter-regulatory hormone influences on glucose
production and observed that counter-regulatory hormones account for practi-
cally all of the glucose produced at blood glucose levels of 50 mg/dl, but that
hepatic glucose production increased twofold over controls at blood glucose lev-
els of 30 mg/dl. As mentioned previously, peripheral hypoglycaemia induced by
insulin leads to large increases in epinephrine and norepinephrine release. This
increase is blunted by about 50–60 per cent in rats wherein the portal vein is
denervated.
110
It has been estimated that the liver can produce anywhere from
12 to 50 per cent of circulating glucose during hypoglycaemia independent of
counter-regulatory hormone influence.
111 – 115
Confounding many of these stud-
ies is the fact that, during severe hypoglycaemia, the liver can produce glucose
ADDITIONAL AFFERENT SIGNALS TO THE CNS 191
in the absence of neural or counterregulatory hormone input.
109, 115 – 118
Thus,
the relative importances of neural influences in the liver on glucoregulation are
difficult to assess, but probably account for less than 25 per cent of hepatic
glucose production during moderate hypoglycaemia.
The relative importance of the CNS in generating a response to hypoglycaemia
in the pancreas has not been addressed in detail. Clearly, decreases in blood glu-
cose can be directly detected within the pancreas and a response generated by
the α- and β-cells. However, it is possible that pancreatic vagal afferents send
information regarding local glucose levels to the brain since intravenous glucose
or 2-DG increases and intravenous insulin decreases the pancreatic vagal afferent
firing rate.
80
In pancreas transplant patients, glucose levels are normal, suggesting
that humoral regulation of pancreatic function is sufficient for dealing with nor-
mal day-to-day changes in glucose levels. However, deficits in glucoregulation
during hypoglycemia have been noted in these patients. Diem et al.
119
reported
that, although glucose recovery improved in diabetics with pancreatic transplants,
recovery of hepatic glucose production during hypoglycaemia increased by only
34 per cent over baseline in transplant patients compared with 58 per cent in
control individuals. Battezzati et al.
120
observed that, in response to mild hypo-
glycaemia, hepatic glucose production initially decreased and then returned to
baseline in controls by 1 h, but was still depressed at 2 h in transplant patients
despite normal glucagon and epinephrine responses. Kendall et al.
121
showed
that in type 1 diabetic transplant patients subjected to stepped hypoglycaemia the
glucagon response and symptom awareness were normalized, but the epinephrine
and norepinephrine responses were muted or absent. Thus, it appears that neural
outflow or input from the pancreas influences hepatic glucose production, though
the relative importance it has in counter-regulation remains to be defined.
Leptin
Leptin, the fat-derived hormone discovered in 1994,
122
circulates at levels pro-
portional to body fat mass and delivers information to the brain about energy
stores.
29, 30, 123 – 125
Mutations in leptin or its receptor cause morbid obesity
and severe insulin resistance.
122, 126
In addition to decreasing food intake and
body weight, leptin influences neuroendocrine function, reproduction, adaptive
responses to fasting, bone development, blood pressure, energy expenditure,
sensory nerve input and autonomic outflow. Pertinent to this review is recent
data suggesting that leptin also influences peripheral glucose homeostasis via
actions in the CNS, independent of changes in feeding and body weight. Kamo-
hara et al.
127
showed that intracerebroventricular (ICV) delivery of small doses
of leptin to fasted mice acutely increased glucose turnover and whole body
glucose uptake. Leptin-induced glucose uptake into muscle was nearly ablated
following denervation of the muscle tissue, suggesting that the effect occurred
via autonomic efferent signals. Furthermore, ICV injection of leptin rapidly
192 CENTRAL REGULATION OF PERIPHERAL GLUCOSE METABOLISM
regulates hepatic glucose fluxes
128
and leptin improves insulin sensitivity in
lipodystrophic rodents and patients, independent of feeding.
129 – 132
Functional leptin receptors are found in the ARC, the VMH and the DMH,
and to a lesser degree in the PVN and the LHA.
133 – 136
Outside the hypothala-
mus, expression can be detected in the caudal brain stem.
137, 138, 134
Consistent
with this, leptin affects the firing rates of neurons in isolated brain slices from the
ARC, the VMH and the NTS.
139 – 141
Thus, these locations overlap with centres
that are involved in regulating energy homeostasis and the autonomic nervous
system,
142
and with sites containing glucosensing neurons. Indeed, microinjec-
tion of leptin into the VMH, but not the LHA, of freely moving rats increased
glucose uptake in peripheral tissues, including brown adipose tissue (BAT), heart
and skeletal muscle.
143
Subsequent studies showed that the effect on BAT is
mediated by the sympathetic nervous system.
144
It remains to be determined
whether physiological changes in leptin levels induce the same effects and
whether other sites in the CNS have similar capacities.
Neuropeptide Y (NPY) and proopiomelanocortin (POMC) cells in the ARC
of the hypothalamus have received particular attention due to their key role in
regulating energy homeostasis.
145
NPY potently stimulates food intake
146 – 148
and
NPY neurons co-express the melanocortin receptor antagonist, agouti-related pep-
tide (AgRP).
149
The POMC-derived neuropeptide, α-melanocyte stimulating hor-
mone (α-MSH), induces robust anorexigenic responses in rodents.
150 – 152
Both
NPY/AgRP and POMC neurons are directly regulated by leptin via the leptin
receptor, but in opposing fashions.
153, 154
Leptin stimulates POMC neurons while
NPY/AgRP neurons are inhibited.
139
When leptin levels are low (fasting, leptin-
deficient mice), pomc gene expression decreases, indicating that the melanocortin
system mediates at least some of the effects of leptin.
155, 156
This conclusion is sup-
ported by powerful pharmacological and genetic evidence.
157 – 160
NPY and AgRP
expression is strongly activated in the absence of leptin.
161
When leptin levels are
high (fed state, during leptin administration), POMC expression increases while
NPY and AgRP expression decreases.
162, 156
Both the GK enzyme and the K
+
-ATP (Kir6.2/SUR1) channel are expressed
in POMC
139, 66, 163
and in NPY neurons.
164, 62
However, the importance of
Kir6.2 channels in leptin action is unclear since leptin still inhibits food intake
in Kir6.2−/− mice,
59
although it is possible that other aspects of leptins
pleiotrophic actions could be affected in these mice. Firing rates of POMC
neurons are stimulated by glucose
163
and NPY cells are inhibited.
164
Thus,
both leptin and glucose probably inhibit orexigenic NPY peptide release and
stimulate anorexigenic α-MSH release. Evidence also suggests that central
administration of melanocortin receptor agonists rapidly affects peripheral
glucose metabolism,
165
providing a link between the activity of POMC neurons
and the regulation of glucose and energy homeostasis, a view that is supported
by additional anatomical, genetic, pharmacological and electrophysiological
studies.
166, 153, 167, 145, 123, 163
ADDITIONAL AFFERENT SIGNALS TO THE CNS 193
Insulin
Insulin plays a critical role in regulating glucose homeostasis via direct actions
on insulin receptors expressed in muscle, liver and adipocytes. Insulin receptor
mRNA is also expressed in the brain, including in the cerebral cortex, the cere-
bellum, the dentate gyrus, layers of the pyriform cortex and of the hippocampus,
the choroid plexus and the ARC of the hypothalamus.
168 – 170
In anaesthetized
rats, insulin injected into the carotid artery immediately decreases systemic blood
sugar
23
and delivery of insulin into the VMH or the LHA of rats rapidly affects
neuronal discharge frequency.
45
ICV injection of insulin reduces food intake and
body weight in baboons and rodents
171, 172
and administration of anti-insulin
antibodies into the rat hypothalamus increases food intake.
173
In more recent
studies, complete loss of neuronal insulin receptors by conditional knockout
in mice or partial loss by hypothalamic injection of insulin receptor anti-sense
oligonucleotides results in hyperphagia and increased bodyweight.
174 – 176
Insulin
given ICV into awake rats rapidly inhibits glucose production by the liver,
175, 176
supporting a centrally mediated effect of insulin on glucose metabolism. While
the above studies were mostly chronic and/or pharmacological in nature, a later
study shows that minute amounts of insulin delivered into the brain arteries of
fasted dogs rapidly alter peripheral glucose homeostasis,
177
strongly supporting
a physiological role for central insulin signalling.
Neurons that are inhibited by insulin are present in the ARC and VMH.
Like leptin, insulin activates ATP-sensitive K
+
channels in hypothalamic brain
slices
178
and a role of K
+
-ATP channels in decreasing hepatic glucose produc-
tion in response to insulin has recently been reported.
176
Interestingly, insulin-
sensitive neurons also have glucosensing capabilities.
45, 178
Moreover, insulin
does not affect the activity of neurons from rats lacking functional leptin recep-
tors, suggesting that aspects of insulin action in the CNS require leptin signalling,
and opening the possibility that receptors for insulin and leptin are co-expressed
in glucosensing neurons.
179
Indeed, insulin receptors have recently been iden-
tified in hypothalamic POMC neurons,
180
cells that are activated by leptin and
glucose. Whether POMC neurons increase or decrease firing rates in response to
insulin is unknown, although activation seems more likely since the melanocortin
system appears to be required for insulin-mediated inhibition of food intake
180
and fat mass.
181
In addition, central administration of melanocortin receptor
agonists rapidly reduces serum insulin levels, an effect mediated via the sym-
pathetic nervous system.
165
However, blockade of melanocortin signalling did
not affect inhibition of liver glucose production by insulin.
181
Combined, these
data suggest that the central melanocortin system regulates peripheral glucose
metabolism via effects on insulin release, but that another system regulates glu-
cose production. Further studies of POMC neurons will illuminate the role of
these neurons in insulin action, and of the interplay between insulin, glucose
and leptin signalling in the brain.
194 CENTRAL REGULATION OF PERIPHERAL GLUCOSE METABOLISM
Fatty acids
Increased quantities of free fatty acids (FFAs) are released from adipocytes under
conditions of starvation, diabetes and obesity. These molecules can be utilized
interchangeably with glucose for energy in most tissues, with the notable excep-
tion of brain tissue. However, FFAs are present in the cerebrospinal fluid
182
and FFA extracts delivered to the VMH or LHA of anaesthetized rats rapidly
affect neuronal discharge rates,
183
implying a function for FFAs in the CNS.
Effects on neuronal activity also occur with purified long chain fatty acids
such as oleic acid or palmitic acid, the major FFA in blood.
45
FFAs activate
some neurons, while inhibiting others. Interestingly, the majority of glucosens-
ing neurons respond to FFAs, while the majority of non-glucosensing neurons
are unaffected by FFAs, suggesting that sensitivity to FFAs may be relatively
specific to rare glucosensing neurons, and that these cells integrate multiple
metabolic signals.
Like glucose, insulin and leptin, central administration of oleic acid reduces
food intake in rodents
184
and alteration of central fatty acid metabolism affects
energy intake in rodents.
185
Obici et al.
184
showed that central infusion of oleic
acid in fasted rats inhibited liver glucose production, suggesting that fatty acids
can act within the CNS to affect peripheral glucose metabolism independent of
food intake. This inhibition required activation of the K
+
-ATP channel, pos-
sibly via direct binding of long chain fatty acyl CoA esters to the K
+
-ATP
channel.
186, 187
Since the brain does not usually use lipids as a significant fuel,
these studies indicate that FFAs can act as afferent signals informing the brain
about metabolic status, although the exact brain regions involved and the cellular
mechanisms by which FFAs are sensed remain unclear.
Difficult to reconcile, however, is the finding that oleic acid inhibits food
intake and decreases hepatic glucose production, since circulating FFAs increase
during starvation, a state characterized by increased appetite and hepatic glucose
production. Moreover, the hyperlipidaemia present in human and rodent obesity
is associated with hyperphagia, not hypophagia. Finally, it has been shown that
physiological increases of systemic FFAs in humans increase glucose production
and induce mild hyperglycaemia.
188 – 190
Although the latter effect is presumably
mediated by FFAs acting peripherally, these data imply that central actions of
FFAs to decrease glucose production are of minor importance in the regulation
of whole body glucose metabolism.
7.7 Conclusions and future perspectives
It is clear that the CNS can detect large changes in glucose availability and
respond appropriately in order to maintain adequate glucose supply for the
brain. The most noticeable evidence for this is the rapid counter-regulatory