The art of software testing second edition phần 4 pptx
Bạn đang xem bản rút gọn của tài liệu. Xem và tải ngay bản đầy đủ của tài liệu tại đây (468.07 KB, 26 trang )
The next step is to write a test case covering one or more valid
equivalence classes. For instance, the test case
DIMENSION A(2)
covers classes 1, 4, 7, 10, 12, 15, 24, 28, 29, and 40. The next step is
to devise one or more test cases covering the remaining valid equiv-
alence classes. One test case of the form
DIMENSION A 12345 (I,9, J4XXXX,65535,1,KLM,
X 100), BBB(−65534:100,0:1000,10:10, I:65535)
covers the remaining classes. The invalid-input equivalence classes,
and a test case representing each, are
(3): DIMENSION
(5): DIMENSION (10)
(6): DIMENSION A234567(2)
(9): DIMENSION A.1(2)
(11): DIMENSION 1A(10)
(13): DIMENSION B
(14): DIMENSION B(4,4,4,4,4,4,4,4)
(17): DIMENSION B(4,A(2))
(18): DIMENSION B(4,,7)
(21): DIMENSION C(I.,10)
(23): DIMENSION C(10,1J)
(25): DIMENSION D(−65535:1)
(26): DIMENSION D(65536)
(31): DIMENSION D(4:3)
(37): DIMENSION D(A(2):4)
(38): D(.:4)
Hence, the equivalence classes have been covered by 18 test cases.
You may want to consider how these test cases would compare to a
set of test cases derived in an ad hoc manner.
58 The Art of Software Testing
01.qxd 4/29/04 4:32 PM Page 58
Although equivalence partitioning is vastly superior to a random
selection of test cases, it still has deficiencies. It overlooks certain
types of high-yield test cases, for example. The next two methodolo-
gies, boundary-value analysis and cause-effect graphing, cover many
of these deficiencies.
Boundary-Value Analysis
Experience shows that test cases that explore boundary conditions have
a higher payoff than test cases that do not. Boundary conditions are
those situations directly on, above, and beneath the edges of input
equivalence classes and output equivalence classes. Boundary-value
analysis differs from equivalence partitioning in two respects:
1. Rather than selecting any element in an equivalence class as
being representative, boundary-value analysis requires that
one or more elements be selected such that each edge of the
equivalence class is the subject of a test.
2. Rather than just focusing attention on the input conditions
(input space), test cases are also derived by considering the
result space (output equivalence classes).
It is difficult to present a “cookbook” for boundary-value analysis,
since it requires a degree of creativity and a certain amount of spe-
cialization toward the problem at hand. (Hence, like many other
aspects of testing, it is more a state of mind than anything else.) How-
ever, a few general guidelines are as follows:
1. If an input condition specifies a range of values, write test
cases for the ends of the range, and invalid-input test cases for
situations just beyond the ends. For instance, if the valid
domain of an input value is −1.0–+1.0, write test cases for
the situations −1.0, 1.0, −1.001, and 1.001.
2. If an input condition specifies a number of values, write test
cases for the minimum and maximum number of values and
Test-Case Design 59
01.qxd 4/29/04 4:32 PM Page 59
one beneath and beyond these values. For instance, if an
input file can contain 1–255 records, write test cases for 0, 1,
255, and 256 records.
3. Use guideline 1 for each output condition. For instance, if a
program computes the monthly FICA deduction and if the
minimum is $0.00 and the maximum is $1,165.25, write test
cases that cause $0.00 and $1,165.25 to be deducted. Also,
see if it is possible to invent test cases that might cause a neg-
ative deduction or a deduction of more than $1,165.25. Note
that it is important to examine the boundaries of the result
space because it is not always the case that the boundaries of
the input domains represent the same set of circumstances as
the boundaries of the output ranges (e.g., consider a sine
subroutine). Also, it is not always possible to generate a result
outside of the output range, but it is worth considering the
possibility, nonetheless.
4. Use guideline 2 for each output condition. If an informa-
tion-retrieval system displays the most relevant abstracts based
on an input request, but never more than four abstracts,
write test cases such that the program displays zero, one, and
four abstracts, and write a test case that might cause the pro-
gram to erroneously display five abstracts.
5. If the input or output of a program is an ordered set
(a sequential file, for example, or a linear list or a table),
focus attention on the first and last elements of the set.
6. In addition, use your ingenuity to search for other boundary
conditions.
The triangle analysis program of Chapter 1 can illustrate the need
for boundary-value analysis. For the input values to represent a trian-
gle, they must be integers greater than 0 where the sum of any two is
greater than the third. If you were defining equivalent partitions, you
might define one where this condition is met and another where the
sum of two of the integers is not greater than the third. Hence, two
possible test cases might be 3-4-5 and 1-2-4. However, we have
missed a likely error. That is, if an expression in the program were
60 The Art of Software Testing
01.qxd 4/29/04 4:32 PM Page 60
coded as A+B>=C instead of A+B>C, the program would erroneously tell
us that 1-2-3 represents a valid scalene triangle. Hence, the important
difference between boundary-value analysis and equivalence parti-
tioning is that boundary-value analysis explores situations on and
around the edges of the equivalence partitions.
As an example of a boundary-value analysis, consider the follow-
ing program specification:
MTEST is a program that grades multiple-choice examinations. The
input is a data file named OCR, with multiple records that are 80
characters long. Per the file specification, the first record is a title used
as a title on each output report. The next set of records describes the
correct answers on the exam. These records contain a “2” as the last
character. In the first record of this set, the number of questions is
listed in columns 1–3 (a value of 1–999). Columns 10–59 contain the
correct answers for questions 1–50 (any character is valid as an
answer). Subsequent records contain, in columns 10–59, the correct
answers for questions 51–100, 100–150, and so on.
The third set of records describes the answers of each student;
each of these records contains a “3” in column 80. For each student,
the first record contains the student’s name or number in columns
1–9 (any characters); columns 10–59 contain the student’s answers
for questions 1–50. If the test has more than 50 questions,
subsequent records for the student contain answers 51–100,
101–150, and so on, in columns 10–59. The maximum number of
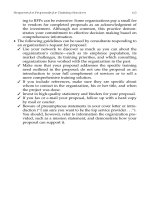
students is 200. The input data are illustrated in Figure 4.4. The four
output records are
1. A report, sorted by student identifier, showing each student’s
grade (percentage of answers correct) and rank.
2. A similar report, but sorted by grade.
3. A report indicating the mean, median, and standard deviation of
the grades.
4. A report, ordered by question number, showing the percentage
of students answering each question correctly.
(End of specification.)
Test-Case Design 61
01.qxd 4/29/04 4:32 PM Page 61
We can begin by methodically reading the specification, looking
for input conditions. The first boundary input condition is an empty
input file. The second input condition is the title record; boundary
conditions are a missing title record and the shortest and longest pos-
sible titles. The next input conditions are the presence of correct-
answer records and the number-of-questions field on the first answer
62 The Art of Software Testing
Figure 4.4
Input to the MTEST program.
1 80
Title
1 3 4 9 10 59 60 79 80
Correct answers 1–50 2
No. of
questions
1 9 10 59 60 79 80
Correct answers 51–100 2
1 9 10 59 60 79 80
Correct answers 1–50 3Student identifier
1 9 10 59 60 79 80
Correct answers 51–100 3
1 9 10 59 60 79 80
Correct answers 1–50 3Student identifier
01.qxd 4/29/04 4:32 PM Page 62
record. The equivalence class for the number of questions is not
1–999, since something special happens at each multiple of 50 (i.e.,
multiple records are needed). A reasonable partitioning of this into
equivalence classes is 1–50 and 51–999. Hence, we need test cases
where the number-of-questions field is set to 0, 1, 50, 51, and 999.
This covers most of the boundary conditions for the number of
correct-answer records; however, three more interesting situations are
the absence of answer records and having one too many and one too
few answer records (for example, the number of questions is 60, but
there are three answer records in one case and one answer record in
the other case). The test cases identified so far are
1. Empty input file.
2. Missing title record.
3. 1-character title.
4. 80-character title.
5. 1-question exam.
6. 50-question exam.
7. 51-question exam.
8. 999-question exam.
9. 0-question exam.
10. Number-of-questions field has nonnumeric value.
11. No correct-answer records after title record.
12. One too many correct-answer records.
13. One too few correct-answer records.
The next input conditions are related to the students’ answers. The
boundary-value test cases here appear to be
14. 0 students.
15. 1 student.
16. 200 students.
17. 201 students.
18. A student has one answer record, but there are two correct-
answer records.
19. The above student is the first student in the file.
Test-Case Design 63
01.qxd 4/29/04 4:32 PM Page 63
20. The above student is the last student in the file.
21. A student has two answer records, but there is just one
correct-answer record.
22. The above student is the first student in the file.
23. The above student is the last student in the file.
You also can derive a useful set of test cases by examining the out-
put boundaries, although some of the output boundaries (e.g., empty
report 1) are covered by the existing test cases. The boundary condi-
tions of reports 1 and 2 are
0 students (same as test 14).
1 student (same as test 15).
200 students (same as test 16).
24. All students receive the same grade.
25. All students receive a different grade.
26. Some, but not all, students receive the same grade (to see if
ranks are computed correctly).
27. A student receives a grade of 0.
28. A student receives a grade of 100.
29. A student has the lowest possible identifier value (to check
the sort).
30. A student has the highest possible identifier value.
31. The number of students is such that the report is just large
enough to fit on one page (to see if an extraneous page is
printed).
32. The number of students is such that all students but one fit
on one page.
The boundary conditions from report 3 (mean, median, and stan-
dard deviation) are
33. The mean is at its maximum (all students have a perfect
score).
34. The mean is 0 (all students receive a grade of 0).
64 The Art of Software Testing
01.qxd 4/29/04 4:32 PM Page 64
35. The standard deviation is at its maximum (one student
receives a 0 and the other receives a 100).
36. The standard deviation is 0 (all students receive the same
grade).
Tests 33 and 34 also cover the boundaries of the median. Another
useful test case is the situation where there are 0 students (looking for
a division by 0 in computing the mean), but this is identical to test
case 14.
An examination of report 4 yields the following boundary-value
tests:
37. All students answer question 1 correctly.
38. All students answer question 1 incorrectly.
39. All students answer the last question correctly.
40. All students answer the last question incorrectly.
41. The number of questions is such that the report is just large
enough to fit on one page.
42. The number of questions is such that all questions but one fit
on one page.
An experienced programmer would probably agree at this point that
many of these 42 test cases represent common errors that might have
been made in developing this program, yet most of these errors prob-
ably would go undetected if a random or ad hoc test-case-generation
method were used. Boundary-value analysis, if practiced correctly, is
one of the most useful test-case-design methods. However, it often is
used ineffectively because the technique, on the surface, sounds simple.
You should understand that boundary conditions may be very subtle
and, hence, identification of them requires a lot of thought.
Cause-Effect Graphing
One weakness of boundary-value analysis and equivalence partition-
ing is that they do not explore combinations of input circumstances. For
Test-Case Design 65
01.qxd 4/29/04 4:32 PM Page 65
instance, perhaps the MTEST program of the previous section fails if
the product of the number of questions and the number of students
exceeds some limit (the program runs out of memory, for example).
Boundary-value testing would not necessarily detect such an error.
The testing of input combinations is not a simple task because
even if you equivalence-partition the input conditions, the number
of combinations usually is astronomical. If you have no systematic
way of selecting a subset of input conditions, you’ll probably select an
arbitrary subset of conditions, which could lead to an ineffective test.
Cause-effect graphing aids in selecting, in a systematic way, a high-
yield set of test cases. It has a beneficial side effect in pointing out
incompleteness and ambiguities in the specification.
A cause-effect graph is a formal language into which a natural-
language specification is translated. The graph actually is a digital-
logic circuit (a combinatorial logic network), but instead of standard
electronics notation, a somewhat simpler notation is used. No knowl-
edge of electronics is necessary other than an understanding of Bool-
ean logic (understanding the logic operators and, or, and not).
The following process is used to derive test cases:
1. The specification is divided into workable pieces. This is
necessary because cause-effect graphing becomes unwieldy
when used on large specifications. For instance, when testing
an e-commerce system, a “workable piece” might be the
specification for choosing and verifying a single item placed
in a shopping cart. When testing a Web page design, you
might test a single menu tree or even a less complex naviga-
tion sequence.
2. The causes and effects in the specification are identified. A
cause is a distinct input condition or an equivalence class of
input conditions. An effect is an output condition or a sys-
tem transformation (a lingering effect that an input has on
the state of the program or system). For instance, if a transac-
tion causes a file or database record to be updated, the alter-
ation is a system transformation; a confirmation message
66 The Art of Software Testing
01.qxd 4/29/04 4:32 PM Page 66
would be an output condition. You identify causes and
effects by reading the specification word by word and under-
lining words or phrases that describe causes and effects. Once
identified, each cause and effect is assigned a unique number.
3. The semantic content of the specification is analyzed and
transformed into a Boolean graph linking the causes and
effects. This is the cause-effect graph.
4. The graph is annotated with constraints describing combina-
tions of causes and/or effects that are impossible because of
syntactic or environmental constraints.
5. By methodically tracing state conditions in the graph, you
convert the graph into a limited-entry decision table. Each
column in the table represents a test case.
6. The columns in the decision table are converted into test cases.
The basic notation for the graph is shown in Figure 4.5. Think of
each node as having the value 0 or 1; 0 represents the “absent” state
and 1 represents the “present” state. The identity function states that
if a is 1, b is 1; else b is 0. The not function states that if a is 1, b is 0,
else b is 1. The or function states that if a or b or c is 1, d is 1; else d is
0. The and function states that if both a and b are 1, c is 1; else c is 0.
The latter two functions (or and and) are allowed to have any number
of inputs.
To illustrate a small graph, consider the following specification:
The character in column 1 must be an “A” or a “B.” The character
in column 2 must be a digit. In this situation, the file update is
made. If the first character is incorrect, message X12 is issued. If the
second character is not a digit, message X13 is issued.
The causes are
1—character in column 1 is “A”
2—character in column 1 is “B”
3—character in column 2 is a digit
Test-Case Design 67
01.qxd 4/29/04 4:32 PM Page 67
and the effects are
70—update made
71—message X12 is issued
72—message X13 is issued
The cause-effect graph is shown in Figure 4.6. Notice the interme-
diate node 11 that was created. You should confirm that the graph
represents the specification by setting all possible states of the causes
and seeing that the effects are set to the correct values. For readers
familiar with logic diagrams, Figure 4.7 is the equivalent logic circuit.
Although the graph in Figure 4.6 represents the specification, it
does contain an impossible combination of causes—it is impossible
for both causes 1 and 2 to be set to 1 simultaneously. In most pro-
68 The Art of Software Testing
Figure 4.5
Basic cause-effect graph symbols.
01.qxd 4/29/04 4:32 PM Page 68
grams, certain combinations of causes are impossible because of syn-
tactic or environmental considerations (a character cannot be an “A”
and a “B” simultaneously). To account for these, the notation in Fig-
ure 4.8 is used. The E constraint states that it must always be true
that, at most, one of a and b can be 1 (a and b cannot be 1 simulta-
Test-Case Design 69
Figure 4.6
Sample cause-effect graph.
Figure 4.7
Logic diagram equivalent to Figure 4.6.
01.qxd 4/29/04 4:33 PM Page 69
neously). The I constraint states that at least one of a,b, and c must
always be 1 (a,b, and c cannot be 0 simultaneously). The O constraint
states that one, and only one, of a and b must be 1. The R constraint
states that for a to be 1, b must be 1 (i.e., it is impossible for a to be 1
and b to be 0).
There frequently is a need for a constraint among effects. The M
constraint in Figure 4.9 states that if effect a is 1, effect b is forced
to 0.
Returning to the preceding simple example, we see that it is phys-
ically impossible for causes 1 and 2 to be present simultaneously, but
it is possible for neither to be present. Hence, they are linked with the
E constraint, as shown in Figure 4.10.
70 The Art of Software Testing
Figure 4.8
Constraint symbols.
01.qxd 4/29/04 4:33 PM Page 70
To illustrate how cause-effect graphing is used to derive test cases,
the specification in the following paragraphs will be used. The spec-
ification is for a debugging command in an interactive system.
The DISPLAY command is used to view from a terminal window the
contents of memory locations. The command syntax is shown in
Test-Case Design 71
Figure 4.9
Symbol for “masks” constraint.
Figure 4.10
Sample cause-effect graph with “exclusive” constraint.
01.qxd 4/29/04 4:33 PM Page 71
Figure 4.11. Brackets represent alternative optional operands. Capital
letters represent operand keywords; lowercase letters represent
operand values (i.e., actual values are to be substituted). Underlined
operands represent the default values (i.e., the value used when the
operand is omitted).
The first operand (hexloc1) specifies the address of the first byte
whose contents are to be displayed. The address may be one to six
hexadecimal digits (0–9, A–F) in length. If it is not specified, the
address 0 is assumed. The address must be within the actual memory
range of the machine.
The second operand specifies the amount of memory to be
displayed. If hexloc2 is specified, it defines the address of the last byte
in the range of locations to be displayed. It may be one to six
hexadecimal digits in length. The address must be greater than or
equal to the starting address (hexloc1). Also, hexloc2 must be within
the actual memory range of the machine. If END is specified,
memory is displayed up through the last actual byte in the machine.
If bytecount is specified, it defines the number of bytes of memory to
be displayed (starting with the location specified in hexloc1). The
operand bytecount is a hexadecimal integer (one to six digits). The
sum of bytecount and hexloc1 must not exceed the actual memory size
plus 1, and bytecount must have a value of at least 1.
72 The Art of Software Testing
Figure 4.11
Syntax of the DISPLAY command.
DISPLAY
hexloc1
0
-hexloc2
-END
-bytecount
-1
01.qxd 4/29/04 4:33 PM Page 72
When memory contents are displayed, the output format on the
screen is one or more lines of the format
xxxxxx = word1 word2 word3 word4
where xxxxxx is the hexadecimal address of word1. An integral
number of words (four-byte sequences, where the address of the first
byte in the word is a multiple of four) is always displayed, regardless
of the value of hexloc1 or the amount of memory to be displayed.
All output lines will always contain four words (16 bytes). The first
byte of the displayed range will fall within the first word.
The error messages that can be produced are
M1 invalid command syntax
M2 memory requested is beyond actual memory limit
M3 memory requested is a zero or negative range
As examples,
DISPLAY
displays the first four words in memory (default starting address of 0,
default byte count of 1),
DISPLAY 77F
displays the word containing the byte at address 77F and the three
subsequent words,
DISPLAY 77F-407A
displays the words containing the bytes in the address range 775-
407A,
DISPLAY 77F.6
Test-Case Design 73
01.qxd 4/29/04 4:33 PM Page 73
displays the words containing the six bytes starting at location 77F,
and
DISPLAY 50FF-END
displays the words containing the bytes in the address range 50FF to
the end of memory.
The first step is a careful analysis of the specification to identify the
causes and effects. The causes are as follows:
1. First operand is present.
2. The hexloc1 operand contains only hexadecimal digits.
3. The hexloc1 operand contains one to six characters.
4. The hexloc1 operand is within the actual memory range of
the machine.
5. Second operand is END.
6. Second operand is hexloc2.
7. Second operand is bytecount.
8. Second operand is omitted.
9. The hexloc2 operand contains only hexadecimal digits.
10. The hexloc2 operand contains one to six characters.
11. The hexloc2 operand is within the actual memory range of
the machine.
12. The hexloc2 operand is greater than or equal to the hexloc1
operand.
13. The bytecount operand contains only hexadecimal digits.
14. The bytecount operand contains one to six characters.
15. bytecount + hexloc1 Ϲ memory size + 1.
16. bytecount м 1.
17. Specified range is large enough to require multiple output
lines.
18. Start of range does not fall on a word boundary.
Each cause has been given an arbitrary unique number. Notice
that four causes (5 through 8) are necessary for the second operand
because the second operand could be (1) END, (2) hexloc2, (3) byte-
74 The Art of Software Testing
01.qxd 4/29/04 4:33 PM Page 74
count, (4) absent, and (5) none of the above. The effects are as follows:
91. Message M1 is displayed.
92. Message M2 is displayed.
93. Message M3 is displayed.
94. Memory is displayed on one line.
95. Memory is displayed on multiple lines.
96. First byte of displayed range falls on a word boundary.
97. First byte of displayed range does not fall on a word
boundary.
The next step is the development of the graph. The cause nodes
are listed vertically on the left side of the sheet of paper; the effect
nodes are listed vertically on the right side. The semantic content of
the specification is carefully analyzed to interconnect the causes and
effects (i.e., to show under what conditions an effect is present).
Figure 4.12 shows an initial version of the graph. Intermediate node
32 represents a syntactically valid first operand; node 35 represents a
syntactically valid second operand. Node 36 represents a syntactically
valid command. If node 36 is 1, effect 91 (the error message) does not
appear. If node 36 is 0, effect 91 is present.
The full graph is shown in Figure 4.13. You should explore the
graph carefully to convince yourself that it accurately reflects the
specification.
If Figure 4.13 were used to derive the test cases, many impossible-
to-create test cases would be derived. The reason is that certain com-
binations of causes are impossible because of syntactic constraints.
For instance, causes 2 and 3 cannot be present unless cause 1 is
present. Cause 4 cannot be present unless both causes 2 and 3 are
present. Figure 4.14 contains the complete graph with the constraint
conditions. Notice that, at most, one of the causes 5, 6, 7, and 8 can
be present. All other cause constraints are the requires condition.
Notice that cause 17 (multiple output lines) requires the not of cause
8 (second operand is omitted); cause 17 can be present only when
cause 8 is absent. Again, you should explore the constraint conditions
carefully.
Test-Case Design 75
01.qxd 4/29/04 4:33 PM Page 75
Figure 4.12
Beginning of the graph for the DISPLAY Command.
76
01.qxd 4/29/04 4:33 PM Page 76
Figure 4.13
Full cause-effect graph without constraints.
77
01.qxd 4/29/04 4:33 PM Page 77
Figure 4.14
Complete cause-effect graph of the DISPLAY Command.
5
4
3
2
1
10
9
8
7
6
15
14
13
12
11
18
17
16
31
32
35
36
91
40
39
38
34
33
97
96
95
94
93
92
V
V
37
V
V
V
V
V
V
V
V
V
V
V
V
R
R
R
R
R
E
R
R
R
R
R
R
R
R
R
R
R
R
R
78
01.qxd 4/29/04 4:33 PM Page 78
The next step is the generation of a limited-entry decision table.
For readers familiar with decision tables, the causes are the conditions
and the effects are the actions. The procedure used is as follows:
1. Select an effect to be the present (1) state.
2. Tracing back through the graph, find all combinations of
causes (subject to the constraints) that will set this effect to 1.
3. Create a column in the decision table for each combination
of causes.
4. For each combination, determine the states of all other
effects and place these in each column.
In performing step 2, the considerations are as follows:
1. When tracing back through an or node whose output should
be 1, never set more than one input to the or to 1 simultane-
ously. This is called path sensitizing. Its objective is to prevent
the failure to detect certain errors because of one cause
masking another cause.
2. When tracing back through an and node whose output
should be 0, all combinations of inputs leading to 0 output
must, of course, be enumerated. However, if you are explor-
ing the situation where one input is 0 and one or more of
the others are 1, it is not necessary to enumerate all condi-
tions under which the other inputs can be 1.
3. When tracing back through an and node whose output
should be 0, only one condition where all inputs are zero
need be enumerated. (If the and is in the middle of the graph
such that its inputs come from other intermediate nodes,
there may be an excessively large number of situations under
which all of its inputs are 0.)
These complicated considerations are summarized in Figure 4.15.
Figure 4.16 is used as an example.
Assume that we want to locate all input conditions that cause the
output state to be 0. Consideration 3 states that we should list only
Test-Case Design 79
01.qxd 4/29/04 4:33 PM Page 79
one circumstance where nodes 5 and 6 are 0. Consideration 2 states
that, for the state where node 5 is 1 and node 6 is 0, we should list
only one circumstance where node 5 is 1, rather than enumerating all
possible ways that node 5 can be 1. Likewise, for the state where node
5 is 0 and node 6 is 1, we should list only one circumstance where
node 6 is 1 (although there is only one in this example). Considera-
tion 1 states that where node 5 should be set to 1, we should not set
nodes 1 and 2 to 1 simultaneously. Hence, we would arrive at five
states of nodes 1 through 4, for example, the values
0000(5=0, 6=0)
1000(5=1, 6=0)
1001(5=1, 6=0)
1010(5=1, 6=0)
0011(5=0, 6=1)
80 The Art of Software Testing
Figure 4.15
Considerations used when tracing the graph.
01.qxd 4/29/04 4:33 PM Page 80
rather than the 13 possible states of nodes 1 through 4 that lead to a
0 output state.
These considerations may appear to be capricious, but they have
an important purpose: to lessen the combined effects of the graph.
They eliminate situations that tend to be low-yield test cases. If low-
yield test cases are not eliminated, a large cause-effect graph will pro-
duce an astronomical number of test cases. If the number of test cases
is too large to be practical, you will select some subset, but there is no
guarantee that the low-yield test cases will be the ones eliminated.
Hence, it is better to eliminate them during the analysis of the graph.
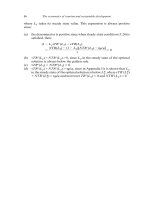
The cause-effect graph in Figure 4.14 will now be converted into
the decision table. Effect 91 will be selected first. Effect 91 is present
if node 36 is 0. Node 36 is 0 if nodes 32 and 35 are 0,0; 0,1; or 1,0;
and considerations 2 and 3 apply here. By tracing back to the causes
and considering the constraints among causes, you can find the com-
binations of causes that lead to effect 91 being present, although
doing so is a laborious process.
The resultant decision table under the condition that effect 91 is
present is shown in Figure 4.17 (columns 1 through 11). Columns
Test-Case Design 81
Figure 4.16
Sample graph to illustrate the tracing considerations.
01.qxd 4/29/04 4:33 PM Page 81
82
Figure 4.17
First half of the resultant decision table.
1
1
2
1
3
1
4
1
5
1
6
1
7
1
8
1
9
1
10
1
11
1
12
1
13
1
14
1
15
1
16
1
17
11
100111111111111112
0101
0
111 1110 111
1
111
11 0011
3
11111111111 00 000091
00000000001 11 110092
00000000000 00 001193
00000000000 00 000094
00000000000 00 000095
00000000000 00 000096
00000000000 00 000097
0111117
100 1 113
010 1
0
1
0
14
15
16
17
18
08
4
5
1110111 11 116
111 100 01 119
111 010 11 1110
00111
012
01.qxd 4/29/04 4:33 PM Page 82