The principles of toxicology environmental and industrial applications 2nd edition phần 3 pps
Bạn đang xem bản rút gọn của tài liệu. Xem và tải ngay bản đầy đủ của tài liệu tại đây (1.18 MB, 61 trang )
Hamilton, A., “ Industrial poisoning by compounds of the aromatic series.” J. Ind. Hygi. 200–212 (1919).
Hancock, G., A. E. Moffitt, Jr., and E. B. Hay, “Hematological findings among workers exposed to benzene at a
coke oven by-product recovery facility,” Arch. Environ. Health 39(6): 414–418 (1984).
Kipen, H. M., R. P. Cody, K. S. Crump, B. C. Allen, and B. D. Goldstein, “ Hematological effects of benzene: A
thirty-five year longitudinal study of rubber workers,” Toxicol. Ind. Health 4: 411–430 (1988).
Peterson, J. E., and R. D. Stewart, “Absorption and elimination of carbon monoxide by inactive young men.” Arch.
Environ. Health 21: 165–171 (1970).
Rinsky, R. A., A. B. Smith, R. Hornung, T. G. Filloon, R. J. Young, A. H. Okun, and P. J. Landrigan, “ Benzene and
Leukemia. An epidemiologic risk assessment,” N. Engl. J. Med. 316: 1044–1050 (1987).
Stewart, R. D., “The effects of low concentrations of carbon monoxide in man,” Scand. J. Respir. Dis. Suppl. 91:
56–62 (1974).
Yin, S N., Q. Li, Y. Liu, F. Tian, C. Du, and C. Jin. “Occupational exposure to benzene in China,” Br. J. Ind. Med.
44: 192–195 (1987).
REFERENCES AND SUGGESTED READING
109
5
Hepatotoxicity: Toxic Effects on the
Liver
HEPATOTOXICITY: TOXIC EFFECTS ON THE LIVER
STEPHEN M. ROBERTS, ROBERT C. JAMES, AND MICHAEL R. FRANKLIN
This chapter will familiarize the reader with
•
The basis of liver injury
•
Normal liver functions
•
The role the liver plays in certain chemical-induced toxicities
•
Types of liver injury
•
Evaluation of liver injury
•
Specific chemicals that are hepatotoxic
5.1 THE PHYSIOLOGIC AND MORPHOLOGIC BASES OF LIVER INJURY
Physiologic Considerations
The liver is the largest organ in the body, accounting for about 5 percent of total body mass. It is often
the target organ of chemical-induced tissue injury, a fact recognized for over 100 years. While the
chemicals toxic to the liver and the mechanisms of their toxicity are numerous and varied, several basic
factors underlie the liver’s susceptibility to chemical attack.
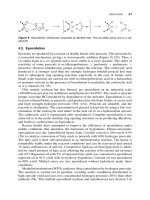
First, the liver maintains a unique position within the circulatory system. As Figure 5.1 shows, the
liver effectively “filters” the blood coming from the gastrointestinal tract and abdominal space before
this blood is pumped through the lungs and into the general circulation. This unique position in the
circulatory system aids the liver in its normal functions, which include (1) carbohydrate storage and
metabolism; (2) metabolism of hormones, endogenous wastes, and foreign chemicals; (3) synthesis of
blood proteins; (4) urea formation; (5) metabolism of fats; and (6) bile formation. When drugs or
chemicals are absorbed from the gastrointestinal tract, virtually all of the absorbed dose must pass
through the liver before being distributed through the bloodstream to the rest of the body. Once a
chemical reaches the general circulation, regardless of the route of absorption, it is still subject to
extraction and metabolism by the liver. The liver receives nearly 30 percent of cardiac output and, at
any given time, 10–15 percent of total blood volume is present in the liver. Consequently, it is difficult
for any drug or chemical to escape contact with the liver, an important factor in the role of the liver in
removing foreign chemicals.
The liver’s prominence causes it to have increased vulnerability to toxic attack. The liver can
particularly affect, or be affected by, chemicals ingested orally or administered intraperitoneally (i.e.,
into the abdominal cavity) because it is the first organ perfused by blood containing the chemical. As
discussed in Chapter 2, rapid and extensive removal of the chemical by the liver can drastically reduce
the amount of drug reaching the general circulation—termed the
first-pass effect
. Being the first organ
111
Principles of Toxicology: Environmental and Industrial Applications, Second Edition
, Edited by Phillip L. Williams,
Robert C. James, and Stephen M. Roberts.
ISBN 0-471-29321-0 © 2000 John Wiley & Sons, Inc.
encountered by a drug or chemical after absorption from the gastrointestinal tract or peritoneal space
also means that the liver often sees potential toxicants at their highest concentrations. The same drug
or chemical at the same dose absorbed from the lungs or through the skin, for example, may be less
toxic to the liver because the concentrations in blood reaching the liver are lower, from both dilution
and distribution to other organs and tissues.
Figure 5.1 The liver maintains a unique position within the circulatory system.
112
HEPATOTOXICITY: TOXIC EFFECTS ON THE LIVER
A second reason for the susceptibility of the liver to chemical attack is that it is the primary organ
for the biotransformation of chemicals within the body. As discussed in Chapter 3, the desired net
outcome of the biotransformation process is generally to alter the chemical in such a way that it is (1)
no longer biologically active within the body and (2) more polar and water-soluble and, consequently,
more easily excreted from the body. Thus, in most instances, the liver acts as a
detoxification
organ. It
lowers the biological activity and blood concentrations of a chemical that might otherwise accumulate
to toxic levels within the body. For example, it has been estimated that the time required to excrete
one-half of a single dose of benzene would be about 100 years if the liver did not metabolize it. The
primary disadvantage of the liver’s role as the main organ metabolizing chemicals, however, is that
toxic reactive chemicals or short-lived intermediates can be formed during the biotransformation
process. Of course, the liver, as the site of formation of these bioactivated forms of the chemical, usually
receives the brunt of their effects.
Morphologic Considerations
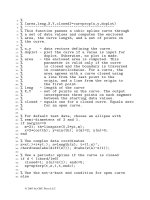
The liver can be described as a large mass of cells packed around vascular trees of arteries and veins
(see Figure 5.2). Blood supply to the liver comes from the hepatic artery and the portal vein, the former
normally supplying about 20 percent of blood reaching the liver and the latter about 80 percent.
Terminal branches of the hepatic artery and portal vein are found together with the bile duct (Figure
5.2). In cross section, these three vessels are called the
portal triad
. Blood is collected in the terminal
hepatic venules, which drain into the hepatic vein. The functional microanatomy can be viewed in
different ways. In one view, the basic unit of the liver is termed the
lobule
. Blood enters the lobule
Bile
canaliculi
Sinusoid
Hepatic
artery
Bile
ductule
Portal
vein
Central
vein
Opening of
sinusoid
Hepatic
lamina
Fenestration
in lamina
Figure 5.2 Hepatic architecture, showing arrangement of blood vessels and cords of liver cells. Reproduced with
permission from Textbook of Human Anatomy, Second Edition, C.V. Mosby Co., St. Louis, MO, 1976.
5.1 THE PHYSIOLOGIC AND MORPHOLOGIC BASES OF LIVER INJURY
113
from the hepatic artery and portal veins, traverses the lobule through hepatic sinusoids, and exits
through a hepatic venule. In the typical lobule view, cells near the portal vein are termed
periportal
,
while those near the hepatic venule are termed
perivenular
. The hepatic venule is visualized as
occupying the center of the lobule, and cells surrounding the venule are sometimes termed
centrilobu-
lar
, while those farther away, near the portal triad, are called
peripheral
lobular
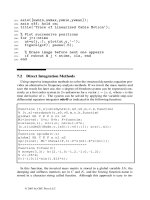
. Rappaport proposed
a different view of hepatic anatomy in which the basic anatomical unit is called the
simple liver acinus
.
In this view (Figure 5.3, left), cells within the acinus are divided into zones. The area adjacent to small
vessels radiating from the portal triad is zone 1. Cells in zone 1 are first to receive blood through the
sinusoids. Blood then travels past cells in zones 2 and 3 before reaching the hepatic venule. As can be
seen in Figure 5.3, zone 3 is roughly analogous to the centrilobular region of the classic lobule, since
it is closest to the central vein. Zone 3 cells from adjacent acini form a star-shaped pattern around this
vessel. Zone 1 cells surround the terminal afferent branches of the portal vein and hepatic artery, and
are often stated as occupying the
periportal
region, while cells between zones 1 and 3 (i.e., in zone 2)
are said to occupy the
midzonal
region. A modification of the typical lobule and acinar models has
been provided by Lamers and colleagues (1989) (Figure 5.3, right). Based on histopathologic and
immunohistochemical studies, they propose that zone 3 should be viewed as a circular, rather than
star-shaped, region surrounding the central vein. Zone 1 cells surround the portal tracts, and zone 1
cells from adjacent acini merge to form a reticular pattern. As with the Rappaport (1979) model, cells
in zone 3 may be described as centrilobular (matching closely the classic lobular terminology), cells
in zone 1 as periportal, and the cells in zone 2 in between are called midzonal.
Each of these viewpoints has in common a recognition that the cells closest to the arterial blood
supply receive the highest concentrations of oxygen and nutrients. As blood traverses the lobule,
concentrations of oxygen and nutrients diminish. Differences in oxygen tension and nutrient levels are
reflected in differing morphology and enzymatic content between cells in zones 1 and 3. Consistent
with their greater access to oxygen, hepatocytes in zone 1 are better adapted to aerobic metabolism.
They have greater respiratory activity, greater amino acid utilization, and higher levels of fatty acid
oxidation. Glucose formation from gluconeogenesis and from breakdown of glycogen predominate in
zone 1 cells, and most secretion of bile acids occurs here. On the other hand, most forms of the
biotransformation enzyme cytochrome P450 are found in highest concentrations in zone 3 cells. As
the site of biotransformation for most drugs and chemicals, zone 3 cells have greatest responsibility
for their detoxification. This also means that zone 3 cells are often the primary targets for chemicals
that are bioactivated by these enzymes to toxic metabolites in the liver.
Figure 5.3 Alternative views of the liver acinus. Reproduced with permission from Lamers et al., 1989.
114
HEPATOTOXICITY: TOXIC EFFECTS ON THE LIVER
There are several types of liver cells.
Hepatocytes
, or
parenchymal cells
, constitute approximately
75 percent of the total cells in the human liver. They are relatively large cells and make up the bulk of
the hepatic lobule. By virtue of their numbers and their extensive xenobiotic metabolizing activity,
these cells are the principal targets for hepatotoxic chemicals. The sinusoids are lined with endothelial
cells. These cells are small but numerous, making up most of the remaining cells in the liver. The
hepatic microvasculature also contains resident macrophages, called
Kupffer cells
. Although compara-
tively few in number, these cells play an important role in phagocytizing microorganisms and foreign
particulates in the blood. While these cells are a part of the liver, they are also part of the immune
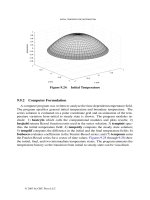
Figure 5.4 Liver section from mouse given an hepatotoxic dose of acetaminophen. With acetaminophen, liver
cell swelling and death characteristically occurs in regions around the central vein (Zone 3, arrow); cells near the
portal triad (Zone 1, arrow head) are spared.
5.1 THE PHYSIOLOGIC AND MORPHOLOGIC BASES OF LIVER INJURY
115
system. They are capable of releasing reactive oxygen species and cytokines, and play an important
role in inflammatory responses in the liver. The liver also contains
Ito cells
(also termed
fat-storing
cells, parasinusoidal cells,
or
stellate cells
) which lie between parenchymal and endothelial cells. These
cells appear to be important in producing collagen and in vitamin A storage and metabolism.
5.2 TYPES OF LIVER INJURY
All chemicals do not produce the same type of liver injury. Rather, the type of lesion or effect observed
is dependent on the chemical involved, the dose, and the duration of exposure. Some types of injury
are the result of acute toxicity to the liver, while others appear only after chronic exposure or treatment.
Basic types of liver injury include the anomalies described in the following paragraphs.
Hepatocellular Degeneration and Death
Many hepatotoxicants are capable of injuring liver cells directly, leading to cellular degeneration and
death. A variety of organelles and structures within the liver cell can be affected by chemicals. Principal
targets include the following:
1.
Mitochondria.
These organelles are important for energy metabolism and synthesis of ATP.
They also accumulate and release calcium, and play an important role in calcium homeostasis within
the cell. When mitochondria become damaged, they often lose the ability to regulate solute and water
balance, and undergo swelling that can be observed microscopically. Mitochondrial membranes can
become distorted or rupture, and the density of the mitochondrial matrix is altered. Examples of
chemicals that show damage to hepatic mitochondria include carbon tetrachloride, cocaine, dichlo-
roethylene, ethionine, hydrazine, and phosphorus.
2.
Plasma Membrane.
The plasma membrane surrounds the hepatocyte and is critically important
in maintaining the ion balance between the cytoplasm and the external environment. This ion balance
can be disrupted by damage to plasma membrane ion pumps, or by loss of membrane integrity causing
ions to leak in or out of the cell following their concentration gradients. Loss of ionic control can cause
a net movement of water into the cell, resulting in cell swelling. Blisters or “ blebs” in the plasma
membrane may also occur in response to chemical toxicants. Examples of chemicals that show damage
to plasma membrane include acetaminophen, ethanol, mercurials, and phalloidin.
3.
Endoplasmic Reticulum.
The endoplasmic reticulum is responsible for synthesis of proteins
and phospholipids in the hepatocyte. It is the principal site of biotransformation of foreign chemicals
and, along with the mitochondria, sequesters and releases calcium ions to promote calcium homeosta-
sis. As discussed in Chapter 3, hepatic biotransformation enzyme activity is substantially increased in
response to treatment or exposure to a variety of chemicals. Many of these enzymes, including
cytochrome P450, are located in the endoplasmic reticulum, which undergoes proliferation as part of
the enzyme induction process. Because the endoplasmic reticulum is the site within the cell of most
oxidative metabolism of foreign (xenobiotic) chemicals, it is also the site where reactive metabolites
from these chemicals are formed. This makes it a logical target for toxicity for chemicals that produce
injury through this mechanism. Morphologically, damage to the endoplasmic reticulum often appears
in the form of dilation. Examples of chemicals that show damage to endoplasmic reticulum include
acetaminophen, bromobenzene, carbon tetrachloride, and cocaine.
4.
Nucleus.
There are several ways in which the nuclei can be damaged by chemical toxicants.
Some chemicals or their metabolites can bind to DNA, producing mutations (see Chapter 12). These
mutations can alter critical functions of the cell leading to cell death, or can contribute to malignant
transformation of the cell to produce cancer. Some chemicals appear to cause activation of endonu-
cleases, enzymes located in the nucleus that digest chromatin material. This leads to uncontrolled
digestion of the cell’s DNA—obviously not conducive to normal cell functioning. Some chemicals
116
HEPATOTOXICITY: TOXIC EFFECTS ON THE LIVER
cause disarrangement of chromatin material within the nucleus. Morphologically, damage to the
nucleus appears as alterations in the nuclear envelope, in chromatin structure, and in arrangement of
nucleoli. Examples of chemicals that produce nuclear alterations include aflatoxin B, beryllium,
ethionine, galactosamine, and nitrosamines.
5.
Lysosomes.
These subcellular structures contain digestive enzymes (e.g., proteases) and are
important in degrading damaged or aging cellular constituents. In hepatocytes injured by chemical
toxicants, their numbers and size are often increased. Typically, this is not because they are a direct
target for chemical attack, but rather reflects the response of the cell to the need to remove increased
levels of damaged cellular materials caused by the chemical.
Not all hepatocellular toxicity leads to cell death. Cells may display a variety of morphologic
abnormalities in response to chemical insult and still recover. These include cell swelling, dilated
endoplasmic reticulum, condensed mitochondria and chromatin material in the nucleus, and blebs on
the plasma membrane. More severe morphological changes are indicative that the cell will not recover,
and will proceed to cell death, that is, undergo
necrosis
. Examples of morphological signs of necrosis
are massive swelling of the cell, marked clumping of nuclear chromatin, extreme swelling of
mitochondria, breaks in the plasma membrane, and the formation of cell fragments.
Necrosis from hepatotoxic chemicals can occur within distinct zones in the liver, be distributed
diffusely, or occur massively. Many chemicals produce a zonal necrosis; that is, necrosis is confined
to a specific zone of the hepatic acinus. Table 5.1 provides examples of drugs and chemicals that
produce hepatic necrosis and the characteristic zone in which the lesion occurs. Figure 5.4 shows an
example of zone 3 hepatic necrosis from acetaminophen. Confinement of the lesion to a specific zone
is thought to be a consequence of the mechanism of toxicity of these agents and the balance of activating
and inactivating enzymes or cofactors. Interestingly, there are a few chemicals for which the zone of
necrosis can be altered by treatment with other chemicals. These include cocaine, which normally
produces hepatic necrosis in zone 2 or 3 in mice, but in phenobarbital-pretreated animals causes
necrosis in zone 1. Limited observations of liver sections from humans experiencing cocaine hepato-
toxicity are consistent with this shift produced by barbiturates. The reason for the change in site of
necrosis with these chemicals is unknown.
Necrotic cells produced by some chemicals are distributed diffusely throughout the liver, rather
than being localized in acinar zones. Galactosamine and the drug methylphenidate are examples of
chemicals that produce a diffuse necrosis. Diffuse necrosis is also seen in viral hepatitis and some
forms of idiosyncratic liver injury. The extent of necrosis can vary considerably. When most of the
cells of the liver are involved, this is termed
massive necrosis
. As the name implies, this involves
destruction of most or all of the hepatic acinus. Not all the acini in the liver are necessarily affected to
the same extent, but at least some acini will have necrosis that extends across the lobule from the portal
triad to the hepatic vein, called
bridging necrosis
. Massive necrosis is not so much a characteristic of
specific hepatotoxic chemicals as of their dose.
Because of the remarkable ability of the liver to regenerate itself, it is able to withstand moderate
zonal or diffuse necrosis. Over a period of several days, necrotic cells are removed and replaced with
new cells, restoring normal hepatic architecture and function. If the number of damaged cells is too
great, however, the liver’s capacity to restore itself becomes overwhelmed, leading to hepatic failure
and death.
Another form of cell death is
apoptosis
, or programmed cell death. Apoptosis is a normal
physiological process used by the body to remove cells when they are no longer needed or have become
functionally abnormal. In apoptosis, the cell “ commits suicide” through activation of its endonu-
cleases, destroying its DNA. Apoptotic cells are morphologically distinct from cells undergoing
necrosis as described above. Unlike cells undergoing necrosis, which swell and release their cellular
contents, apoptotic cells generally retain plasma membrane integrity and shrink, resulting in condensed
cytoplasm and dense chromatin in the nucleus. There are normally few apoptotic cells in liver, but the
number may be increased in response to some hepatotoxic chemicals, notably thioacetamine and
ethanol. Also, some chemicals produce hypertrophy, or growth of the liver beyond its normal size.
5.2 TYPES OF LIVER INJURY
117
TABLE 5.1 Drugs and Chemicals that Produce Zonal Hepatic Necrosis
Chemical
Site of Necrosis
Zone1 Zone 2 Zone 3
Acetaminophen X
Aflatoxin X X
Allyl alcohol X
Alloxan X
α
-Amanitin X
Arsenic, inorganic X
Beryllium X
Botulinum toxin X
Bromobenzene X
Bromotrichoromethane X
Carbon tetrachloride X
Chlorobenzenes X
Chloroform X
Chloroprene X
Cocaine
a
XX
Dichlorpropane X
Dioxane X
DDT X
Dimethylnitrosamine X
Dinitrobenzene X
Dinitrotoluene X
Divinyl ether X
Ethylene dibromide X
Ethylene dichloride X
Ferrous sulfate X
Fluoroacetate X
Iodobenzene X
Iodoform X
Manganese compounds X
Methylchloroform X
Naphthalene X
Ngaione X
Paraquat X X
Phalloidin X
Pyridine X
Pyrrolidizine alkaloids X
Rubratoxin X
Tannic acid X
Thioacetamide X
Urethane X
Xylidine X
Source:
Adapted from Cullen and Reubner, 1991.
a
Necrosis is shifted to zone 1 in phenobarbital-pretreated animals.
118
HEPATOTOXICITY: TOXIC EFFECTS ON THE LIVER
Examples include lead nitrate and phenobarbital. When exposure or treatment with these agents has
ended, the liver will return to its normal size. During this phase, the number of apoptotic cells is
increased, reflecting an effort by the liver to reduce its size, in part by eliminating some of its cells.
Drugs and chemicals can produce hepatocellular degeneration and death by many possible
mechanisms. For some hepatotoxicants, the mechanism of toxicity is reasonably well established. For
example, galactosamine is thought to cause cell death by depleting uridine triphosphate, which is
essential for synthesis of membrane glycoproteins. For most hepatotoxicants, however, key biochemi-
cal effects responsible for hepatocellular necrosis remain uncertain. The search for a broadly applicable
mechanism of hepatotoxicity has yielded several candidates:
Lipid Peroxidation
Many hepatotoxicants generate free radicals in the liver. In some cases, such as
carbon tetrachloride, the free radicals are breakdown products of the chemical generated by its
cytochrome P450-mediated metabolism in the liver. In other cases, the chemical causes a disruption
in oxidative metabolism within the cell, leading to the generation of reactive oxygen species. An
important potential consequence of free-radical formation is the occurrence of lipid peroxidation in
membranes within the cell. Lipid peroxidation occurs when free radicals attack the unsaturated bonds
of fatty acids, particularly those in phospholipids. The free radical reacts with the fatty acid carbon
chain, abstracting a hydrogen. This causes a fatty acid carbon to become a radical, with rearrangement
of double bonds in the fatty acid carbon chain. This carbon radical in the fatty acid reacts with oxygen
in a series of steps to produce a lipid hydroperoxide and a lipid radical that can then react with another
fatty acid carbon. The peroxidation of the lipid becomes a chain reaction, resulting in fragmentation
and destruction of the lipid. Because of the importance of phospholipids in membrane structure, the
principal consequence of lipid peroxidation for the cell is loss of membrane function. The reactive
products generated by lipid peroxidation can interact with other components of the cell as well, and
this also could contribute to toxicity.
The list of chemicals that produce lipid peroxidation as part of their hepatotoxic effects is extensive,
and includes halogenated hydrocarbons (e.g., carbon tetrachloride, chloroform, bromobenzene,
tetrachloroethene), alcohols (e.g., ethanol, isopropanol), hydroperoxides (e.g.,
tert
-butylhydroperox-
ide), herbicides (e.g., paraquat), and a variety of other compounds (e.g., acrylonitrile, cadmium,
cocaine, iodoacetamide, chloroacetamide, sodium vanadate). Consequently, it is an attractive common
mechanism of hepatotoxicity. There is some question, however, as to whether it is the most important
mechanism of toxicity for these chemicals. For some of these hepatotoxic compounds, experiments
have been conducted in which lipid peroxidation was blocked by concomitant-treatment with an
antioxidant. In many cases, hepatotoxicity still occurred. This argues that for at least some agents, lipid
peroxidation may contribute to their hepatotoxicity, but is not sufficient to explain all of their toxic
effects on the liver.
Irreversible Binding to Macromolecules
Most of the conventional hepatotoxicants must be meta-
bolized in order to produce liver toxicity, producing one or more chemically reactive metabolites. These
reactive metabolites bind irreversibly to cellular macromolecules—primarily proteins, but in some
cases also lipids and DNA. This binding precedes most manifestations of toxicity, and the extent of
binding often correlates well with toxicity. In fact, histopathology studies with some of these chemicals
have found that only cells with detectable reactive metabolite binding undergo necrosis. Examples of
hepatotoxic chemicals that produce reactive metabolites include acetaminophen, bromobenzene,
carbon tetrachloride, chloroform, cocaine, and trichloroethylene.
It is certainly plausible that irreversible binding of a toxicant to a critical protein or other
macromolecule in the cell could lead to loss of its function, and the fact that binding precedes most,
if not all, toxic responses in the cell make it a logical initiating event. However, demonstrating precisely
how irreversible binding causes cell death has been extremely challenging. Several studies have been
conducted attempting to identify the macromolecular targets for binding and to determine whether this
binding results in an effect that could lead to cell death. Acetaminophen, in particular, has been studied
in this regard. While several proteins bound by the acetaminophen reactive metabolite,
N
-acetyl-
p
-
5.2 TYPES OF LIVER INJURY
119
benzoquinone imine, have been identified, none as yet has been clearly shown to be instrumental in
acetaminophen-induced hepatic necrosis. Without identification of the critical target(s) for irreversible
binding for hepatotoxicants, this remains an attractive but unproven mechanism.
Loss of Calcium Homeostasis
Intracellular calcium is important in regulating a variety of critical
intracellular processes, and the concentration of calcium within the cell is normally tightly regulated.
The plasma membrane actively extrudes calcium ion from the cell to maintain cytosolic concentrations
at a low level compared with the external environment (the ratio of intracellular to extracellular
concentration is about 1:10,000). Both the mitochondria and endoplasmic reticulum are capable of
sequestering and releasing calcium ion as needed to modulate calcium concentrations for normal cell
functioning. Loss of control of intracellular calcium can lead to a sustained rise in intracellular calcium
levels, which, in turn, disrupts mitochondrial metabolism and ATP synthesis, damages microfilaments
used to support cell structure, and activates degradative enzymes within the cell. These events could
easily account for cell death from hepatotoxic chemicals.
Early studies of toxic effects of chemicals on liver cells in culture suggested that an influx of calcium
from outside the cell (e.g., from plasma membrane failure) was responsible for their toxic effects. Later
experiments showed that this was probably not the case, but nonetheless supported disregulation of
intracellular calcium as a key event in toxicity. Intracellular calcium levels were observed to rise
substantially in response to a number of hepatotoxicants, apparently due to chemical effects on
mitochondria and/or the endoplasmic reticulum leading to loss of control of intracellular calcium
stores. Impaired extrusion of calcium out of the cell by the plasma membrane might also be important,
at least for some chemicals. In general, increases in intracellular calcium preceded losses of viability,
suggesting a cause–effect relationship. It is sometimes difficult, however, to discern to what extent
elevated calcium levels are the cause of, or merely the result of, cytotoxicity.
Immune Reactions
This mechanism of hepatotoxicity is not common, but nonetheless important.
Characteristically, an initial exposure is required that does not produce significant hepatotoxicity—a
sensitizing event. Subsequent exposure to the drug or chemical can lead to profound liver toxicity that
may be accompanied by hepatic inflammation. Consistent with a hypersensitivity reaction, there is
little evidence of a dose–response relationship, and even small doses can trigger a reaction. This
response is usually rare and difficult to predict; hence it is often considered an idiosyncratic reaction.
Typically, this kind of hepatotoxicity for a drug or chemical is very difficult to demonstrate in laboratory
animals, and unfortunately becomes known only after widespread use or exposure in humans.
Perhaps the most familiar example of a drug or chemical producing this type of hepatoxicity is the
general anesthetic halothane. Studies suggest that halothane is metabolized to a reactive metabolite
that binds with proteins. These proteins become expressed on the cell surface where they are recognized
by the immune system as being foreign. The immune system then mounts a cell-mediated response,
resulting in destruction of the hepatocytes. This response, called
halothane hepatitis
, seldom occurs
(only about 1 in 10,000 anesthetic administrations in adults) but has a 50 percent mortality rate. A
similar phenomenon has been observed with other drugs, including diclofenac.
Fatty Liver
Many chemicals produce an accumulation of lipids in the liver, called
fatty liver
or
steatosis
. Examples
of chemicals that produce fatty liver are provided in Table 5.2. Just as hepatocellular necrosis
preferentially occurs in specific acinar zones in response to certain chemicals, so does fatty liver. For
example, zone 1 is the primary site of lipid accumulation from white phosphorus, while zone 3 is where
most of the lipid accumulation is observed with tetracycline and ethanol. The lipid accumulates in
vacuoles within the cytoplasm, and these vacuoles are usually present as either one large, clear vacuole
(called
macrovesicular steatosis
) or numerous small vacuoles (
microvesicular steatosis
). The type of
steatosis (macro- or microvesicular) is characteristic of specific hepatotoxicants and, in some cases,
of certain diseases or conditions. For example, microvesicular steatosis has been associated with
120
HEPATOTOXICITY: TOXIC EFFECTS ON THE LIVER
tetracycline, valproic acid, salicylates, aflatoxin, dimethylformamide, and some of the antiviral
nucleoside analogs used to treat HIV. It is also associated with Reye’s syndrome and fatty liver of
pregnancy. Macrovesicular steatosis has been associated with antimony, barium salts, carbon disulfide,
dichloroethylene, ethanol, hydrazine, methyl and ethyl bromide, thallium, and uranium compounds.
There are several potential chemical effects that can give rise to accumulation of lipids in the cell.
These include:
1.
Inhibition of Lipoprotein Synthesis.
A number of chemicals are capable of inhibiting synthesis
of the protein moiety needed for synthesis of lipoproteins in the liver. These include carbon
tetrachloride, ethionine, and puromycin.
2.
Decreased Conjugation of Triglycerides with Lipoproteins.
Another critical step in lipoprotein
synthesis is conjugation of the protein moiety with triglyceride. Carbon tetrachloride, for
example, can interfere with this step.
3.
Interference with Very-Low-Density Lipoprotein (VLDL) Transfer
. Inhibition of transfer of
VLDL out of the cell results in its accumulation. Tetracycline is an example of an agent that
interferes with this transfer.
4.
Impaired Oxidation of Lipids by Mitochondria.
Oxidation of nonesterified fatty acids is an
important aspect of their hepatocellular metabolism, and decreased oxidation can contribute
to their accumulation within the cell. Carbon tetrachloride, ethionine, and white phosphorus
have been shown to inhibit this oxidation.
5.
Increased Synthesis of Fatty Acids.
The liver is capable of synthesizing fatty acids from
acetyl-CoA (coenzyme A), and increased fatty acid synthesis can increase the lipid burden of
the cells. Ethanol is an example of a chemical that produces this effect.
Other possible mechanisms might contribute to fatty liver, such as increased uptake of lipids from
the blood by the liver, but the role of these processes in drug- or chemical-induced steatosis is less
clear. The mechanisms listed above are not mutually exclusive. Indeed, it is likely that many of the
chemicals that produce steatosis do so by producing more than one of these effects.
Fatty liver may occur by itself, or in conjunction with hepatocellular necrosis. Many chemicals
produce a lesion that consists of both effects. Examples include: aflatoxins, amanitin, arsenic com-
pounds, bromobenzene, carbon tetrachloride, chloroform, dimethylnitrosamine, dinitrotoluene, DDT,
dichloropropane, naphthalene, pyrrolizidine alkaloids, and tetrachloroethane. Drug- or chemical-in-
duced steatosis is reversible when exposure to the agent is stopped.
Phospholipidosis
is a special form of steatosis. It results from accumulation of phospholipids in
the hepatocyte, and can be caused by some drugs as well as by inborn errors in phospholipid
metabolism. Liver sections from patients with phospholipidosis reveal enlarged hepatocytes with
TABLE 5.2 Drugs and Chemicals that Produce Fatty Liver
Antimony Ethyl chloride
Barium salts Hydrazine
Borates Methyl bromide
Carbon disulfide Orotic acid
Chromates Puromycin
Dichloroethylene Safrole
Dimethylhydrazine Tetracycline
Ethanol Thallium compounds
Ethionine Uranium compounds
Ethyl bromide White phosphorus
5.2 TYPES OF LIVER INJURY
121
“ foamy” cytoplasm. Often this condition progresses to cirrhosis. Examples of drugs associated with
phospholipidosis include amiodarone, chlorphentermine, and 4,4′-diethylaminoethoxyhexoestrol.
Cholestasis
The term
cholestasis
refers to decreased or arrested bile flow. Many drugs and chemicals are able to
produce cholestatic injury, and examples are listed in Table 5.3. There are several potential causes of
impaired bile flow, many of which can become the basis for drug- or chemical-induced cholestasis.
Some of these are related to loss of integrity of the canalicular system that collects bile and carries it
to the gall bladder, while others are related to the formation and secretion of bile. For example,
α-naphthylisothiocyanate disrupts the tight junctions between hepatocytes that help form the canali-
culi, the smallest vessels of the bile collection system. This causes a leakage of bile contents out of the
canaliculi into the sinusoids. Other toxicants, such as methylene dianiline and paraquat, impede bile
flow by damaging the bile ducts. The primary driving force for bile formation is the secretion of bile
acids into the canalicular lumen. This requires uptake of bile acids from the blood into hepatocytes,
and then transport into the canaliculus. Anabolic steroids are an example of a class of compounds that
produce cholestatic injury by inhibiting these transport processes.
Some cholestatic injury can be expected whenever there is severe hepatic injury of any type. This
is because normal bile flow requires functioning hepatocytes as well as a reasonably intact cellular
architecture in the liver. Whenever this is disrupted, some impairment of bile flow can be expected as
a secondary consequence. Many agents produce primarily hepatic necrosis with perhaps limited
cholestasis (see Table 5.1), others produce primarily cholestasis with some necrosis (chlorpromazine
and erythromycin are examples), and still others are capable of producing cholestasis with little or no
damage to the hepatocytes. The contraceptive and anabolic steroids are examples of this last category
of agents.
Vascular Injury
Cells lining the vasculature within the liver are also potential targets for hepatotoxicants. Injury of
vascular cells leads to occlusion (impaired blood flow), which in turn leads to hypoxia. Cells in zone
3 are most vulnerable, since the oxygenation of blood reaching these cells is low even under normal
conditions. Typically, hypoxia results in necrosis, and continuing injury over time leads to fibrosis.
Severe cases can result in fatal congestive cirrhosis. There are several examples of chemicals known
TABLE 5.3 Drugs and Chemicals that Produce Cholestasis
Amitryptyline Ethanol
Ampicillin Haloperidol
Arsenicals, organic Imipramine
Barbiturates Methylene dianiline
Carbamazepine Methyltestosterone
Chlorpromazine
α
-Naphthylisothiocyanate
Cimetidine Norandrostenolone
Cyproheptadine Paraquat
4,4-Diaminodiphenylmethane Phalloidin
4,4-Diaminodiphenylamine Phenytoin
1,1-Dichloroethylene Prochlorperazine
Dinitrophenol Tolbutamide
Erythromycin estolate Troleandomycin
Estrogens
122
HEPATOTOXICITY: TOXIC EFFECTS ON THE LIVER
to produce hepatic
venoocclusive disease
, including many of natural origin such as pyrrolizidine
alkaloids in herbal teas. Oral contraceptives and some anticancer drugs have also been associated with
this effect.
Peliosis hepatis
is another vascular lesion characterized by the presence of large, blood-filled
cavities. It is unclear why these cavities form, but there is reason to suspect that it may be due to a
weakening of sinusoidal supporting membranes. Use of anabolic steroids has been associated with this
effect. Although patients with peliosis hepatis are usually without symptoms, the cavities occasionally
rupture causing bleeding into the abdominal cavity.
Cirrhosis
Chronic liver injury often results in the accumulation of collagen fibers within the liver, leading to
fibrosis. Fibrotic tissue accumulates with repeated hepatic insult, making it difficult for the liver to
replace damaged cells and still maintain normal hepatic architecture. Fibrous tissue begins to form
walls separating cells. Distortions in hepatic microcirculation cause cells to become hypoxic and die,
leading to more fibrotic scar tissue. Ultimately, the organization of the liver is reduced to nodules of
regenerating hepatocytes surrounded by walls of fibrous tissue. This condition is called
cirrhosis
.
Hepatic cirrhosis is irreversible and carries with it substantial medical risks. Blood flow through the
liver becomes obstructed, leading to portal hypertension. To relieve this pressure, blood is diverted
past the liver through various shunts not well suited for this purpose. It is common for vessels associated
with these shunts to rupture, leading to internal hemorrhage. Even without hemorrhagic episodes, the
liver may continue to decline until hepatic failure occurs.
The ability of chronic ethanol ingestion to produce cirrhosis is widely appreciated. Occupational
exposures to carbon tetrachloride, trinitrotoluene, tetrachloroethane, and dimethylnitrosamine have
also been implicated as causing cirrhosis, as well as the medical use of arsenicals and methotrexate.
Some drugs (e.g., methyldopa, nitrofurantoin, isoniazid, diclofenac) produce an idiosyncratic reaction
resembling viral hepatitis. This condition, termed
chronic active hepatitis
, can also lead to cirrhosis if
the drug is not withdrawn.
Tumors
Many chemicals are capable of producing tumors in the liver, particularly in laboratory rodents. In
fact, in cancer rodent bioassays for carcinogenicity, the liver is the most common site of tumorigenicity.
Hepatic tumors may be benign or malignant. Conceptually, the distinction between them is that benign
tumors are well circumscribed and do not metastasize (i.e., do not invade other tissues). Malignant
tumors, on the other hand, are poorly circumscribed and are highly invasive (see Chapter 13 for
additional discussion on benign and malignant tumors). Benign tumors, despite their name, are capable
of producing morbidity and mortality. However, they are easier to manage and have a much better
prognosis than malignant tumors.
Tumors are also classified by the tissue of origin, that is, whether they arise from epithelial or
mesenchymal tissue, and by the specific cell type from which they originate. The nomenclature for
naming tumors is complex, and the reader is referred elsewhere for a complete discussion of the topic.
Basically, malignant tumors arising from epithelial tissue are termed
carcinomas
, while malignant
tumors of mesenchymal origin are
sarcomas
. Thus, malignant tumors derived from hepatocytes, which
are of epithelial origin, are termed
hepatocellular carcinomas
. Malignant tumors from bile duct cells,
also of epi thelial origin, are termed
cholangiocarcinomas
(the prefix
cholangio-
refers to the bile ducts).
Cells of the vascular lining are of mesenchymal origin. Consequently, a malignant tumor in the liver
arising from these cells may be called
hemangiosarcoma
. Benign tumors are also named on the basis
of tissue of origin and their appearance. For example, benign tumors of epithelial origin with gland,
or glandlike structures are called
adenomas
, and in the liver these can occur among hepatocytes or bile
duct cells. Benign tumors of fibrotic cell origin are termed
fibromas
, and those in the bile ducts are
called
cholangiofibromas
.
5.2 TYPES OF LIVER INJURY
123
To make things more complicated, cells go through a series of morphological changes as they
progress to become a benign or malignant tumor. Thus, groups of cells that represent proliferation of
liver tissue, but are not (or not yet) tumors, may be described as nodular hyperplasia, focal hepatocel-
lular hyperplasia, or foci of hepatocellular alteration, depending on their morphological characteristics.
The foci of hepatocellular alteration represent the earliest stages that can be detected microscopically.
These foci are small groups of cells that are abnormal, but have no distinct boundary separating them
from adjacent cells. Their growth rate is such that they are producing little or no compression of
surrounding cells. The abnormalities are subtle at this stage, and special stains and markers are
sometimes used to help visualize them. Nodular hyperplasia is more readily observed; the group of
cells is more circumscribed and compression of adjacent cells is apparent. These cells are thought to
represent an intermediate step in tumor development. The significance of these lesions is not that they
are associated with any clinical signs or symptoms of disease, but rather that they may represent an
area from which a tumor may develop. Consequently, their appearance is important in the assessment
of the ability of a drug or chemical to cause cancer. For most chemicals, only a very small
percentage—or perhaps none—of the neoplastic areas will go on to produce a malignant tumor.
Consequently, the issue of how to use data regarding the appearance of these lesions in the assessment
of carcinogencity of a chemical is one of considerable discussion and debate among toxicologists.
Liver tumors from chemical exposure can arise through numerous mechanisms. Some hepatocar-
cinogens form DNA adducts leading to mutations. Nitrosoureas and nitrosamines are examples of
hepatocarcinogens thought to produce tumors through this mechanism (see also Chapters 12 and 13
for further discussion of genotoxicity and carcinogenicity). Many chemicals that produce liver tumors
are not genotoxic, however, and appear to work through epigenetic mechanisms. Nongenotoxic
hepatocarcinogens are many and diverse, and include tetrachlorodibenzo-
p
-dioxin, sex steroids,
synthetic antioxidants, some hepatic enzyme inducing agents (e.g., phenobarbital), and peroxisome
proliferators (e.g., clofibrate). A discussion of the mechanisms underlying epigenetic carcinogenesis
(e.g., inhibition of cell-to-cell communication, recurrent cellular injury, receptor interactions) is
beyond the scope of this chapter, and the reader is referred to Chapter 12 for more information on this
subject.
Despite the many chemicals found to produce benign and malignant liver tumors in mice and rats,
relatively few have been clearly associated with liver tumors in humans. Adenomas have been
associated with the use of contraceptive steroids, and clinical and epidemiologic studies implicate
anabolic steroids, arsenic, and thorium dioxide as causing hepatocellular carcinoma in humans.
Hemangiosarcoma is a rare tumor that has been strongly linked to occupational exposure to vinyl
chloride, and has also been associated with arsenic and thorium dioxide exposure.
5.3 EVALUATION OF LIVER INJURY
Symptoms of Liver Toxicity
As discussed above, liver injury may be either acute or chronic, and may involve liver cell death, hepatic
vascular injury, disruption of bile formation and/or flow, or the development of benign or malignant
tumors. Obviously, the signs and symptoms that accompany this array of types of liver injury can vary
significantly. There are some generalizations that can be made, however. Common symptoms of liver
injury include anorexia (loss of appetite), nausea, vomiting, fatigue, and abdominal tenderness.
Physical examination may reveal hepatomegaly (swelling of the liver) and ascites (the accumulation
of fluid in the abdominal space). Patients whose liver toxicity involves impaired biliary function may
develop
jaundice
, which results from the accumulation of bilirubin in the blood and tissues. Jaundice
will appear as a yellowish tint to the skin, mucous membranes, and eyes.
Pruritis
, or an itching sensation
in the skin, will often accompany the jaundice.
If the injury is particularly severe, it may lead to
fulminant hepatic failure
. When the liver fails,
death can occur in as little as 10 days. There are several complications associated with fulminant hepatic
124
HEPATOTOXICITY: TOXIC EFFECTS ON THE LIVER
failure. Because the liver is no longer able to produce clotting factor proteins, albumin, or glucose,
hemorrhage and hypoglycemia are common. Also, failure of the liver leads to renal failure and
deterioration of the central nervous system (
hepatic encephalopathy
). Inability to sustain blood
pressure and accumulation of fluid in the lungs may also result. Prognosis is poor for patients with
fulminant hepatic failure, with a mortality rate of about 90 percent.
Morphologic Evaluation
For laboratory animal studies of hepatotoxicity, histopathologic examination of liver tissue by light or
electron microscopy can be extremely valuable. Histopathologic evaluation can provide information
on the nature of the lesion and the regions of the liver affected. This, in turn, can provide insight as to
the mechanism of toxicity. For example, the presence of fatty liver would suggest that the chemical
may interfere with triglyceride metabolism and/or lipoprotein secretion by the liver. Hepatocellular
necrosis confined to the centrilobular region might suggest bioactivation of the chemical by cytochrome
P450, since most of the activity of this enzyme normally exists in centrilobular cells. Altered
morphology of mitochondria as an early event in toxicity might suggest that mitochondrial toxicity is
an important initiating event in the sequence of events leading up to cell death. Histopathologic
observations alone cannot establish the mechanism of toxicity, and additional experimentation would
be required to explore these hypotheses. Nevertheless, morphologic observation provides important
clues, and is an integral part of any comprehensive study of potential hepatotoxicity of a chemical.
In humans, morphologic evaluation of liver biopsies is sometimes used in the diagnosis and
management of chronic liver toxicity, particularly liver cancer. Also, noninvasive techniques such as
computerized tomography (CT) or magnetic resonance imaging (MRI) scans are used to detect liver
cancer, obstructive biliary injury, cirrhosis, and venoocclusive injury to the liver.
Blood Tests
A great deal of insight into the nature and extent of hepatic injury can often be gained through tests
on blood samples. There are two fundamental types of blood tests that can be performed. One type is
an assessment is based on measuring the functional capabilities of the liver. This can involve an
evaluation of the liver’s ability to carry out one or more of its basic physiological functions (e.g.,
glucose metabolism, synthesis of certain proteins, excretion of bilirubin) or its capacity to extract and
metabolize foreign compounds from the blood. The second type of assessment involves a determination
of whether there are abnormally high levels in the blood of intracellular hepatic proteins. The presence
of elevated levels of these proteins in blood is presumptive evidence of liver cell destruction. Examples
of these two types of tests are described below:
1.
Serum Albumin.
Albumin is synthesized in the liver and secreted into blood. Liver damage can
impair the ability of the liver to synthesize albumin, and serum albumin levels may consequently
decrease. The turnover time for albumin is slow, and as a result it takes a long time for impaired albumin
synthesis to become evident as changes in serum albumin. For this reason, serum albumin measure-
ments are not helpful in assessing acute hepatotoxicity. They may assist in the diagnosis of chronic
liver injury, but certain other diseases can alter serum albumin levels, and the test is therefore not very
specific.
2.
Prothrombin Time.
The liver is responsible for synthesis of most of the clotting factors, and a
decrease in their synthesis due to liver injury results in prolonged clotting time. In terms of clinical
tests, this appears as an increase in prothrombin time. Several drugs and certain diseases also increase
prothrombin time. As with serum albumin measurement, this is a relatively insensitive and nonspecific
tool for detecting or diagnosing chemical-induced liver injury.
3.
Serum Bilirubin.
The liver conjugates bilirubin, a normal breakdown product of the heme from
red blood cells, and secretes the glucuronide conjugate into the bile. Impairment of normal conjugation
5.3 EVALUATION OF LIVER INJURY
125
and excretion of bilirubin results in its accumulation in the blood, leading to jaundice. Serum bilirubin
concentrations may be elevated from acute hepatocellular injury, cholestatic injury, or biliary obstruc-
tion. This test is always included among the battery of tests to assess liver function clinically, although
it is not a particularly sensitive test for acute injury.
4.
Dye Clearance Tests.
These tests involve administration of a dye that is cleared by the liver and
measurement of its rate of disappearance from the blood. Delayed clearance is interpreted as evidence
of liver injury. One such dye is sulfobromophthalein (Bromsulphalein; or BSP). Clearance of BSP
from the blood is dependent on its active transport into liver cells, conjugation with glutathione, and
then active transport into the bile. Conceivably, disruption of any of these processes could result in
delayed clearance, although the biliary excretion step is regarded as most critical. The test consists of
administering a dose of the dye intravenously and measuring its concentration in blood spectro-
photometrically over time. Another dye used for this purpose is indocyanine green (ICG). Unlike BSP,
ICG is excreted into the bile without conjugation. Following an intravenous dose, the disappearance
of ICG from blood can be measured with repeated blood samples or noninvasively by ear densitometry.
The dye tests, although well established, are seldom used clinically.
5.
Drug Clearance Tests.
This test relies on the principle that liver injury will result in impaired
biotransformation. The biotransformation capacity of the liver is assessed by following the rate of
elimination of a test drug whose clearance from blood is dependent on hepatic metabolism (i.e., a drug
for which other elimination processes, such as renal excretion, are insignificant). A test drug such as
antipyrine, aminopyrine, or caffeine is administered, and its rate of disappearance from blood is
followed over time through serial blood sampling. This rate is compared with a value considered
“ normal” to determine whether impaired biotransformation exists. This can also be used to test for
hepatic enzyme induction, in which the rate of elimination from blood would be increased, rather than
decreased as in liver injury. This test is primarily used for research purposes.
6.
Measurement of Hepatic Enzymes in Serum.
Cells undergoing acute degeneration and injury
will often release intracellular proteins and other macromolecules into blood. The detection of these
substances in blood above normal, baseline levels signals cytotoxicity. This is true for any cell type,
and in order for the presence of intracellular proteins in blood to be diagnostic for any particular type
of cell injury (e.g., liver toxicity versus renal toxicity versus cardiotoxicity), the proteins must be
associated rather specifically with a target organ or tissue. Fortunately, several proteins are found
primarily in hepatocytes, and their presence in blood in elevated levels is the basis for some of the most
commonly used tests for hepatotoxicity. Table 5.4 shows many of the most common proteins measured
in these tests. The reader will note that all of these proteins are enzymes. This is not a coincidence.
While any intracellular protein specific to the liver would be useful theoretically, enzymes are proteins
that can be measured specifically (by measuring the rate of their particular enzyme activity) using
TABLE 5.4 Serum Enzyme Indicators of Hepatotoxicity
Enzyme Acronym Comments
Alanine aminotransferase ALT Found mainly in the liver; increase reflects primarily
hepatocellular damage
Aspartate aminotransferase AST Less specific to the liver than ALT; increase reflects primarily
hepatocellular damage
Alkaline phosphatase ALP Increases reflect primarily cholestatic injury
γ
-Glutamyl transferase;
γ
-glutamyltranspeptidase
GGTP Increases reflect primarily cholestatic injury, although
elevated in hepatocellular damage as well
5
′
-Nucleotidase 5
′
ND Increases reflect primarily cholestatic injury
Sorbitol dehydrogenase SDH High specificity for liver; increase reflects primarily
hepatocellular damage
Ornithine carbamoyltransferase OCT High specificity for liver; increase reflects primarily
hepatocellular damage
126
HEPATOTOXICITY: TOXIC EFFECTS ON THE LIVER
assays that are rapid and inexpensive. In fact, the concentrations of each of these proteins are typically
measured as an enzyme activity rate, rather than a true concentration per se.
Aminotransferase activities [alanine aminotransferase (ALT) and aspartate aminotransferase
(AST)], alkaline phosphatase activity, and gamma glutamyltransferase transpeptidase (GGTP) are
included in nearly all standard clinical test suites to assess potential hepatotoxicity. The value of
performing a battery of these tests is that each test responds slightly differently in the various forms
of liver injury, and evaluating the pattern of responses can offer insight into the type of injury that has
occurred. For example, severe hepatic injury from acetaminophen can result in dramatic increases in
serum ALT and ALT activities (up to 500 times normal values), but only modest increases in alkaline
phosphatase activity. Pronounced increases in alkaline phosphatase is characteristic of cholestatic
injury, where increases in ALT and AST may be limited or nonexistent. In alcoholic liver disease, AST
activity is usually greater than ALT activity, but for most other forms of hepatocellular injury ALT
activities are higher. Serum GGTP is an extremely sensitive indicator of hepatobiliary effects, and may
be elevated simply by drinking alcoholic beverages. It is not a particularly specific indicator (it is
increased by both hepatocellular and cholestatic injury) and is best utilized in combination with other
tests. Serum levels of enzymes such as lactate dehydrogenase have been used to evaluate liver toxicity,
but this enzyme has such low specificity for the liver that interpretation of these results is impossible
without other confirming tests. Other enzymes such as sorbitol dehydrogenase (SDH) and ornithine
carbamoyltransferase (OCT) are quite specific to the liver.
5.4 SUMMARY
Both the anatomic location and its role as a primary site for biotransformation make the liver uniquely
susceptible to drug- and chemical-induced injury. Many chemicals encountered in the workplace and
environment are capable of producing toxic effects in the liver:
•
There are many types of liver injury, including hepatocellular degeneration and death
(necrosis), fatty liver, cholestasis (decreased or arrested bile flow), vascular injury, cirrhosis,
and tumor development.
•
Hepatic injury from drugs and chemicals can arise from a variety of mechanisms. While the
mechanism of toxicity for some chemicals is reasonably well established, many aspects of
toxic mechanisms for most chemicals remain unclear.
•
Hepatotoxic chemicals can attack a variety of subcellular targets. Principal organelles and
structures affected include the plasma membrane, mitochondria, the endoplasmic reticulum,
the nucleus, and lysosomes.
•
Liver injury can be evaluated morphologically (microscopic examination of liver tissue) or
through blood tests. Blood tests are designed to either measure the functional capacity of
the liver or the appearance of intracellular hepatic contents in the blood.
REFERENCES AND SUGGESTED READING
Cullen, J. M., and B. H. Ruebner, “ A histopathologic classification of chemical-induced injury of the liver,” in
Hepatotoxicity,
R. G. Meeks, S. D. Harrison, and R. J. Bull, eds., CRC Press, Boca Raton, FL, 1991, pp. 67–92.
Delaney, K., “Hepatic principles,” in
Goldfrank’s Toxicologic Emergencies,
L. R. Goldfrank, N. E. Flomenbaum,
N. A. Lewin, R. S. Weisman, M. A. Howland, and R. S. Hoffman, eds., Appleton & Lange, Stamford, CT, 1998,
pp. 213–228.
Kedderis, G. L. “ Biochemical Basis of Hepatocellular Injury.”
Toxicologic Pathology,
24
(1): 77–83 (1996).
REFERENCES AND SUGGESTED READING
127
Lamers, W. H., A. Hilberts, E. Furt, J. Smith, G. N. Jonges, C. J. F. von Noorden, J. W. G. Janzen, R. Charles, and
A. F. M. Moorman, “Hepatic enzymic zonation: A reevaluation of the concept of the liver acinus,” Hepatology
10: 72–76 (1989).
Marzella, L., and B. F. Trump, “ Pathology of the liver: Functional and structural alterations of hepatocyte organelles
induced by cell injury” in Hepatotoxicity, R. G. Meeks, S. D. Harrison, and R. J. Bull, eds., CRC Press, Boca
Raton, FL, 1991, pp. 93–138.
MacSween, R. N. M., and R. J. Scothorne, “ Developmental anatomy and normal structure,” in Pathology of the
Liver, R. N. M. MacSween, P. P. Anthony, P. J. Scheuer, A. D. Burt, and B. C. Portmann, eds., Churchill
Livingstone, Edinburgh, 1994, pp. 1–49.
Miyai, K., “Structural organization of the liver,” in Hepatotoxicity, R. G. Meeks, S. D. Harrison, and R. J. Bull,
eds., CRC Press, Boca Raton, FL, 1991, pp. 1–65.
Moslen, M. T., “ Toxic responses of the liver,” Casarett and Doull’s Toxicology. The Basic Science of Poisons, 5th
ed., C. D. Klaasen, M. O. Amdur, and J. Doull, eds., McGraw-Hill, New York, 1996, pp. 403–416.
Popper, H., “ Hepatocellular degeneration and death,” in The Liver: Biology and Pathobiology, I. M. Arias, W. B.
Jakoby, H. Popper, D. Schachter, and D. A. Shafritz, eds., Raven Press, New York, 1988, pp. 1087–1103.
Rappaport, A. M., “Physioanatomical basis of toxic liver injury,” in Toxic Injury of the Liver, Part A, E. Farber and
M. M. Fisher, eds., Marcel Dekker, New York, 1979, pp. 1–57.
Zimmerman, H. J., and K. G. Ishak, “Hepatic injury due to drugs and toxins,” in Pathology of the Liver, R. N. M.
MacSween, P. P. Anthony, P. J. Scheuer, A. D. Burt, and B. C. Portmann, eds., Churchill Livingstone, Edinburgh,
1994, pp. 563–633.
128
HEPATOTOXICITY: TOXIC EFFECTS ON THE LIVER
6
Nephrotoxicity: Toxic Responses of the
Kidney
NEPHROTOXICITY: TOXIC RESPONSES OF THE KIDNEY
PAUL J. MIDDENDORF and PHILLIP L. WILLIAMS
This chapter will give the environmental and occupational health professional information about
•
The importance of kidney functions
•
How toxic agents disrupt kidney functions
•
Measurements performed to determine kidney dysfunctions
•
Occupational and environmental agents that cause kidney toxicity
6.1 BASIC KIDNEY STRUCTURES AND FUNCTIONS
The principal excretory organs in all vertebrates are the two kidneys. The primary function of the
kidney in humans is removing wastes from the blood and excreting the wastes in the form of urine.
However, the kidney plays a key role in regulating total body homeostasis. These homeostatic functions
include the regulation of extracellular volume, the regulation of calcium metabolism, the control of
electrolyte balance, and the control of acid–base balance.
The adult kidneys of reptiles, birds, and mammals (including humans) are nonsegmental and drain
wastes only from the blood (principally breakdown products of protein metabolism). The kidneys are
paired organs that lie behind the peritoneum on each side of the spinal column in the posterior aspect
of the abdomen. The adult human kidney is approximately 11 cm long, 6 cm broad, and 2.5 cm thick.
In human adults individual kidneys weigh 125–170 g for males and 115–155 g for females. The renal
artery and vein pass through the hilus, which is a slit in the medial or concave surface of each kidney
(Figure 6.1
b
). From each kidney a common collecting duct, the ureter, carries the urine posteriorly to
the bladder where it can be voided from the body.
Each human kidney consists of an outer cortex and an inner medulla (see Figures 6.1
b
and 6.2).
The cortex constitutes the major portion of the kidney and receives about 85 percent of the total renal
blood flow. Consequently, if a toxicant is delivered to the kidney in the blood, the cortex will be exposed
to a very high proportion.
Blood Flow to the Kidneys
The kidneys represent approximately 0.5 percent of the total body weight, or approximately 300 g in
a 70-kg human. Yet the kidneys receive just under 25 percent of the total cardiac output, which is about
1.2–1.3 L blood/min, or 400 mL/100 g tissue/min. The rate of blood flow through the kidneys is much
greater than through other very well perfused tissues, including brain, heart, and liver. If the normal
blood hematocrit (i.e., that proportion of blood that is red blood cells) is 0.45, then the normal renal
plasma flow is approximately 660 to 715 mL/min. Yet only 125 mL/min of the total plasma flow is
129
Principles of Toxicology: Environmental and Industrial Applications, Second Edition
, Edited by Phillip L. Williams,
Robert C. James, and Stephen M. Roberts.
ISBN 0-471-29321-0 © 2000 John Wiley & Sons, Inc.
actually filtered by the kidney. Of this, the kidney reabsorbs approximately 99 percent, resulting in a
urine formation rate of only about 1.2 mL/min. Thus, the kidneys, which are perfused at approximately
1 L/min, form urine at approximately 1 mL/min or 0.1 percent of the perfusion. Because of the high
volume of blood flow to the kidneys, a chemical in the blood is delivered to this organ in relatively
large quantities.
The kidney requires large amounts of metabolic energy to remove wastes from the blood by tubular
secretion and to return filtered nutrients back to the blood. Roughly 10 percent of the normal resting
oxygen consumption is needed for the maintenance of proper kidney function. Therefore, the kidney
is sensitive to agents, such as barbiturates, that induce
ischemia,
a lack of oxygen caused by a decrease
in blood flow. Acute intoxication by barbiturates induces severe hypotension (i.e., low blood pressure)
and shock. The severe decrease in blood pressure results in a decrease in filtration of the plasma,
resulting in a decrease (oliguria) or cessation (anuria) of urine formation. At an early stage this is called
pre–renal failure,
and a reversal in the blood deficit to the kidney will restore normal renal function.
However, a critical point is reached when renal sufficiency cannot be restored because of the cell death
caused by ischemic anoxia, and the resultant renal failure is irreversible. In this situation, the
accumulation in the blood of wastes normally excreted (uremia) results in death. It should be
remembered, then, that any agent or physical trauma that causes severe hypotension and shock may
produce acute renal failure and eventually death by a similar mechanism.
Nephrons: The Functional Units of the Kidney
The cortex of each kidney in humans contains approximately one million excretory units called
nephrons. Agents toxic to the kidney generally injure these nephrons, and such agents are therefore
referred to as nephrotoxicants. Degeneration, necrosis, or injury to the nephron elements is referred to
as a
nephrosis
or
nephropathy.
An individual nephron may be divided into three anatomic portions: (1) the vascular or blood-
circulating portion, (2) the glomerulus, and (3) the tubular element (Figures 6.2 and 6.3). The
glomerulus, which is about 200 µm in diameter, is formed by the invagination of a tuft of capillaries
Figure 6.1 The human renal excretory system: (a) the complete excretory system; (b) cross section of kidney; (c)
representative section for the enlargement in Figure 6.2.
130
NEPHROTOXICITY: TOXIC RESPONSES OF THE KIDNEY
into the dilated, blind end of the nephron (Bowman’s capsule). The capillaries are supplied by an
afferent arteriole and drained by an efferent arteriole. These vascular elements deliver waste and other
materials to the tubular element for excretion, return reabsorbed and synthesized materials from the
tubular element to the blood circulation, and deliver oxygen and nourishment to the nephron.
The Glomerulus and Glomerular Filtration
The glomerulus behaves as if it were a filter with
pores 100 Å in diameter, or about 100 times more permeable than the capillaries in skeletal muscle.
Substances as great as 70,000 daltons can appear in the glomerular filtrate, but most proteins in
the plasma are still too large to pass through the glomerulus. Therefore, a substance that is, for
example, 75 percent bound to plasma proteins has an effective filterable concentration of 25
percent its total plasma concentration. Small amounts of protein, principally the albumins, which
are important chemical-binding proteins, may appear in the glomerular filtrate, but these are then
normally reabsorbed. The glomerular filter can be made more permeable in certain disease states
and by actions of certain nephrotoxicants. Both circumstances may result in the appearance of
protein in the urine (proteinuria). If damage to the glomerular element is severe, the result is a
loss of a large amount of the plasma proteins. If this occurs at a rate greater than the rate at which
the liver can synthesize the plasma proteins, the result will be hypoproteinemia (lower than normal
levels of proteins in the blood) and a concomitant edema due to the reduction in osmotic pressure.
This clinical picture is sometimes referred to as the
nephrotic syndrome.
However, transient but
significant proteinuria occurs normally after prolonged standing or strenuous exercise, so a single
measurement of high protein levels in the urine may not indicate kidney damage.
Nephron Tubules and Tubular Reabsorption
The tubular element of the nephron selectively reab-
sorbs 98–99 percent of the salts and water of the initial glomerular filtrate. The tubular element of the
Figure 6.2 Cortical and juxtamedullary nephrons. Enlargement of representative kidney section in Figure 6.1c.
(Based on B. Brenner and F. Rector, The Kidney, Saunders, Philadelphia, 1976.)
6.1 BASIC KIDNEY STRUCTURES AND FUNCTIONS
131
nephron consists of the proximal tubule, the loop of Henle, the distal tubule, and the collecting duct
(see Figure 6.3). The proximal tubule consists of a proximal convoluted section (pars convoluta) and
a distal straight section (pars recta). Substances that are actively reabsorbed in the proximal tubule
include glucose, sodium, potassium, phosphate, amino acids, sulfate, and uric acid. Essentially all
amino acids and glucose are reabsorbed in the proximal tubule, and virtually none normally appear in
the urine. Agents toxic to the proximal tubule cause amino acids and glucose to appear in the urine
(aminoaciduria and glycosuria). Even though 250 g of glucose normally passes through the kidney
daily, no more than 100 mg is usually excreted in 24 h. However, glucose does appear in excess
quantities in the urine if high blood glucose levels produce a glucose load in the filtrate and this exceeds
the resorptive capacity of the proximal tubule of the nephrons. This occurs in diabetes mellitus, in
which excess glucose appears in urine because excessive amounts of glucose in the blood plasma
filtrate have overwhelmed the glucose transport system in the nephron. Water is also reabsorbed in the
proximal tubule because of an osmotic gradient between the filtrate in the tubule and the blood plasma.
Thus, isotonicity is maintained in the proximal tubule even though there is a selective reabsorption of
solutes. Approximately 75 percent of the glomerular filtrate fluid is reabsorbed in the proximal tubule.
Figure 6.3 Juxtamedullary nephron: (1) afferent arteriole; (2) efferent arteriole; (3) glomerulus; (4) proximal
convoluted tubule; (5) proximal straight tubule (pars recta); (6) descending limb of the loop of Henle; (7) thin
ascending limb of the loop of Henle; (8) thick ascending limb of the loop of Henle; (9) distal convoluted tubule;
(10) collecting duct. (Based on J. Doull, et al., eds., Casarett and Doull’s Toxicology: The Basic Science of Poisons,
2nd ed., Macmillan, New York, 1980.)
132
NEPHROTOXICITY: TOXIC RESPONSES OF THE KIDNEY
If tubular reabsorption of substances is compromised, then less water is reabsorbed. The result is
diuresis (increased urine flow) and polyuria (excess urine production). Toxic agents can cause polyuria
by affecting active solute reabsorption.
Tubular Secretion
Active transport of certain organic compounds into the tubular fluid also occurs
in the proximal tubule. There are two separate active secretory systems in the proximal tubule: one for
anionic (negatively charged) organic chemical species, and a similar but separate system for cationic
(positively charged) organic chemical species. The organic anion secretory system is the better studied.
Organic cations such as tetramethyl ammonium are actively secreted, but this system is not as well
studied as the organic anion secretory system. The two secretory systems also have unique competitors
and inhibitors. Penicillin and probenecid are actively secreted by the organic anion secretory system.
As a consequence, they inhibit the excretion of PAH (
p
-amminohippuric acid) and each other. In fact,
probenicid has been used to prolong the half-life of penicillin in the blood since probenicid inhibits
secretion of penicillin into the proximal tubules and its subsequent excretion in the urine. These organic
anions do not inhibit secretion of organic cations or compete with them for secretion. The reverse is
also true. The result is that substances reabsorbed from the tubule will have a clearance significantly
less than the glomerular filtration rate (approximately 125 mL/min), while those secreted into the
tubules will have a clearance greater than the glomerular filtration rate in the adult human.
The Loop of Henle
After the glomerular filtrate has passed the proximal tubule in the nephron, it
moves into the loop of Henle. A nephron with a glomerulus in the outer portion of the renal cortex has
a short loop of Henle, whereas a nephron with a glomerulus close to the border between the cortex and
medulla (juxtamedullary nephrons) has a long loop of Henle extending into the medulla and papilla
(Figures 6.2 and 6.3). Approximately 15 percent of the nephrons in humans are juxtamedullary. As the
tubule descends into the medulla there is an increase in osmolality of the interstitial fluid. In the
descending limb the tubular fluid becomes hypertonic (high in salt) as water leaves the tubule to
maintain isoosmolality with the hypertonic interstitial fluid. However, in the thick segment of the
ascending portion of the loop of Henle the tubule becomes impermeable to water, and sodium is actively
transported out of the tubule with a decrease in the osmolality of the filtrate and an increase in the
osmolality of the interstitial fluid. The sodium transport in the ascending limb is necessary for
maintenance of the interstitial fluid concentration gradient. An additional 5 percent of the glomerular
filtrate fluid is reabsorbed in the loop of Henle, making a total of 80 percent of the total water reabsorbed
at this point.
Urine Formation
Once the tubular fluid enters the distal convoluted tubule and collecting duct, it is
hypotonic (low salt concentration) in comparison to blood plasma because of the active transport of
sodium out of the tubule at the loop of Henle. In the presence of vasopressin, the antidiuretic hormone,
the collecting duct becomes permeable to water, and the water moves from the tubular fluid in order
to maintain isoosmolality. However, in the absence of vasopressin, the collecting duct is impermeable
to water, which results in excretion of a large volume of hypotonic urine. Normally, another 19 percent
of the original glomerular filtrate fluid is reabsorbed in the last portion of the nephron, so that a total
of 99 percent of the fluid filtered at the glomerulus is reabsorbed—only 1 percent of the fluid entering
the nephron is excreted in the urine. Thus, the normal flow of urine is only about 1 mL/min, while in
the absence of vasopressin it can be increased to 16 mL/min. The kidney’s ability to concentrate urine
is determined by the measurement of urine osmolality. Urine osmolality can vary between 50 and 1400
mOsm/L. Certain nephrotoxicants compromise the kidney’s ability to concentrate the urine. These
changes occur early after the exposure to the nephrotoxicant and frequently foreshadow graver
consequences.
The excretion of urea, a metabolic breakdown product of protein, is a special case. Urea passively
diffuses out of the glomerular filtrate of the tubules as fluid volume decreases. At low urine flow, more
urea has the opportunity to leave the tubule. Under these conditions only 10–20 percent of the urea is
excreted. At conditions where the urine flow is high, the urea has less time to diffuse through
6.1 BASIC KIDNEY STRUCTURES AND FUNCTIONS
133
membranes with the water; this results in a 50–70 percent excretion of urea. A second factor in urea
excretion is that it accumulates in the medullary interstitial fluid along a concentration gradient. Since
the walls of the collecting ducts are permeable to urea fluid where they pass through the medulla, the
urea content of the urine is higher than it would be if they passed only through regions with low urea
concentration.
Passive reabsorption occurs for all nonionic compounds, while ionic chemicals are not passively
reabsorbed. For organic acids, a basic urine is desirable to maximize excretion since more of the acid
will be ionized at higher pH (Haldane equation, Chapter 4). For organic bases, an acidic urine is
desirable for maximal excretion, because more of the basic compound will be ionized.
Bladder
The urine that flows from the collecting ducts is deposited in the bladder. Little of the literature is
devoted to the bladder and its functioning. However, some compounds are toxic to the bladder. Bladder
cancer is thought to be caused by occupational exposure to bicyclic aromatic amines. The bladder
epithelium contains high levels of an enzyme, prostaglandin H synthase (PHS), which can activate
certain aromatic amines, such as benidine, 4-aminobiphenyl, and 2-aminonaphthalene, to compounds
that can react with DNA. The normal metabolism of these compounds involves acetylation, and there
are several genetic polymorphisms of the enzymes (
N
-acetyltransferases) responsible for acetylating
them. Individuals with slow acetylating enzymes are more likely to develop bladder cancer after
exposure.
Important Kidney Functions Seldom Considered as Toxic Endpoints
Renal Erythropoietic Factor
The kidney synthesizes hormones essential for certain metabolic func-
tions. For example, hypoxia stimulates the kidneys to secrete renal erythropoietic factor, which acts
on a blood globulin (proerythropoietin) released from the liver to form erythropoietin, a circulating
glycoprotein with a molecular weight of 60,000 daltons. The erythropoietin acts on erythropoietin-
sensitive stem cells in the bone marrow, stimulating them to increase hemoglobin synthesis, produce
more red blood cells, and release them into the circulating blood. The increased oxygen-carrying
capacity of the blood reduces the effects of hypoxia. Thus, in chronic renal failure, anemia usually
develops, in large part caused by decreased synthesis of erythropoietic factor because of damage to
the kidney tissues responsible for its synthesis. In addition to hypoxia, androgens and cobalt salts also
increase production of renal erythropoietic factor by the kidneys. In fact, administration of cobalt salts
produces an overabundance of red cells in the blood (i.e., polycythemia) by this mechanism. Poly-
cythemia has been observed in heavy drinkers of cobalt-contaminated beer.
Regulation of Blood Pressure
The kidney is involved in regulating blood pressure in several ways.
The kidney produces renin, a proteolytic enzyme, which cleaves a plasma protein globulin to form
angiotensin I. Angiotensin I is converted to angiotensin II, a potent vasoconstrictor. The angiotensin
II stimulates release of aldosterone from the adrenal cortex, and aldosterone increases reabsorption of
sodium in the kidney, leading to an increase in blood plasma osmolality and an increase in extracellular
volume. A decrease in the mean renal arterial pressure is the stimulus controlling kidney renin
production and the compensatory increase in arterial pressure by the abovementioned mechanisms. In
addition, renal disease and narrowing of the renal arteries are known to cause sustained hypertension
in humans. It appears that the kidney produces vasodepressor substances that are thought to be
important in the regulation of blood pressure. Thus, changes in the kidney that disturb the renin–
angiotensin–aldosterone system and/or secretion of the vasodepressor substances are suspected of
playing a key role in the etiology of certain forms of hypertension.
134
NEPHROTOXICITY: TOXIC RESPONSES OF THE KIDNEY