The option trader s guide to probability volatility and timing phần 3 potx
Bạn đang xem bản rút gọn của tài liệu. Xem và tải ngay bản đầy đủ của tài liệu tại đây (644.35 KB, 60 trang )
save you from losing large sums of money if the stock makes a big drop.
Writing covered calls can work. However, you must find stocks that meet
one of two criteria: trending upward or maintaining a trading range.
As exhibited with XYZ, covered calls work well with stocks on the
rise. Unfortunately, even stocks with upward trends have moments in
which they make sharp corrections. These periods are difficult for cov-
ered call writers as they watch their accounts shrink, because the covered
call does not offer comprehensive protection to the downside. However,
in many cases good stocks will rebound. If you do choose to write cov-
ered calls, do so only in high-grade stocks that have been in a consistent
uptrend and have exhibited strong growth in earnings per share.
To protect yourself from severe down moves, you can combine cov-
ered calls with buying puts for protection. If you purchase long-term puts
(over six months), you can continue to write calls month after month, but
you will have the added protection of the right to sell the underlying stock
at a specific price.
Exiting the Position
Since a covered call protects only a stock within a specific range, it is vi-
tal to monitor the daily price movement of the underlying stock. Let’s in-
vestigate optimal exit strategies for the first covered call example, the
sale of the 50 call.
• XYZ rises above the short strike (50): The short call is assigned.
Use the 100 shares from the original long stock position to satisfy your
obligation to deliver 100 shares of XYZ to the option holder at $50 a
share. This scenario allows you to take in the maximum profit of $375.
• XYZ falls below the short strike (50), but stays above the ini-
tial stock price (49): The short call expires worthless and you get to
keep the premium ($275) received. No losses have occurred on the
long stock position and you can place another covered call to offset
the risk on the long stock position if you wish.
• XYZ falls below the initial stock price (49), but stays above
the breakeven (46.25): The long stock position starts to lose money,
but this loss is offset by the credit received from the short call. If XYZ
stays above 46.25, the position will break even or make a small profit.
• XYZ falls below the breakeven (46.25): Let the short option ex-
pire worthless and use the credit received to partially hedge the loss
on the long stock position.
Covered calls are one of the most popular option strategies used in
today’s markets. If you want to gain additional income on a long stock
Basic Trading Strategies 103
ccc_fontanills_ch4_76-129.qxd 12/17/04 4:03 PM Page 103
position, you can sell a slightly OTM call every month. The risk lies in the
strategy’s limited ability to protect the underlying stock from major
moves down and the potential loss of future profits on the stock above
the strike price. Covered calls can also be combined with a number of
bearish options strategies to create additional downside protection.
Covered Call Case Study
Covered calls are often used as an income strategy on stocks that we are
holding long-term. They also can be used as a short-term profit maker by
purchasing the stock and selling the call at the same time. The idea is to
sell a call against stock that is already owned. If we do not want to give up
the stock, we must be willing to buy the option back if it moves in-the-
money. However, if we feel the stock will not rise above our strike price,
we would benefit by selling the call.
On December 1, 2003, shares of Rambus (RMBS) were falling back af-
ter an attempt to break through resistance at $30. The stock rose to a high
of $32.25, but ultimately ended flat on the session right at $30 a share.
Viewing the chart, we might have decided that $30 would hold and that en-
tering a covered call strategy might work well.
By entering a short call, we have unlimited risk to the upside. How-
ever, by owning the stock, we mitigate this risk because we could use the
stock to cover the short call. Let’s assume we didn’t already own Rambus,
so we need to purchase 500 shares at $30 and sell 5 December 30 calls at
$2.05 each. Our maximum profit for this trade is $1,025 [(2.05 × 5 ) × 100]
and this occurs if the stock is at or above 30 on December 19. The maxi-
mum risk is still large because the amount of the credit for selling the calls
does little for a major drop in the stock. Our breakeven point is at 27.95,
104
THE OPTIONS COURSE
Covered Call
Strategy: Buy the underlying security and sell an OTM call option.
Market Opportunity: Look for a bullish to neutral market where a slow
rise in the price of the underlying is anticipated with little risk of decline.
Maximum Risk: Limited to the downside below the breakeven as the
stock falls to zero.
Maximum Profit: Limited to the credit received from the short call option
+ (short call strike price – price of long underlying asset) × 100.
Breakeven: Price of the underlying asset at trade initiation – short call
premium.
Margin: Amount subject to broker’s discretion.
ccc_fontanills_ch4_76-129.qxd 12/17/04 4:03 PM Page 104
which is figured by taking the credit received and subtracting it from the
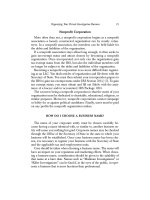
price of the underlying at trade initiation (30 – 2.05). Figure 4.13 shows the
risk graph for this trade.
Though we have limited our upside risk by using stock to cover the
short call, we still have significant risk to the downside if the stock were
to fall sharply. However, if the stock remains near $30, we get to keep the
entire credit, even though there wasn’t a loss in the shares of stock. Since
the passage of time erodes the value of the option, it’s best to use short-
term options.
In our example, shares of RMBS did try several times to break higher,
but each time resistance held and the stock ultimately closed at $26.37 on
Basic Trading Strategies 105
Profit
–6,000 –5,000 –4,000 –3,000 –2,000 –1,000 0 1,025
20 25 30 35 40
Today: 18 days left Close= 30.00
12 days left
6 days left
Expiry: 0 days left
FIGURE 4.13 Risk Graph of Covered Call on RMBS (Source: Optionetics
Platinum © 2004)
ccc_fontanills_ch4_76-129.qxd 12/17/04 4:03 PM Page 105
expiration December 19. At expiration, the stock position was down $3.63
a share, or $1,815: (3.63 × 500). However, the loss was offset by the $1,025
received from the credit from the short calls. So, the trade results in a
$790 loss. A trader could continue to sell calls against the stock each
month if it is felt the stock will remain near the strike price.
LONG PUT
In the long put strategy, you are purchasing the right, but not the obliga-
tion, to sell the underlying stock at a specific price until the expiration
date. This strategy is used when you anticipate a fall in the price of the un-
derlying shares. A long put strategy offers limited profit potential (limited
because the underlying asset can fall no further than zero) and limited
downside risk. It is often used to get high leverage on an underlying secu-
rity that you expect to decrease in price.
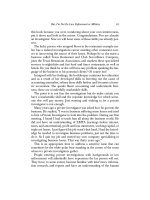
If you want to go long a put, your risk curve would look like the graph
in Figure 4.14. Note how the profit/loss line for a long put strategy slopes
upward from right to left. When the underlying instrument’s price falls,
you make money; when it rises, you lose money. Note how the profit on a
long put is limited as the price of the underlying asset can only fall to zero.
The long put strategy is often used to get high leverage on an underly-
ing security that is expected to decrease in price. It requires a fairly small
investment and consists of buying one or more puts with any strike and
any expiration. The buyer of put options has limited risk over the life of
the option, regardless of the movement of the underlying asset. The put
106
THE OPTIONS COURSE
Covered Call Case Study
Strategy: With the stock trading at $30 a share on December 1, sell 5 De-
cember 30 calls @ 2.05 and buy 500 shares of Rambus stock.
Market Opportunity: Expect consolidation in shares after failure to
break out.
Maximum Risk: Limited as the stock moves lower (as the stock can only
fall to zero). In this case, the loss is $790.
Maximum Profit: Credit initially received. In this case, 5 calls @ 2.05
each = $1,025.
Breakeven: Price of the underlying asset at trade initiation – call option
credit. In this case, 27.95: (30 – 2.05).
Margin: None.
ccc_fontanills_ch4_76-129.qxd 12/17/04 4:03 PM Page 106
option buyer’s maximum risk is limited to the amount paid for the put.
Profits are realized as the put increases in value as the underlying asset’s
value falls. Buying a put is a limited-risk bearish strategy that can be used
instead of shorting stock. It is best placed when the option is exhibiting
low implied volatility. Keep in mind that the further away the expiration
date is, the higher the premium. But the cost that time contributes to a put
premium must be balanced out by the need for sufficient time for the
underlying shares to move into a profitable position.
Long Put Mechanics
Let’s create an example by going long 1 January XYZ 50 Put @ 5. The cost
of this position is $500 (5 × 100 = $500) plus commissions. The maximum
risk for this trade is limited to the premium of the put option while the re-
ward is limited to the downside until the underlying asset reaches zero.
Looking at the risk graph in Figure 4.14, notice how potential profit and
loss values correspond to underlying share prices. Can you see the
breakeven point? The breakeven is calculated by subtracting the put pre-
mium from the put strike price. In this trade, the breakeven is 45 (50 – 5 =
45), which means that XYZ would have to fall below 45 for the trade to
start making a profit.
Basic Trading Strategies 107
FIGURE 4.14 Long Put Risk Profile
ccc_fontanills_ch4_76-129.qxd 12/17/04 4:03 PM Page 107
Exiting the Position
Choosing an exit strategy depends on the movement of the underlying
shares as well as changes in volatility.
• XYZ falls below the breakeven (45): Either offset the long put by
selling a put option with the same strike and expiration at an accept-
able profit or exercise the put option to go short the underlying mar-
ket. You can hold this short position or cover the short by purchasing
the shares back at the current lower price for a profit.
• XYZ rises above the breakeven (45): You can wait for a reversal
or offset the long put by selling an identical put option and using the
credit received to mitigate the loss. The most you can lose is the initial
premium paid for the put.
In this example, let’s say the price of XYZ falls from $50 to $40. This
results in a rise in the premium of the October 50 put to 13.75. You now
have a decision to make. To exit a long put, you can offset it, exercise it,
or let it expire. To offset this position, you can sell the March 50 put and
reap a profit of $875: (13.75 – 5) × 100 = $875. If you choose to exercise
the position, you will end up with a short position of 100 shares of XYZ
at $50. This would bring in an additional credit of $5,000 (minus com-
missions). However, you would then be obligated to cover the short
sometime in the future by purchasing 100 shares of XYZ at the current
price. If you covered the short with the shares priced at $40, you would
make a profit of $500: (5,000 – 4,000 = $1,000 for the stock minus $500
for the cost of the put). Therefore, offsetting the option yields a higher
profit. In fact, you almost never want to exercise an option with time
value remaining because it will be more profitable to simply sell the op-
tion. In addition, exercising the long put requires enough money in your
trading account to post the required margin to short the shares.
108
THE OPTIONS COURSE
Long Put
Strategy: Buy a put option.
Market Opportunity: Look for a bearish market where you anticipate a
fall in the price of the underlying below the breakeven.
Maximum Risk: Limited to the price paid for the put option premium.
Maximum Profit: Limited below the breakeven as the stock price can
only fall to zero.
Breakeven: Put strike price – put premium.
Margin: None.
ccc_fontanills_ch4_76-129.qxd 12/17/04 4:03 PM Page 108
Long Put Case Study
A long put involves the purchase of just one option strike and one expira-
tion month. Buying a long put is a strategy that benefits from a decline in the
underlying security. However, unlike selling stock short, there isn’t a need
to use margin and entering the put is an easy process. As with any long debit
strategy, a long put will suffer from time decay, so we want to use options
that have at least 60 days, and preferably more, until expiration.
By entering a long put, we have limited our risk to the initial cost of
the put. At the same time, we have limited reward to the downside as the
underlying can only fall to zero. Let’s go back to the fall of 2000 and see
how entering a put on the Nasdaq 100 Trust (QQQ or Qs) would have
worked following a triple top formation.
The Qs moved above 100 on August 31, but then formed a bearish pat-
tern on September 1. At this time, it seemed that a break back below 100
would be bearish for the Qs. Thus, on September 5, an option trader could
have entered a long put when the Qs closed at $99.50.
The December 100 puts could be purchased for $8 each. Our maxi-
mum risk would then be $4,000 if we were to buy five contracts. Figure
4.15 shows the risk graph for long puts on the Qs.
The risk graph shows that as the Qs fall, the puts increase in worth. Of
course, if this trade were to be held until expiration, the price of the Qs
would need to be below 92 to make a profit. However, the quicker the Qs
drop, the larger the profit in the near term. In order to see a double in this
trade, a move to about 85 would need to occur.
At the close of trading the very next day (September 6), these puts
were worth $9.38, a gain of nearly $700 in one day. The Qs continued to
fall during the next several months, leading to a sharp decline for security,
but a large increase in the long puts. Selling continued after the Qs fell
Basic Trading Strategies 109
Long Put Case Study
Strategy: With the security trading at $99.50 a share on September 5,
2000, buy 5 December 100 puts @ 8.00 on the Nasdaq 100 Trust (QQQ).
Market Opportunity: Expect decline in shares following bearish chart
pattern.
Maximum Risk: Limited to initial debit of $4,000.
Maximum Profit: $46,000 if Qs were to go to zero. In this case, the puts
increased to $17 each for a profit of $4,500.
Breakeven: Strike minus the initial cost per put. In this case, 92: (100 – 8).
Margin: None.
ccc_fontanills_ch4_76-129.qxd 12/17/04 4:03 PM Page 109
through their 200-day moving average and were unable to recapture this
prior support level. On the close of trading October 3, 2000, the Qs were at
84 and the puts were now selling for $17 each. At this time, the long puts
could have been sold for a profit of $4,500: [(17 – 8) × 5] × 100 = $4,500.
SHORT PUT
A short put strategy offers limited profit potential and limited, yet high
risk. It is best placed in a bullish market when you anticipate a rise in
the price of the underlying market beyond the breakeven. By selling a
put option, you will receive the option’s premium in the form of a credit
110
THE OPTIONS COURSE
Profit
–7,000 –5,000 –3,000 –1,000 1,000 3,000 5,000 7,000 9,000
75 80 85 90 95 100 105 110 115 120
Today: 101 days left Close= 99.50
68 days left
34 days left
Expiry: 0 days left
FIGURE 4.15 Risk Graph of Long Puts on the QQQ (Source: Optionetics
Platinum © 2004)
ccc_fontanills_ch4_76-129.qxd 12/17/04 4:03 PM Page 110
into your trading account. The premium received is the maximum re-
ward for a short put position. In most cases, you are anticipating that the
short put will expire worthless.
If you want to go short a put, your risk curve would look like the
graph in Figure 4.16. A short put strategy creates a risk profile that slants
downward from right to left from the limited profit. Notice that as the
price of the asset falls, the loss on the short put position increases (until
the price of the underlying stock hits zero). Additionally, the profit is lim-
ited to the initial credit received for selling the put. When the underlying
instrument’s price rises, you make money; when it falls, you lose money.
This strategy provides limited profit potential with limited risk (as the un-
derlying can only fall to zero). It is often used to get high leverage on an
underlying security that you expect to increase in price.
As explained earlier, when you sell options, you will initially receive
the premium for which you sold the option in the form of a credit into your
account. The premium received is the maximum reward. The maximum
loss is limited to the downside until the underlying asset reaches zero.
What kind of a view of the market would you have to sell puts? You
would have a bullish or neutral view. The breakeven for initiating the
trade is the strike price at which the puts are sold minus the premium re-
ceived. If the market were to rise, the position would increase in value
to the amount of premium taken in for the puts. Looking at the risk
graph, notice that as the price of the asset falls, the loss of your short put
Basic Trading Strategies 111
FIGURE 4.16 Short Put Risk Graph
ccc_fontanills_ch4_76-129.qxd 12/17/04 4:03 PM Page 111
position increases (see Figure 4.16). This strategy requires a heavy mar-
gin deposit to place and is best placed using short-term options with
high implied volatility, or in combination with other options.
Short Put Mechanics
Let’s create an example by going short 1 January XYZ 50 Put @ 5. The
maximum profit on this trade is equal to the amount received from the op-
tion premium, or $500 (5 × 100 = $500) minus commissions. To calculate
the breakeven on this position, subtract the premium received from the
put strike price. In this case, the breakeven is 45 (50 – 5 = 45). If XYZ rises
above $45, the trade makes money. You earn the premium with the passage
of time as the short option loses value.
A short put strategy creates a risk profile that slants downward from
right to left (see Figure 4.16). Notice that as the price of the asset falls, the
loss of your short put position increases until the price of the underlying
stock hits zero. This signifies that the profit increases as the market price
of the underlying rises.
Exiting the Position
A short put strategy offers three distinct exit scenarios. Each scenario
primarily depends on the movement of the underlying shares.
• XYZ rises above the put strike price (50): This is the best exit
strategy. The put expires worthless and you get to keep the premium,
which is the maximum profit on a short put position.
• XYZ reverses and starts to fall toward the breakeven (45): You
may want to offset the position by purchasing a put option with the
same strike price and expiration to exit the trade.
• XYZ falls below the put strike price (50): The short put is as-
signed and the put writer is obligated to buy 100 shares of XYZ at $50
per share from the put holder. The short put seller now has a long
shares position and can either sell the XYZ shares at a loss or wait for
a reversal. The maximum loss occurs if the price of XYZ falls to zero.
The short put writer then loses $5,000 (100 shares × 50 = $5,000) less
the $500 credit received from the premium, or a total loss of $4,500
(5,000 – 500 = $4,500).
Short Put Case Study
When we buy a put, we want the underlying security to move lower. Thus,
when we sell a put, we want the stock to rise. However, our maximum
112
THE OPTIONS COURSE
ccc_fontanills_ch4_76-129.qxd 12/17/04 4:03 PM Page 112
profit is the premium we receive for selling the put, so if we expect a large
move higher in the stock, we would be better off to buy a call. Selling a
put is best used when we expect a slightly higher price or consolidation to
take place.
When a stock falls sharply to support in one or two sessions, this is
often a good time to look at selling puts. If we expect that the stock
might start to consolidate following a decline, selling a put could pro-
vide nice profits. However, the risk remains rather high because the
stock could continue to fall and a put seller is at risk the whole way
down to zero.
On July 31, 2003, shares of Cardinal Health (CAH) fell $10 to about
$55 a share. This drop might have seemed overdone given the circum-
stances and a trader could have entered a short put near the close of
the session. The August 55 put could be sold for $1.65, which means
selling five contracts would bring in $825. We want to use the front
month option because time value works in our favor. If CAH were to
stay at $55 or move higher by August 15, the trader would receive the
maximum profit.
The risk graph shown in Figure 4.17 details how the risk in this trade
is rather high compared with the reward. This means that margin will be
an issue and that a large amount of margin will be needed to enter this
type of trade. The breakeven point for this trade is calculated by subtract-
ing the credit received from the strike price (55 – 1.65 = 53.35). Thus, even
a slight move lower would still generate a profit in this trade, but if CAH
were to fall below $53.35 the losses would start to grow.
Fortunately, shares of CAH did move higher after this decline, leaving
the trader with the maximum profit of $825 from the sale of five puts.
Later, we will talk about a less risky way to profit using spreads instead of
naked options.
Basic Trading Strategies 113
Short Put
Strategy: Sell a put option.
Market Opportunity: Look for a bullish or stable market where a rise
above the breakeven is anticipated.
Maximum Risk: Limited as the stock price falls below the breakeven
until reaching a price of zero.
Maximum Profit: Limited to the credit received from the put premium.
Breakeven: Put strike price – put premium.
Margin: Required. Amount subject to broker’s discretion.
ccc_fontanills_ch4_76-129.qxd 12/17/04 4:03 PM Page 113
114 THE OPTIONS COURSE
Profit
–6,000 –5,000 –4,000 –3,000 –2,000 –1,000 0
40 45 50 55 60 65 70 75
Today: 15 days left Close= 54.75
10 days left
5 days left
Expiry: 0 days left
FIGURE 4.17 Risk Graph of Short Puts on CAH (Source: Optionetics Platinum
© 2004)
Short Put Case Study
Strategy: With the stock trading at $54.75 a share on July 31, 2003, sell 5
August 55 puts @ 1.65 each on Cardinal Health (CAH).
Market Opportunity: Expect CAH to consolidate or move higher follow-
ing large one-day drop in shares.
Maximum Risk: Unlimited as stock falls all the way to zero.
Maximum Profit: Initial credit received. In this case, $825: (5 × 1.65) × 100.
Breakeven: Strike price minus the initial credit per put. In this case, 53.35:
(55 – 1.65).
Margin: Extensive.
ccc_fontanills_ch4_76-129.qxd 12/17/04 4:03 PM Page 114
COVERED PUT
You can also use a covered put in a bearish market to profit from a possi-
ble increase in a short stock or futures position. A covered put consists
of selling the underlying futures or stock position and selling a put to
cover the underlying asset’s position. This trade can be very risky, be-
cause it involves short selling a stock, which requires a high margin. The
reward on a covered put is limited to the difference in the initial price of
the short underlying asset minus the strike price of the short put plus the
credit received for the option premium.
Covered Put Mechanics
In this example, let’s go short 100 shares of XYZ @ 50 and short 1 June
XYZ 45 Put @ 2.50. The risk graph below shows a covered put position at
expiration. Once the market moves to the upside above the breakeven,
there is unlimited risk. Margin is $7,500 (stock price plus 50 percent
more); however, the credit on the short stock is $5,000. In addition, the
credit on the short put is $250. Total credit is $5,250. The maximum re-
ward on this trade occurs if XYZ closes at or below 45 at expiration. The
maximum profit for this trade is $750: (50 – 45) + 2.50 × 100 = $750. Figure
4.18 shows the risk profile for the covered put example.
As with most short strategies, this trade is hazardous because it
Basic Trading Strategies 115
FIGURE 4.18 Covered Put Risk Graph
ccc_fontanills_ch4_76-129.qxd 12/17/04 4:03 PM Page 115
comes with unlimited risk. The breakeven of a covered put strategy
equals the price of the underlying asset at trade initiation plus the option
premium. In this trade, the breakeven is 52.50: (50 + 2.50 = 52.50). That
means that if XYZ moves above $52.50, the trade will lose $100 for each
point it rises. In fact, the higher the underlying asset climbs, the more
money will be lost (see Figure 4.18).
Exiting the Position
Since a covered put protects a stock only within a specific range, it is vital
to monitor the daily price movement of the underlying stock. Let’s investi-
gate optimal exit strategies in the following scenarios:
• XYZ declines below the short strike price (45): The short put is
assigned and you are obligated to buy 100 shares of XYZ from the op-
tion buyer at $45 per share. However, you can unload these shares for
the short share price of $50. This exit process garners the maximum
profit of $750.
• XYZ declines below the initial stock price (50), but remains
above the short strike price (45): The short put expires worthless
and you get to keep the premium received. No losses have occurred
on the short stock position and you are ready to place another cov-
ered put to bring in additional profit on the position if you wish.
• XYZ rises above the initial stock price (50) but stays below
the breakeven (52.50): The short stock position starts to lose
money, but this loss is offset by the credit received from the short put.
As long as the stock stays below the breakeven, the position will
break even or make a small profit.
• XYZ rises above the breakeven (52.50): Let the short put expire
worthless and use the credit received to partially hedge the loss on
the short stock position.
Both covered calls and covered puts are high-risk strategies, although
they can be used to try to increase the profit on a trade. It is essential to be
aware of the risks involved and to be extremely careful in selecting the
underlying markets for your covered call or put writing strategies.
Covered Put Case Study
A covered put can be used to profit in the short term by going short a
stock and then selling a put to bring in additional income. The reason a
covered put is not a suggested strategy for most traders is because it has
unlimited risk. The sale of the put does help offset the cost of the short
116
THE OPTIONS COURSE
ccc_fontanills_ch4_76-129.qxd 12/17/04 4:03 PM Page 116
stock, but if the stock rises, this income might mean very little. Let’s use
Rambus (RMBS) once again to show how a covered put would have
worked for this stock when compared to a covered call.
By entering a short put, we have limited risk to the downside all the
way to zero. At the same time, we have unlimited risk to the upside and a
large margin requirement for selling the stock short. Let’s assume we didn’t
already own Rambus, so we need to sell short 500 shares at $30 and sell
five December 30 puts. Remember, RMBS shares were trading right at $30
a share, so we would be able to keep the entire premium from the put if the
stock closes at or above this point. However, as the stock declines, we
profit from being short on Rambus.
The December 30 puts could be sold for 2.10 each and Rambus shares
could be sold short for $30 a share. Thus, we would receive a credit of
$16,050 for entering the covered put. However, the maximum profit would
be limited to just $1,050. The best way to see this is by looking at a risk
graph of the trade shown in Figure 4.19. Notice how the risk continues to
grow as the stock moves higher. This is because the amount of money
brought in from selling the put does little to offset the potential loss ob-
tained from selling RMBS shares short. However, no matter how low the
stock moves, our maximum profit is achieved because the gain in the
short stock will offset the loss in the short put.
In our example, shares of RMBS did try several times to break higher,
but each time resistance held and the stock ultimately closed at 26.37 on
expiration (December 19). This would have resulted in the maximum
profit of $1,050. The short put would have had a value of 3.70 to buy back
on expiration. This results in a loss of 1.60 each (or $800 for five con-
tracts) for the put. However, the 500 shares of RMBS sold short are now
Basic Trading Strategies 117
Covered Put
Strategy: Sell the underlying security and sell an OTM put option.
Market Opportunity: Slightly bearish to neutral. Look for a market where
you expect a decline or stability in price with little risk of the market rising.
Maximum Risk: Unlimited as the price of the underlying increases to the
upside above the breakeven.
Maximum Profit: Limited to the credit received on the short put option +
(price of security sold – put option strike price) × 100.
Breakeven: Price of underlying security at trade initiation + put premium
received.
Margin: Required. Amount subject to broker’s discretion.
ccc_fontanills_ch4_76-129.qxd 12/17/04 4:03 PM Page 117
showing a profit of 3.63: (30 – 26.37). This means the profit from the short
stock is $1,815: (3.63 × 500). If the option were not bought back, the trader
would be forced to buy shares to cover the short, but the net result would
still be a profit.
This might seem like a good way to bring in premium on a stock ex-
pected to move lower. However, the margin required would be large
and the risk is normally just too high to be a consistently profitable
strategy.
118 THE OPTIONS COURSE
Profit
–6,000 –5,000 –4,000 –3,000 –2,000 –1,000 0 1,050
15 20 25 30 35 40
Today: 18 days left Close= 30.00
12 days left
6 days left
Expiry: 0 days left
FIGURE 4.19 Risk Graph of Covered Put on RMBS (Source: Optionetics
Platinum © 2004)
ccc_fontanills_ch4_76-129.qxd 12/17/04 4:03 PM Page 118
STRATEGY ROAD MAPS
For your convenience, the following subsections provide step-by-step
analyses of the basic strategies discussed in this chapter.
Long Call Road Map
In order to place a long call, the following 13 guidelines should be observed:
1. Look for a low-volatility market where a rise in the price of the under-
lying stock is anticipated.
2. Check to see if this stock has liquid options available.
3. Review options premiums with various expiration dates and strike
prices. Use options with more than 90 days until expiration.
4. Investigate implied volatility values to see if the options are over-
priced or undervalued. Look for options with low implied volatility.
5. Review price and volume charts over the past year to explore price
trends and liquidity.
6. Choose a long call option with the best profit-making probability.
Determine which call option to purchase by calculating:
• Limited Risk: Limited to the initial premium required to purchase
the call.
• Unlimited Reward: Unlimited to the upside as the underlying
stock rises above the breakeven.
• Breakeven: Call strike + call premium.
7. Create a risk profile for the trade to graphically determine the trade’s
feasibility. The long call’s risk profile slants upward from left to right.
Basic Trading Strategies 119
Covered Put Case Study
Strategy: With the stock trading at $30 a share on December 1, sell 5 De-
cember 30 puts @ 2.10 each and sell short 500 shares of Rambus stock.
Market Opportunity: Expect consolidation in shares after failure to
break out.
Maximum Risk: Unlimited to the upside above the breakeven.
Maximum Profit: Limited to the credit received on the short put option +
the price of security sold – put option strike price × 100. In this case, the
maximum profit is $1,050: (5 × 210) + (30 – 30) × 100 = $1,050.
Breakeven: Strike price + put option credit. In this case, 32.10: (30 + 2.10).
Margin: Significant.
ccc_fontanills_ch4_76-129.qxd 12/17/04 4:03 PM Page 119
8. Write down the trade in your trader’s journal before placing the trade
with your broker to minimize mistakes made in placing the order and
to keep a record of the trade.
9. Make an exit plan before you place the trade. Determine a profit and
loss percentage that will trigger an exit of the position. Close out the
entire trade by 30 days to expiration.
10. Contact your broker to buy the chosen call option. A margin deposit is
not required.
11. Watch the market closely as it fluctuates. If the market continues to
rise, hold onto the call option until you have made a satisfactory profit
or a reversal seems imminent.
12. If the underlying market gives a dividend to its stockholders, this will
have a negative effect on the price of a call option because a dividend
usually results in a slight decline in the price of a stock.
13. Choose an exit strategy based on the price movement of the underly-
ing stock and the effects of changes in the implied volatility of the
call option:
• The market rises above the breakeven: Offset the position by
selling a call option with the same strike price and expiration at an
acceptable profit; or exercise the option to purchase shares of the
underlying market at the lower strike. You can then hold these
shares as part of your portfolio or sell them at a profit at the current
higher market price.
• The market falls below the breakeven: If a reversal does not
seem likely, contact your broker to offset the long call by selling an
identical call to mitigate your loss. The most you can lose is the
initial premium paid for the option.
Short Call Road Map
In order to place a short call, the following 13 guidelines should be observed:
1. Look for a high-volatility market where a fall in the stock’s price is
anticipated.
2. Check to see if this stock has liquid options available.
3. Review options premiums with various expiration dates and strike
prices. Options with less than 45 days until expiration are best.
4. Investigate implied volatility values to see if the options are over-
priced or undervalued. Look for options with high implied volatility
and, thus, a higher premium.
5. Review price and volume charts over the past year to explore price
trends and liquidity.
120
THE OPTIONS COURSE
ccc_fontanills_ch4_76-129.qxd 12/17/04 4:03 PM Page 120
6. Choose a short call option with the best profit-making probability.
Determine which call option to sell by calculating:
• Unlimited Risk: Unlimited to the upside as the underlying stock
rises above the breakeven.
• Limited Reward: Limited to the initial call premium received as a
credit.
• Breakeven: Call strike + call premium.
7. Create a risk profile for the trade to graphically determine the
trade’s feasibility. A short call’s risk profile slants down from left
to right showing the limited profit and unlimited risk as the stock
rises.
8. Write down the trade in your trader’s journal before placing the trade
with your broker to minimize mistakes made in placing the order and
to keep a record of the trade.
9. Make an exit plan before you place the trade. Determine a profit
and loss percentage that will trigger an exit of the position. For
example, a 50 percent profit or loss is an easy signal to exit the
position.
10. Contact your broker to go short (sell) the chosen call option. Margin
is required to place a short call, the amount of which depends on your
broker’s discretion.
11. Watch the market closely as it fluctuates. If the price of the underlying
stock rises above the strike price of the short call option, it is in dan-
ger of being assigned. If exercised, the option writer is obligated to
deliver 100 shares (per option) of the underlying asset at the short call
strike price to the option holder.
12. If the underlying market gives a dividend to its stockholders, this will
usually cause the price of the call option to decline slightly, which
works in favor of the short call strategy.
13. Choose an exit strategy based on the price movement of the under-
lying stock and the effects of changes in the implied volatility of the
call option:
• The market falls below the strike price: Wait for the call to
expire worthless and keep the credit received from the premium.
• The market reverses and begins to rise above the call strike
price: Exit the position by offsetting it through the purchase of an
identical call option (same strike price and expiration date) to
avoid assignment.
Basic Trading Strategies 121
ccc_fontanills_ch4_76-129.qxd 12/17/04 4:03 PM Page 121
Covered Call Road Map
In order to place a covered call, the following 13 guidelines should be
observed:
1. A covered call is a conservative income strategy designed to pro-
vide limited protection against decreases in the price of a long un-
derlying stock position. Look for a range-bound market or a bullish
market where you anticipate a steady increase in the price of the
underlying stock.
2. Check to see if the stock has liquid options.
3. Review call option premiums and strike prices no more than 45
days out.
4. Investigate implied volatility values to see if the options are over-
priced or undervalued. Look for expensive options to get the most out
of selling the call.
5. Explore past price trends and liquidity by reviewing price and volume
charts over the past year.
6. Choose a higher strike call no more than 45 days out to sell against
long shares of the underlying stock and then calculate the maximum
profit, which is limited to the credit received from the sale of the short
call plus the profit made from the difference between the stock’s price
at initiation and the call strike price.
7. Determine which spread to place by calculating:
• Limited Risk: Limited to the downside as XYZ can only fall below
the breakeven to zero.
• Limited Reward: Limited to the credit received from the short call
plus the strike price minus the initial stock price.
• Breakeven: Calculated by subtracting the short call premium from
the price of the underlying stock at initiation.
8. Create a risk profile of the most promising option combination and
graphically determine the trade’s feasibility. Note the unlimited risk
beyond the breakeven.
9. Write down the trade in your trader’s journal before placing the trade
with your broker to minimize mistakes made in placing the order and
to keep a record of the trade.
10. Make an exit plan before you place the trade. You must be willing to sell
the long stock at the short call’s strike price in case the call is assigned.
122
THE OPTIONS COURSE
ccc_fontanills_ch4_76-129.qxd 12/17/04 4:03 PM Page 122
11. Contact your broker to buy and sell the chosen options. Place the
trade as a limit order so that you limit the net debit of the trade.
12. Watch the market closely as it fluctuates. The profit on this strategy is
unlimited—a loss occurs if the underlying stock closes at or below
the breakeven points. You can also adjust the position back to a delta
neutral to increase profit potential.
13. Choose an exit strategy depending on the movement of the underlying
stock:
• The price of the stock rises above the short strike: The short
call is assigned and exercised by the option holder. You can then
use the 100 shares from the original long stock position to satisfy
your obligation to deliver 100 shares of the underlying stock to the
option holder at the short call strike price. This scenario allows you
to take in the maximum profit.
• The price of the stock falls below the short call strike price,
but stays above the initial stock price: The short call expires
worthless and you get to keep the premium received. No losses
have occurred on the long stock position and you are ready to sell
another call to offset your risk.
• The stock falls below the initial stock price but stays above
the breakeven: The long stock position starts to lose money, but
this loss is offset by the credit received from the short call. As long
as the stock does not fall below the breakeven, the position will
break even or make a small profit.
• The stock falls below the breakeven: Let the short option ex-
pire worthless and use the credit received to partially hedge the
loss on the long stock position.
Long Put Road Map
In order to place a long put, the following 13 guidelines should be observed:
1. Look for a low-volatility market where a steady decrease in price is
anticipated.
2. Check to see if this stock has liquid options available.
3. Review options premiums with various expiration dates and strike
prices. Use options with more than 90 days to expiration.
4. Investigate implied volatility values to see if the options are over-
priced or undervalued. Look for options with low implied volatility.
Basic Trading Strategies 123
ccc_fontanills_ch4_76-129.qxd 12/17/04 4:03 PM Page 123
5. Review price and volume charts over the past year to explore past
price trends and liquidity.
6. Choose a long put option with the best profit-making probability. De-
termine which option to buy by calculating:
• Limited Risk: Limited to the initial premium required to purchase
the put option.
• Limited Reward: Limited to the downside as the underlying stock
can only fall to zero.
• Breakeven: Put strike – put premium.
7. Create a risk profile for the trade to graphically determine the trade’s
feasibility. The profit/loss line slopes up from right to left.
8. Write down the trade in your trader’s journal before placing the trade
with your broker to minimize mistakes made in placing the order and
to keep a record of the trade.
9. Make an exit plan before you place the trade. Determine a profit and
loss percentage that will trigger an exit of the position. Close out the
entire trade by 30 days to expiration.
10. Contact your broker to buy the chosen put option. A margin deposit is
not required.
11. Watch the market closely as it fluctuates. If the market continues to
fall, hold onto the put option until you have hit your target profit or a
reversal seems imminent.
12. If the underlying market gives a dividend to its stockholders, this will
have a positive effect on the price of a put option because a dividend
usually results in a slight decline in the price of a stock.
13. Choose an exit strategy based on the price movement of the underly-
ing stock and the effects of changes in the implied volatility of the
put option:
• The underlying stock falls below the breakeven: Either offset
the long put by selling a put option with the same strike and expira-
tion at an acceptable profit or exercise the put option to go short the
underlying market. You can hold this short position or cover the short
by buying the shares back at the current lower price for a profit.
• The underlying stock rises above the breakeven: You can
wait for a reversal or offset the long put by selling an identical put
option and using the credit received to mitigate the loss. The most
you can lose is the initial premium paid for the put.
124 THE OPTIONS COURSE
ccc_fontanills_ch4_76-129.qxd 12/17/04 4:03 PM Page 124
Short Put Road Map
In order to place a short put, the following 13 guidelines should be observed:
1. Look for a high-volatility market where an increase or steady rise is
anticipated.
2. Check to see if this stock has liquid options available.
3. Review options premiums with various expiration dates and strike
prices. Options with less than 45 days to expiration are best.
4. Investigate implied volatility values to see if the options are over-
priced or undervalued. Look for options with high implied volatility,
and thus a higher premium.
5. Review price and volume charts over the past year to explore past
price trends and liquidity.
6. Choose a short put option with the best profit-making probability.
Determine which put option to sell by calculating:
• Limited Risk: Limited to the downside below the breakeven as the
underlying stock can only fall to zero.
• Limited Reward: Limited to the initial put premium received as a
credit.
• Breakeven: Put strike – put premium.
7. Create a risk profile for the trade to graphically determine the trade’s
feasibility. The risk graph slopes down from right to left, showing a
limited profit.
8. Write down the trade in your trader’s journal before placing the trade
with your broker to minimize mistakes made in placing the order and
to keep a record of the trade.
9. Make an exit plan before you place the trade. Determine a profit and
loss percentage that will trigger an exit of the position.
10. Contact your broker to sell the chosen put option. This strategy
requires a margin deposit; the amount depends on your broker’s
discretion.
11. Watch the market closely as it fluctuates. If the price of the underly-
ing stock falls below the short strike price, it will most likely be as-
signed. If exercised, the option writer is obligated to purchase 100
shares of the underlying asset at the short strike price (regardless
of the decrease in the price of the underlying stock) from the option
holder.
Basic Trading Strategies 125
ccc_fontanills_ch4_76-129.qxd 12/17/04 4:03 PM Page 125
12. If the underlying market gives a dividend to its stockholders, this will
have a negative effect on the price of a short put because a dividend
usually results in a slight decline in the price of a stock.
13. Choose an exit strategy based on the price movement of the underly-
ing stock and the effects of changes in the implied volatility of the put
option:
• The underlying stock continues to rise or remains stable:
Wait for the option to expire worthless and keep the credit received
from the premium.
• The underlying stock reverses and starts to fall: Exit
the position by offsetting it through the purchase of an identical
put option (same strike price and expiration date) to avoid
assignment.
Covered Put Road Map
In order to place a covered put, the following 13 guidelines should be
observed:
1. Look for a range-bound market or bearish market where you antici-
pate a slow decrease in the price of the underlying stock.
2. Check to see if this stock has options.
3. Review put option premiums and strike prices no more than 45
days out.
4. Explore past price trends and liquidity by reviewing price and volume
charts over the past year.
5. Investigate implied volatility values to see if the options are over-
priced or undervalued.
6. Choose a lower strike put no more than 45 days out to sell against
short shares of the underlying stock.
7. Determine which trade to place by calculating:
• Unlimited Risk: The maximum risk is unlimited to the upside
above the breakeven. Requires margin to place.
• Limited Reward: The maximum profit is limited to the credit re-
ceived from the sale of the short put option plus the profit made
from the difference between the stock’s price at initiation and the
short put strike price.
126
THE OPTIONS COURSE
ccc_fontanills_ch4_76-129.qxd 12/17/04 4:03 PM Page 126
• Breakeven: Calculated by adding the short put premium to the
price of the underlying stock at initiation.
8. Risk is unlimited to the upside as the underlying asset rises above the
breakeven. Create a risk profile for the trade to graphically determine
the trade’s feasibility.
9. Write down the trade in your trader’s journal before placing the trade
with your broker to minimize mistakes made in placing the order and
to keep a record of the trade.
10. Choose your exit strategy in advance. How much money is the maxi-
mum amount you are willing to lose? How much profit do you want to
make on the trade?
11. Contact your broker to sell the stock and sell the chosen put option
against it. Choose the most appropriate type of order (market order,
limit order, etc.). This strategy will require a large margin to place,
depending on your brokerage’s requirements.
12. Watch the market closely as it fluctuates. The profit on this strategy is
limited. Keep in mind that an unlimited loss occurs if and when the
underlying stock rises above the breakeven point.
13. Choose an exit strategy:
• The price of the stock falls below the short put strike price:
The short put is assigned to an option holder. You can then use the
100 shares you are obligated to buy at the short put strike price to
cover the original short stock position. This scenario allows you to
take in the maximum profit.
• The price of the stock rises above the short strike, but stays
below the initial stock price: The short put expires worthless
and you get to keep the premium received. No losses have occurred
on the short stock position and you are ready to place another
short put position to bring in additional profit on the short stock
position if you wish.
• The price of the stock rises above the initial stock price, but
stays below the breakeven: The short stock position starts to
lose money, but this loss is offset by the credit received from the
short put. As long as the stock doesn’t rise above the breakeven,
the position will break even or make a small profit.
• The price of the stock rises above the breakeven: Let the
short put expire worthless and use the credit received to partially
hedge the increasing loss on the short stock position.
Basic Trading Strategies 127
ccc_fontanills_ch4_76-129.qxd 12/17/04 4:03 PM Page 127