The option trader s guide to probability volatility and timing phần 10 pps
Bạn đang xem bản rút gọn của tài liệu. Xem và tải ngay bản đầy đủ của tài liệu tại đây (461.73 KB, 54 trang )
Strategy Reviews 523
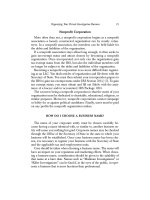
Call Ratio Backspread
Strategy: Sell lower strike calls and buy a
greater number of higher strike calls (the ratio
must be less than .67).
Market Opportunity: Look for a market
where you anticipate a sharp rise with increas-
ing volatility; place as a credit or at even.
Maximum Risk: Limited. [(Number of short
calls × difference in strikes) × 100] – net credit
(or + net debit).
Maximum Profit: Unlimited to the upside above the upside breakeven.
Upside Breakeven: Higher strike + [(difference in strikes × number of
short calls) ÷ (number of long calls – number of short calls)] – net credit
(or + net debit).
Downside Breakeven: Lower strike + (net credit ÷ number of short calls).
No downside breakeven exists if the trade is entered with a net debit.
FIGURE C.20 Call
Ratio Backspread
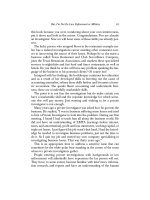
Put Ratio Backspread
Strategy: Sell higher strike puts and buy a
greater number of lower strike puts (the ratio
must be less than .67).
Market Opportunity: Look for a market
where you anticipate a sharp decline with in-
creased volatility; place as a credit or at even.
Maximum Risk: Limited. [(Number of short
puts × difference in strikes) × 100] – net credit
(or + net debit).
Maximum Profit: Limited to the downside (as the underlying can only fall
to zero) below the breakeven.
Upside Breakeven: Higher strike – (net credit ÷ number of short puts).
No upside breakeven exists if the trade is entered with a new debit.
Downside Breakeven: Lower strike – [(number of short puts × difference
in strikes) ÷ (number of long puts – number of short puts)] + net credit (or
– net debit).
FIGURE C.21 Put
Ratio Backspread
ccc_fontanills_appc_511-526.qxd 12/17/04 4:45 PM Page 523
524 THE OPTIONS COURSE
Long Butterfly
Strategy: Buy lower strike option, sell 2
higher strike options, and buy a higher strike
option with the same expiration date (all calls
or all puts).
Market Opportunity: Look for a range-bound
market that is expected to stay between the
breakeven points.
Maximum Risk: Limited to the net debit paid.
Maximum Profit: Limited. (Difference between strikes – net debit) × 100.
Profit exists between breakevens.
Upside Breakeven: Highest strike – net debit.
Downside Breakeven: Lowest strike + net debit.
FIGURE C.22 Long
Butterfly Spread
Long Condor
Strategy: Buy lower strike option, sell higher
strike option, sell an even higher strike option,
and buy an even higher strike option with the
same expiration date (all calls or all puts).
Market Opportunity: Look for a range-
bound market that is expected to stay be-
tween the breakeven points.
Maximum Risk: Limited to the net debit paid.
Maximum Profit: Limited. (Difference between strikes – net debit) × 100.
Profit exists between breakevens.
Upside Breakeven: Highest strike – net debit.
Downside Breakeven: Lowest strike + net debit.
FIGURE C.23 Long
Condor Spread
ccc_fontanills_appc_511-526.qxd 12/17/04 4:45 PM Page 524
Strategy Reviews 525
Long Iron Butterfly
Strategy: Buy a higher strike call, sell a lower
strike call, sell a higher strike put, and buy a
lower strike put with the same expiration date.
Market Opportunity: Look for a range-bound
market that you anticipate to stay between the
breakeven points.
Maximum Risk: Limited. (Difference between
strikes × 100) – net credit.
Maximum Profit: Limited to the net credit
received. Profit occurs between the breakevens.
Upside Breakeven: Strike price of middle short call + net credit.
Downside Breakeven: Strike price of middle short put – net credit.
FIGURE C.24 Long
Iron Butterfly Spread
Calendar Spread
Strategy: Sell a short-term option and buy a
long-term option using at-the-money options
with as small a net debit as possible (use all
calls or all puts). Calls can be used for a more
bullish bias and puts can be used for a more
bearish bias.
Market Opportunity: Look for a range-
bound market that is expected to stay be-
tween the breakeven points for an extended
period of time.
Maximum Risk: Limited to the net debit paid.
Maximum Profit: Limited. Use software for accurate calculation.
Breakeven: Use options analysis software for accurate calculation.
FIGURE C.25
Calendar Spread
ccc_fontanills_appc_511-526.qxd 12/17/04 4:45 PM Page 525
526 THE OPTIONS COURSE
Diagonal Spread
Strategy: Sell a short-term option and buy a
long-term option with different strikes and as
small a net debit as possible (use all calls or
all puts).
•A bullish diagonal spread employs a
long call with a distant expiration and a
lower strike price, along with a short call
with a closer expiration date and higher
strike price.
•A bearish diagonal spread combines a long put with a distant expi-
ration date and a higher strike price along with a short put with a closer
expiration date and lower strike price.
Market Opportunity: Look for a range-bound market that is expected to
stay between the breakeven points for an extended period of time.
Maximum Risk: Limited to the net debit paid.
Maximum Profit: Limited. Use software for accurate calculation.
Breakevens: Use options analysis software for accurate calculation.
FIGURE C.26 Diagonal
Spread
Collar Spread
Strategy: Buy (or already own) 100 shares of
stock, buy an ATM put, and sell an OTM call.
Try to offset the cost of the put with the pre-
mium from the short call.
Market Opportunity: Protect a stock hold-
ing from a sharp drop for a specific period of
time and still participate in a modest increase
in the stock price.
Maximum Risk: Initial stock price – put strike + net debit (or – net credit).
Maximum Profit: (Call strike – initial stock price) – net debit (or + net
credit).
Breakeven: Initial stock price + [(put premium – call premium) ÷ number
of shares].
FIGURE C.27 Collar
Spread
ccc_fontanills_appc_511-526.qxd 12/17/04 4:45 PM Page 526
APPENDIX D
Success
Guides
FIVE MINUTE SUCCESS FORMULA: A QUICK
METHOD FOR FINDING PROMISING TRADES
1. Look for stocks that are up (+) or down (–) at least 30 percent
in value for the day.
• You are looking for good momentum trades (where fear and greed
are really driving the market).
2. From these, choose those with volume greater than 300,000
shares for the day.
• Greater than 1 million shares a day is better; 10 million is best.
• Look for volume spikes (market moves generally begin or end on
volume spikes).
• Call your broker twice a day to check on potential movers (call a
half hour after the market opens and 15 minutes prior to market
close).
3. Try to find out/ask your broker why each of these stocks is
moving.
• Usually movement is based on really good news or really bad news,
including:
• Earnings releases.
• Earnings upgrades/downgrades.
• New product announcements.
527
ccc_fontanills_appd_527-532.qxd 12/17/04 4:45 PM Page 527
• New agency approvals.
• Stock splits.
• Merger announcements.
• Friendly or hostile takeovers.
• Litigation.
• Accounting irregularities.
• No news (can mean insider buying/selling).
• Good reasons can indicate big moves.
• Takeovers that are done deals produce little movement and are
generally not good plays.
4. Determine which of these stocks has options.
• Forget those stocks that don’t have any options.
• Consider only those stocks that have liquid options available.
• If none exist, try again tomorrow.
5. Choose a low cost/low risk strategy.
• A good goal is to find trades that cost less than $100 for each
position.
• Cheapest play for an up move? Buy calls, bull call spreads, or call
ratio backspreads.
• Cheapest play for an down move? Buy puts, bear put spreads, or
put ratio backspreads.
• Cheapest play for a neutral move? Straddles, strangles, or long syn-
thetic straddles.
• Calculate the maximum risk, maximum reward, and upside and
downside breakevens for each possible position to find the trade
with the best probability of profitability.
6. Find out/ask your broker how many block trades (institu-
tional trades of more than 5,000 shares in size) have traded
in these stocks.
• Choose only those stocks that have 10 or more block trades on a
volume of greater than 300,000 shares for the day.
7. Find out/ask your broker how many blocks are trading on the
upticks or downticks (i.e., how many institutions are buying
or selling).
• Blocks trading on upticks—stock is moving higher.
• Blocks trading on downticks—stock is moving lower.
528
THE OPTIONS COURSE
ccc_fontanills_appd_527-532.qxd 12/17/04 4:45 PM Page 528
8. Select your entry strategy.
• Put the trade on in the last 15 minutes before the market closes
(provides the best fills and prices).
• Buy options with at least 90 days till expiration (six months or
more is even better).
• Consider multiple positions so that you can eventually create a free
trade.
• If you miss the first big move, try to position yourself for the
rebound (wait for one “ugly” day, one reversal from the top or
bottom, and then place the trade).
9. Select your exit strategy.
• General Rule: You should exit the trade 30 days prior to expira-
tion, unless the profit on the trade depends on a short option ex-
piring OTM.
• If you hold multiple positions, sell off half when they double in
value to produce a free trade. Ride the free trade to maximize
profits.
• In an up move, if the stock breaks 20 percent in price from a new
high, then close out the position.
• In a down move, if the stock breaks 20 percent in price from a new
low, then close out the position.
RULES FOR TRADING SUCCESS
1. Use a reliable and knowledgeable broker who offers a balance
between low commission rates and fast and accurate fills.
2. Research all aspects of a trade using your favorite techniques—
fundamental and technical analysis—as well as sentiment and broad
market analysis, and scheduled and breaking news.
3. Know what you are trying to do: Define your goals. Select your time
frame and availability. Create a risk graph for your position.
4. Look for trades with a reward/risk ratio that is greater than 2 to 1.
5. Buy low volatility and sell high volatility.
6. Do not leg into or out of a spread. Place all sides of the trade at the
same time as a single order
7. Write down all orders and read them to your broker to make sure
you call your orders in correctly.
Success Guides 529
ccc_fontanills_appd_527-532.qxd 12/17/04 4:45 PM Page 529
8. To get the price you want, the best time to place your order is at the
end of the day about 15 minutes before the close.
9. Risk no more than 5 percent of your trading account on any one
trade.
10. Risk no more than 50 percent of your total trading account at any
one time.
11. Keep a record of all your trades and review them periodically.
12. Review all your trades every six months, especially the ones you lost
money on; identify bad trading habits/patterns, and try not to repeat
them!
530
THE OPTIONS COURSE
TABLE D.1 Market Acronyms
AAF—asset allocation fund
AAGR—average annual growth rate
AAR—average annual return
ABS—automated bond system
AD Line—advance/decline line
ADR—American Depositary Receipt
ADX—Average Directional Movement
Index
AGI—adjusted gross income
AMEX—American Stock Exchange
AMT—Alternative Minimum Tax
AON—all or none
APR—annual percentage rate
APV—adjusted present value
APY—annual percentage yield
AR—accounts receivable
ARM—adjustable rate mortgage
ASX—Australian Stock Exchange
ATM—at-the-money
ATP—arbitrage trading program
ATR—average true range
BIC—bank investment contract
BIS—Bank for International Settlements
BOP—balance of payments
BOT—balance of trade
BP—basis point
CAPEX—capital expenditure
CAPM—capital asset pricing model
CAPS—convertible adjustable preferred
stock
CBOE—Chicago Board Options Exchange
CBOT—Chicago Board of Trade
CCE—cash and cash equivalents
CCI—Commodity Channel Index
CD—certificate of deposit
CEO—chief executive officer
CFA—chartered financial analyst
CFO—chief financial officer
CFP—certified financial planner
CFPS—cash flow per share
CFTC—Commodity Futures Trading
Commission
COGS—cost of goods sold
COO—chief operating officer
CPA—certified public accountant
CPI—consumer price index
CPM—cost per thousand
CSI—Commodity Selection Index
CUSIP—Committee on Uniform Securities
Identification Procedures
DAT—direct-access trading
DD—due diligence
DI—disposable income
DJIA—Dow Jones Industrial Average
DJTA—Dow Jones Transportation Average
DJUA—Dow Jones Utility Average
DMI—Directional Movement Index
DPSP—deferred profit sharing plan
DRIP—dividend reinvestment plan
EAFE—European, Australasian, Far East
Equity Index
EBIT—earnings before interest and taxes
EBITDA—earnings before interest, taxes,
depreciation, and amortization
ECN—electronic communication network
EDGAR—Electronic Data Gathering
Analysis and Retrieval
EMA—exponential moving average
ccc_fontanills_appd_527-532.qxd 12/17/04 4:45 PM Page 530
Success Guides 531
TABLE D.1 (Continued)
(continues)
EPS—earnings per share
ERISA—Employee Retirement Income
Security Act
ESO—employee stock option
ETF—exchange-traded fund
FAD—funds available for distribution
FASB—Financial Accounting Standards
Board
FDIC—Federal Deposit Insurance
Corporation
FFO—funds from operations
FIFO—first in, first out
FHLMC—Federal Home Loan Mortgage
Corporation (Freddie Mac)
FNMA—Federal National Mortgage
Association (Fannie Mae)
FOMC—Federal Open Market Committee
FRA—forward-rate agreement
FRB—Federal Reserve Board
FRS—Federal Reserve System
GAAP—generally accepted accounting
principles
GARP—growth at a reasonable price
GDP—gross domestic product
GIC—guaranteed investment certificate
GNMA—Government National Mortgage
Association (Ginnie Mae)
GO—general obligation bond
GSE—government-sponsored enterprise
GTC—good till canceled order
HOLDRS—Holding Company Depositary
Receipts
HTML—hypertext markup language
IFCI—International Finance Corporation
Investable Index
IPO—initial public offering
IRA—individual retirement account
IRR—internal rate of return
ISO—International Organization for
Standardization
ITM—in-the-money
IV—implied volatility
JSE—Johannesburg Stock Exchange
KCBT—Kansas City Board of Trade
LBO—leveraged buyout
LEAPS—long-term equity anticipation
securities
LIFO—last in, first out
LLC—limited liability company
LP—limited partnership
MA—moving average
MACD—moving average
convergence/divergence
MEM—maximum entropy method
MER—management expense ratio
MIPS—Monthly Income Preferred
Securities
MIT—market if touched
MPT—modern portfolio theory
MSCI—Morgan Stanley Capital
International
NASD—National Association of Securities
Dealers
NASDAQ—National Association of
Securities Dealers Automated
Quotations
NAV—net asset value
NMS—normal market size
NOI—net operating income
NPV—net present value
NSO—nonqualified stock options
NYSE—New York Stock Exchange
OBV—on-balance volume
OI—open interest
OID—original issue discount
OPEC—Organization of Petroleum
Exporting Countries
OTC—over-the-counter
OTM—out-of-the-money
PDF—portable document format
P/E—price-earnings ratio
PEG—price/earnings to growth
POP—public offering price
PPI—producer price index
QQQ—ticker symbol for Nasdaq 100
Trust
R&D—research and development
REIT—real estate investment trust
RIC—return on invested capital
ROA—return on assets
ROE—return on equity
ROI—return on investment
RPI—Retail Price Index
RSI—Relative Strength Index
SAI—Statement of Additional Information
SAR—stop and reverse
ccc_fontanills_appd_527-532.qxd 12/17/04 4:45 PM Page 531
532 THE OPTIONS COURSE
TABLE D.1 (Continued)
SEC—Securities and Exchange
Commission
SEMI—Semiconductor Equipment and
Materials International
SEP—simplified employee pension
SIC—Standard Industrial Classification
SIPC—Securities Investor Protection
Corporation
SMA—simple moving average
SOES—small order execution system
SOX—Philadelphia Semiconductor
Index
S&P—Standard & Poor’s
SPDRs—Standard & Poor’s Depositary
Receipts (ETF)
SSR—sum of squared residuals
SV—statistical volatility
SWIFT—Society for Worldwide Interbank
Financial Telecommunication
TPO—time price opportunity
TRIN—trading Index
TSE—Toronto Stock Exchange
UN—United Nations
VIX—CBOE Market Volatility Index
VPT—volume price trend
VXN—Nasdaq Volatility Index
WSE—Winnipeg Commodity Exchange
XD—ex-dividend
XR—ex-rights
XY—ex-warrants
YTD—year-to-date
YTM—yield to maturity
ccc_fontanills_appd_527-532.qxd 12/17/04 4:45 PM Page 532
Glossary
ABC wave Elliott wave terminology for a three-wave countertrend price move-
ment. Wave A is the first price wave against the trend of the market. Wave B is a
corrective wave to Wave A. Wave C is the final price move to complete the coun-
tertrend price action.
adjustment The process of buying or selling instruments to bring a position delta
back to zero and increase profits.
All Ordinaries Index The major index of Australian stocks. This index repre-
sents 280 of the most active listed companies or the majority of the equity
capitalization (excluding foreign companies) listed on the Australian Stock Ex-
change (ASX).
American Stock Exchange (AMEX) A private, not-for-profit corporation, located
in New York City, that handles approximately one-fifth of all securities trades
within the United States.
American-style option An option contract that can be exercised at any time be-
tween the date of purchase and the expiration date. Most exchange-traded options
are American-style.
amortization The paying off of debt in regular installments over a period of time.
analyst Employee of a brokerage or fund management house who studies com-
panies and makes buy and sell recommendations on their stocks. Most specialize
in a specific industry.
annual earnings change (percent) The historical earnings change between the
most recently reported fiscal year earnings and the preceding year earnings.
annual net profit margin (percent) The percentage that the company earned
from gross sales for the most recently reported fiscal year.
annual percentage rate (APR) The cost of credit that the consumer pays, ex-
pressed as a simple annual percentage.
annual rate of return The simple rate of return earned by an investor for each
year.
533
ccc_fontanills_glos_533-556.qxd 12/17/04 4:45 PM Page 533
annual report A report issued by a company to its shareholders at the end of
the fiscal year, containing a description of the firm’s operations and financial
statements.
annuity A series of constant payments at uniform time intervals (for example,
periodic interest payments on a bond).
appreciation The increase in value of an asset.
arbitrage The simultaneous purchase and sale of identical financial instruments
or commodity futures in order to make a profit, where the selling price is higher
than the buying price.
arbitrageur An individual or company who takes advantage of momentary dis-
parities in prices between markets to lock in profits because the selling price is
higher than the buying price.
ascending triangle A sideways price pattern with two converging trend lines;
the top trend line is relatively flat (resistance), while the bottom trend line (sup-
port) is rising. This is generally considered a bullish formation, since most of the
time it will break out to the upside.
ask The lowest price of a specific market that market makers, floor brokers, or
specialists are willing to sell at.
assignment When the short option position is notified of the long position’s in-
tent to exercise. The long position exercises and the short position is assigned.
The long position has the right to exercise; if the trader chooses to exercise, the
short position must oblige.
at-the-money (ATM) When the strike price of an option is the same as the cur-
rent price of the underlying instrument.
at-the-opening order An order that specifies execution at the opening of the
market or else it is canceled.
auction market A market in which buyers enter competitive bids and sellers en-
ter competitive offers simultaneously. Most stock and bond markets, including
those on the NYSE, function this way.
automatic exercise The automatic exercise of an in-the-money option at expira-
tion by the clearing firm.
Average Directional Index (ADX) Developed by Welles Wilder, the ADX indi-
cates the degree in which a security is trending. It is a normalized index that uses
the components of the Directional Movement Indicator (DMI). It is typically calcu-
lated for a 14-period time frame and does not usually move into extreme ranges.
The ADX indicates a trending market when the indicator is rising and a nontrend-
ing market when the indicator is falling. Standard use of the ADX includes the fol-
lowing: an ADX line rising above 20, signals a trending market, while an ADX line
falling below 40, signals the start of a nontrending environment.
534 GLOSSARY
ccc_fontanills_glos_533-556.qxd 12/17/04 4:45 PM Page 534
back months The futures or options on futures months being traded that are fur-
thest from expiration.
backspread A spread in which more options are purchased than sold and where
all options have the same underlying asset and expiration date. Backspreads are
usually delta neutral.
back-testing The testing of a strategy based on historical data to see if the re-
sults are consistent.
balance sheet A financial statement providing an instant picture of a firm’s or in-
dividual’s financial position; lists assets, liabilities, and net worth.
bar chart A chart composed of a vertical bar in the center that shows the price
range for the period, as well as a horizontal hash mark that identifies the opening
price. By reviewing the chart alone, a trader can determine the high and low trades
for the time period designated on the chart.
bear An investor who believes that a security or the market is falling or is ex-
pected to fall.
bear call spread A strategy in which a trader sells a lower strike call and buys a
higher strike call to create a trade with limited profit and limited risk. A fall in the
price of the underlying asset increases the value of the spread. Net credit transac-
tion; maximum loss = difference between the strike prices less net credit; maxi-
mum gain = net credit.
bear market A declining stock market over a prolonged period of time, usually
caused by a weak economy and subsequent decreased corporate profits.
bear put spread A strategy in which a trader sells a lower strike put and buys a
higher strike put to create a trade with limited profit and limited risk. A fall in the
price of the underlying asset increases the value of the spread. Net debit transac-
tion; maximum gain = difference between strike prices less the net debit; maxi-
mum loss = net debit.
bid The highest price at which a floor broker, trader, or dealer is willing to buy a
security or commodity for a specified time.
bid and asked The bid (the highest price a buyer is prepared to pay for a trading
asset) and the asked (the lowest price acceptable to a prospective seller of the
same security) together comprise a quotation or quote.
bid-asked spread The difference between bid and asked prices.
bid up When demand for an asset drives up the price paid by buyers.
block trade A trade so large (for example, 5,000 shares of stock or $200,000
worth of bonds) that the normal auction market cannot absorb it in a reasonable
time at a reasonable price.
blow-off top A steep and rapid increase in price followed by a steep and rapid
drop in price. This indicator is often used in technical analysis.
Glossary 535
ccc_fontanills_glos_533-556.qxd 12/17/04 4:45 PM Page 535
blue-chip stock A stock with solid value, good security, and a record of dividend
payments or other desirable investment characteristics with the best market capi-
talization in the marketplace. Many times these stocks have a record of consistent
dividend payments, receive extensive media coverage, and offer a host of other
beneficial investment attributes. This term is derived from poker, where blue chips
hold the most value. On the downside, blue-chip stocks tend to be quite expensive
and often have little room for growth.
board lot The smallest quantity of shares traded on an exchange at standard
commission rates.
Bollinger bands Specific types of envelopes that use expanding and contract-
ing values employed as a lagging indicator. This is accomplished by setting the
envelope lines above and below the moving average equal to a value that varies
with price. Commonly used settings for Bollinger bands include the 20-period ex-
ponential moving average, plus or minus two standard deviations, to create the
envelope channels.
bond Financial instruments representing debt obligations issued by the govern-
ment or corporations traded in the futures market. A bond promises to pay its
holders periodic interest at a fixed rate (the coupon), and to repay the principal of
the loan at maturity. Bonds are issued with a par or face value of $1,000 and are
traded based on their interest rates—if the bond pays more interest than available
elsewhere, its worth increases.
breakeven (1) The point at which gains equal losses; (2) the market price that a
stock or futures contract must reach for an option to avoid loss if exercised; for a
call, the breakeven equals the strike price plus the premium paid; for a put, the
breakeven equals the strike price minus the premium paid.
break out A rise in the price of an underlying instrument above its resistance
level or a drop below the support level.
broad-based index An index designed to reflect the movement of the market
as a whole (for example, the S&P 100, the S&P 500, and the Amex Major Market
Index).
broker An individual or firm that charges a commission for executing buy and
sell orders.
bull An investor who believes that a market is rising or is expected to rise.
bull call spread A strategy in which a trader buys a lower strike call and sells a
higher strike call to create a trade with limited profit and limited risk. A rise in the
price of the underlying asset increases the value of the spread. Net debit transac-
tion; maximum loss = net debit; maximum gain = difference between strike prices
less the net debit.
bull market A rising stock market over a prolonged period of time, usually
caused by a strong economy and subsequent increased corporate profits.
536 GLOSSARY
ccc_fontanills_glos_533-556.qxd 12/17/04 4:45 PM Page 536
bull put spread A strategy in which a trader sells a higher strike put and buys a
lower strike put to create a trade with limited profit and limited risk. A rise in the
price of the underlying asset increases the value of the spread. Net credit transac-
tion; maximum loss = difference between strike prices less net credit; maximum
gain = net credit.
butterfly spread The sale (or purchase) of two identical options, together with
the purchase (or sale) of one option with an immediately higher strike, and one
option with an immediately lower strike. All options must be the same type, have
the same underlying asset, and have the same expiration date.
buy on close To buy at the end of a trading session at a price within the closing
range.
buy on opening To buy at the beginning of a trading session at a price within the
opening range.
buy stop order An order to purchase a security entered at a price above the cur-
rent offering price, triggered when the market hits a specified price.
CAC 40 Index A broad-based index of 40 common stocks on the Paris Bourse.
calendar spread A spread consisting of one long option with a far off expiration
month and one short option with 30 to 45 days until expiration. Both options must
be the same type and have the same exercise price.
call option An option contract which gives the holder the right, but not the oblig-
ation, to buy a specified amount of an underlying security at a specified price
within a specified time in exchange for paying a premium.
call premium The amount a call option costs.
candlestick chart Chart that includes the price range for the day, as well as the
opening and closing price. A candlestick bar includes a “body” bounded by the
open and close for the period and “shadows” which extend above and below the
body to the high and low prices for the period. When the “body” of the candlestick
is dark (or red in color charts), the closing price was below the opening. When the
body of the candlestick is white (or green in color charts), the closing price was
higher than the opening.
cancel (CXL) order An order is used to eliminate a prior order that has not yet
been executed. A canceled order must be communicated by a trader to the broker
and such an order is not executed or confirmed until the floor broker reports back
that the trader is out of the trade. Understand that once an order has been filled, it
cannot be canceled, so a CXL order is really only a request to cancel. Therefore,
you should not assume an order has been canceled just because you enter a re-
quest to do so—wait for the confirmation.
capital The amount of money an individual or business has available.
capital gain The profit realized when a capital asset is sold for a higher price
than the purchase price.
Glossary 537
ccc_fontanills_glos_533-556.qxd 12/17/04 4:45 PM Page 537
capitalization Refers to the current value of a corporation’s outstanding shares
in dollars.
capital loss The loss incurred when a capital asset is sold for a lower price than
the purchase price.
capped-style option An option with an established profit cap or cap price.
cash account An account in which the customer is required to pay in full for all
purchased securities.
cash dividend A dividend paid in cash to a shareholder out of a corporation’s
profits.
change The difference between the current price of a security and the price of
the previous day.
Chicago Board of Trade (CBOT) Established in 1886, the CBOT is the oldest
commodity exchange in the United States and primarily lists grains, Treasury-
bonds and notes, metals, and indexes.
Chicago Board Options Exchange (CBOE) The largest options exchange in the
United States.
churning When a registered representative performs excessive trading in a cus-
tomer’s account to increase commissions. This is deemed illegal by the SEC and
exchange rules, since the registered representative is not seeking improved re-
turns and does not have the customer’s interests in mind.
class of options Option contracts of the same type (call or put), style, and un-
derlying security.
clearinghouse An institution established separately from the exchanges to en-
sure timely payment and delivery of securities.
close The price of the last transaction for a particular security each day.
closing purchase A transaction to eliminate a short position.
closing range The high and low prices recorded during the period designated as
the official close.
closing sale A transaction to eliminate a long position.
commission A service charge assessed by a broker and his/her investment com-
pany in return for arranging the purchase or sale of a security.
commodity Any bulk good traded on an exchange (for example, metals, grains,
and meats).
Commodity Futures Trading Commission (CFTC) A commission created by the
Commodity Futures Trading Commission Act of 1974 to ensure the open and effi-
cient operation of the futures markets.
538 GLOSSARY
ccc_fontanills_glos_533-556.qxd 12/17/04 4:45 PM Page 538
condor The sale or purchase of two options with consecutive exercise prices, to-
gether with the sale or purchase of one option with an immediately lower exercise
price and one option with an immediately higher exercise price.
consolidation pattern A resting period where the price action is in equilibrium.
Typically, price action narrows and the volume drops off while investors and
traders attempt to get a better sense of the next move, up or down. Visually, a con-
solidating market may resemble a triangle or a rectangle.
consumer price index (CPI) A measure of price changes in consumer goods and
services. This index is used to identify periods of economic inflation or deflation.
contract A unit of trading for a financial or commodity future, or option.
contrarian approach Trading against the majority view of the marketplace.
correction A sudden decline in the price of a security or securities after a period
of market strength.
covered call A short call option position against a long position in an underlying
stock or future.
covered put A short put option position against a short position in an underlying
stock or future.
cover the short To buy shares of stock to replenish those borrowed from your
brokerage to place a short sale.
credit spread The difference in value between two options, where the value of
the short position exceeds the value of the long position.
cross rate The current exchange rate between differing currencies.
cycle The tendency for price action to repeat uptrends and downtrends in a
relatively predictable fashion over a prescribed period of time. Price cycles are
measured low to low, high to high, or low to high. Various types of measure-
ments are possible.
daily range The difference between the high and low price of a security in one
trading day.
day order An order to buy or sell a security that expires if not filled by the end of
the day.
day trade The purchase and sale of a position in the same day.
day trading An approach to trading in which the same position is entered and
exited within one day.
debit spread The difference in value between two options, where the value of
the long position exceeds the value of the short position.
deep in-the-money A deep in-the-money call option has a strike price well below
the current price of the underlying instrument. A deep in-the-money put option
Glossary 539
ccc_fontanills_glos_533-556.qxd 12/17/04 4:45 PM Page 539
has a strike price well above the current price of the underlying instrument. Both
primarily consist of intrinsic value.
delayed-time quotes Quotes from a data service provider that are delayed up to
20 minutes from real-time quotes.
delta The amount by which the price (premium) of an option changes for every
dollar move in the underlying instrument.
delta-hedged An options strategy protecting an option against price changes in
the option’s underlying instrument by balancing the overall position delta to zero.
delta neutral A position arranged by selecting a calculated ratio of short and
long positions that balance out to an overall position delta of zero.
delta position A measure of option or underlying securities delta.
derivative Financial instruments based on the market value of an underlying
asset.
descending triangle A sideways price pattern with two converging trend lines;
the top trend line is declining (resistance), while the bottom trend line is relatively
flat (support). This is generally considered a bearish formation, since most of the
time it will break out to the downside.
discount brokers Brokerage firms that offer lower commission rates than
full-service brokers, but do not offer services such as advice, research, and
portfolio planning.
divergence When two or more averages or indexes fail to show confirming
trends.
dividend A sum of money paid out to a shareholder from the stock’s profits.
Dow Jones Industrial Average (DJIA) Used as an overall indicator of market
performance, this average is composed of 30 blue-chip stocks that are traded daily
on the New York Stock Exchange.
downside The potential for prices to decrease.
downside breakeven The lower price at which a trade breaks even.
downside risk The potential risk one takes if prices decrease in directional
trading.
each way The commission made by a broker for the purchase and sale sides of a
trade.
earnings The net profit for a company after all expenses are deducted.
earnings per share (EPS) The net profit for a company allocated on an individ-
ual share of stock basis.
Elliott wave theory A technical tool based on R. N. Elliott’s work in the 1930s.
Elliott believed the charted price activity of a market is the graphical representa-
tion of mass psychology. In other words, the Elliott wave theory organizes the
540 GLOSSARY
ccc_fontanills_glos_533-556.qxd 12/17/04 4:45 PM Page 540
seemingly random flow of market price action into identifiable, predictable pat-
terns based on the natural progression of crowd psychology. Elliott wave theory
is based on the premise that markets will move in ratios and patterns that reflect
human nature. The classic Elliott wave pattern consists of two different types of
waves. The first consists of a five-wave sequence called an impulse wave and the
second is a three-wave sequence called a corrective wave. Usually, but not al-
ways, the market will move in a corrective wave after a five-wave move in the
other direction.
end of day The close of the trading day when market prices settle.
EPS Rank An Investor’s Business Daily list of companies ranked from 0 to 100
by the strength of each company’s earnings per share.
equilibrium A price level in a sideways market equidistant from the resistance
and support levels.
Eurodollars Dollars deposited in foreign banks, with the futures contract reflect-
ing the rates offered between U.S. banks and foreign banks.
European-style option An option contract that can be exercised only on the ex-
piration date.
exchange The location where an asset, option, future, stock, or derivative is
bought and sold.
exchange rate The price at which one country’s currency can be converted into
another country’s currency.
exercise The process of implementing an option’s right to buy or sell the under-
lying security.
exercise price A price at which the stock or commodity underlying a call or put
option can be purchased (call) or sold (put) over the specified period. (Same as
strike price.)
expiration The date and time after which an option may no longer be exercised.
expiration date The last day on which an option may be exercised.
explosive Refers to an opportunity that can yield large profits with usually a lim-
ited risk in a short amount of time.
extrinsic value The price of an option less its intrinsic value. An out-of-the-
money option’s worth consists of nothing but extrinsic or time value. (Same as
time value.)
fade Refers to selling a rising price or buying a falling price.
failed rally The inability of a market to sustain an upward move, often associ-
ated with a pattern that does not resolve itself in an expected upward direction.
The most typical evidence of a failed rally is diminishing volume.
fair market value The value of an asset under normal conditions.
Glossary 541
ccc_fontanills_glos_533-556.qxd 12/17/04 4:45 PM Page 541
fair value The theoretical value of what an option should be worth, usually gen-
erated by an option pricing model such as the Black-Scholes.
fast market A stock with so much volume that the order entry systems have dif-
ficulty processing all of the orders.
Federal Reserve System The independent central bank that influences the sup-
ply of money and credit in the United States through its control of bank reserves.
Fibonacci series A mathematical series used in the markets that is produced by
adding two sequential numbers to arrive at the next number in the series. Starting
with 1, the series is: 1, 1, 2, 3, 5, 8, 13, 21, 34, 55, 89, 144, 233, . . . This series repre-
sents common naturally occurring phenomena such as the reproduction rate of a
pair of rabbits and decay relationships, among others.
fill An executed order.
fill order An order that must be filled or canceled immediately.
fill or kill An order to buy or sell an exact number of units or none at all.
financial instruments The term used for debt instruments.
fixed delta A delta figure that does not change with the change in the underlying
asset. A futures contract has a fixed delta of plus or minus 100.
flags Relatively short-lived, sideways patterns that form after a sharp rise or de-
cline in price. They represent a pause in the current move that occurs at the ap-
proximate midpoint. As a result, these formations have measuring implications.
By definition, flags are continuation patterns. The flag resembles a rectangle that is
slightly trending up or down (similar to a parallelogram). The slope’s direction is
often the opposite of the move prior to formation. These formations typically take
one to three weeks to form, with volume diminishing into the pattern.
float The number of shares available for public trading in the markets.
floor broker An exchange member who is paid a fee for executing orders.
floor ticket A summary of the information on an order ticket.
floor trader An exchange member who executes orders from the floor of the ex-
change only for his or her own account.
front month The first expiration month in a series of months.
fundamental analysis An approach to trading research that aims to predict
futures and stock price movements based on balance sheets, income statements,
past records of earnings, sales, assets, management, products, and services.
futures contract Agreement to buy or sell a set number of shares of a commod-
ity or financial instruments in a designated future month at a price agreed on by
the buyer and seller.
gamma The degree by which the delta changes with respect to changes in the
underlying instrument’s price.
542 GLOSSARY
ccc_fontanills_glos_533-556.qxd 12/17/04 4:45 PM Page 542
gap When the daily range is completely above or below the previous day’s daily
range.
going ahead Unethical brokerage activity whereby the broker trades first for his
or her own account before filling the customer’s order(s).
go long To buy securities, options, or futures.
good till canceled order (GTC) An order to buy or sell stock that is good until
the trader cancels it.
go short To sell securities, options, or futures.
gross domestic product (GDP) The total value of goods and services produced
in a country during one year. It includes consumption, government purchases, in-
vestments, and exports minus imports.
guts A strangle where the call and the put are in-the-money.
hammering the market The intense selling of stocks by speculators who think
the market is about to drop because they believe prices are inflated.
head and shoulders (H&S) The head and shoulders pattern is probably one of
the best-known, most reliable patterns. The pattern resembles the silhouette of a
head with shrugged shoulders. Each outside peak, or shoulder, is about the same
height, with the middle peak, or head, higher than both shoulders. All three peaks
use the same support line (the neckline) and a specific volume pattern is seen
when this reversal is valid. The pattern is not complete until there is a close below
the neckline accompanied by increased volume. These reversals occur at market
tops and are bearish. Price projections are possible with valid H&S patterns.
hedge Reducing the risk of loss on an outright directional move by taking a posi-
tion through options or futures opposite to the current position held in the market.
high The highest price that was paid for a stock during a certain period.
high and low Refers to the high and low transaction prices that occur each trad-
ing day.
highflier A speculative high-priced stock that moves up and down sharply over a
short period of time.
high-tech stock Stock of companies involved in high-technology industries,
such as computers, biotechnology, robotics, electronics, and semiconductors.
historical volatility A measurement of how much a contract’s price has fluctu-
ated over a period of time in the past; usually calculated by taking a standard devi-
ation of price changes over a time period.
holder One who purchases an option.
HOLDRS Stands for Holding Company Depositary Receipts, which are ex-
change-traded funds that hold baskets of stocks from specific industry groups.
HOLDRS trade on the American Stock Exchange and can be bought or sold in lots
of 100 shares. For example, investors can buy or sell Biotechnology HOLDRS
Glossary 543
ccc_fontanills_glos_533-556.qxd 12/17/04 4:45 PM Page 543
(BBH), Semiconductor HOLDRS (SMH), or Oil Service HOLDRS (OIH). In all, the
American Stock Exchange offers trading in 17 different HOLDRS. Options are also
available on these exchange-trade funds and can be used to profit from trends re-
lated to specific sectors or industry groups.
illiquid market A market that has no volume; slippage is subsequently created
due to lack of trading volume.
immediate/cancel order An order that must be filled immediately or canceled.
income statement A financial statement that shows a company’s revenues and
expenditures over a stated period (usually one quarter or year) resulting in either
a profit or a loss.
index A group of stocks that can be traded as one portfolio, such as the S&P 500.
Broad-based indexes cover a wide range of industries and companies, and narrow-
based indexes cover stocks in one industry or economic sector.
index options Call options and put options on indexes of stocks are designed to
reflect and fluctuate with market conditions. Index options allow investors to
trade in a specific industry group or market without having to buy all the stocks in-
dividually.
inflation Increases in the general price level of goods and services; it is com-
monly reported using the consumer price index as a measure. Inflation is one of
the major risks to investors over the long term as savings may actually buy less in
the future if they do not return an amount in excess of price increases.
inside information Material information that has not been disseminated to, or is
not readily available to, the general public.
institutional investor A person or organization that trades securities in large
enough share quantities or dollar amounts that it qualifies for preferential treat-
ment and lower commissions. These entities are assumed to be more knowledge-
able investors who are better able to protect themselves from risk.
interest rate The charge for the privilege of borrowing money, usually ex-
pressed as an annual percentage rate.
interest rate–driven Refers to a point in the business cycle when interest rates
are declining and bond prices are rising.
intermarket analysis Observing the price movement of one market for the pur-
pose of evaluating a different market.
intermarket spread A spread consisting of opposing positions in instruments
with two different markets.
in-the-money (ITM) When exercising an option would generate a profit at the
time. A call option is in-the-money if the strike price is less than the market price
of the underlying security. A put option is in-the-money if the strike price is greater
than the market price of the underlying security.
544 GLOSSARY
ccc_fontanills_glos_533-556.qxd 12/17/04 4:45 PM Page 544
intrinsic value The amount by which an option is in-the-money. Out-of-the-
money options have no intrinsic value. Calls = underlying asset less strike price.
Puts = strike price less underlying asset.
inverse relationship Two or more markets that act totally opposite to one an-
other, producing negative correlations.
investment Any purchase of an asset to increase future income.
iron butterfly The combination of a long (or short) straddle and a short (or long)
strangle. All options must have the same underlying asset and the same expiration.
lagging indicator A technical indicator can lead or follow price action. A lagging
indicator will move in a bullish or bearish direction after the same bullish or bear-
ish price move. The extent to which an indicator lags is dependent upon the
“speed” of the indicator. Lagging indicators include moving averages, envelopes,
and channels. Many economic indicators are also considered lagging indicators
that follow the overall pace of the economy.
leading indicator Technical indicators can precede or lag price action. A leading
indicator will move in a bullish or bearish direction prior to the same bullish or
bearish price move. It is important to note that leading indicators can provide
false signals; therefore, price confirmation is important. Leading indicators in-
clude volume and momentum, among other oscillators.
leg One side of a spread.
Level II quotes One of three levels of the National Association of Securities
Dealers Automated Quotations System (Nasdaq). Level I quotes provide basic in-
formation such as the best bids and asks for Nasdaq-listed stocks. Level II data
provides investors with more detailed quotes and information. Level II users have
access to current bids and offers for all market makers in a given Nasdaq-listed
stock. Level III is the most advanced level and is used by market makers to enter
their own quotes to the system.
limit move The maximum daily price limit for an exchange-traded contract.
limit order An order to buy a stock at or below a specified price or to sell a stock
at or above a specified price.
limit up, limit down Commodity exchange restrictions on the maximum up-
ward or downward movements permitted in the price for a commodity during any
trading session day.
line chart Line charts “connect the dots” of the closing prices. They offer noth-
ing as to the price action in any given time period, but are useful in looking at the
overall price direction of a stock or index.
liquidity The ease with which an asset can be converted to cash in the market-
place. A large number of buyers and sellers and a high volume of trading activity
provide high liquidity.
Glossary 545
ccc_fontanills_glos_533-556.qxd 12/17/04 4:45 PM Page 545
locked market A market where trading has been halted because prices have
reached their daily trading limit.
long The term used to describe the buying of a security, contract, commodity, or
option.
long-term equity anticipation securities (LEAPS) Long-term stock or index op-
tions that are available with expiration dates up to three years in the future.
low The lowest price paid for a stock during a certain period.
low-risk investing A trade that is hedged for purposes of limiting price loss, as
opposed to a directional trade where loss is unlimited.
make a market A market maker stands ready to buy or sell a particular security
for his or her own account to keep the market liquid.
margin A deposit contributed by a customer as a percentage of the current mar-
ket value of the securities held in a margin account. This amount changes as the
price of the investment changes.
margin account A customer account in which a brokerage firm lends the cus-
tomer part of the purchase price of a trade.
margin call A call from a broker signaling the need for a trader to deposit addi-
tional money into a margin account to maintain a trade.
margin requirements of options The amount of cash the writer of an uncovered
(naked) option is required to deposit and maintain to cover his or her daily posi-
tion price changes.
marked to market At the end of each business day the open positions carried in
an account held at a brokerage firm are credited or debited funds based on the set-
tlement prices of the open positions that day.
market Used to refer to the entire stock market, a specific sector, or a specific
asset, security, or commodity that is traded at an exchange.
market-if-touched (MIT) order A price order that automatically becomes a mar-
ket order if the price is reached.
market maker An independent trader or trading firm that is prepared to buy and
sell shares or contracts in a designated market. Market makers must make a two-
sided market (bid and ask) in order to facilitate trading.
market on close An order specification that requires the broker to get the
best price available on the close of trading, usually during the last five minutes
of trading.
market on open An order that must be executed during the opening of trading.
market order Buying or selling securities at the price given at the time the order
reaches the market. A market order is to be executed immediately at the best
available price, and is the only order that guarantees execution.
546 GLOSSARY
ccc_fontanills_glos_533-556.qxd 12/17/04 4:45 PM Page 546
market price The most recent price at which a security transaction has taken
place.
market value The price at which investors buy or sell a share of common stock
or a bond at a given time. Market value is determined by the interaction between
buyers and sellers.
mark to market Refers to the daily adjustment of margin accounts to reflect
profits and losses. In this way, losses are never allowed to accumulate.
mid-cap stocks Usually solidly established medium-growth firms with less than
$100 billion in assets. They provide better growth potential than blue-chip stocks,
but do not offer as wide a variety of investment attributes.
momentum A measure of the rate (velocity) at which a security is rising or
falling. When a market continues in the same direction for a certain time frame,
the market is said to have momentum.
momentum indicator A technical indicator utilizing price and volume statistics
for predicting the strength or weakness of a current market.
momentum trading Investing with (or against) the momentum of the market in
hopes of profiting from it.
moving average Probably the best known and most versatile technical indica-
tor, this is a mathematical procedure in which the sum of a value plus a selected
number of previous values is divided by the total number of values. Used to
smooth or eliminate the fluctuations in data and to assist in determining when to
buy and sell.
moving average convergence/divergence (MACD) This popular lagging indica-
tor, also known as the “Mack-D,” represents the difference between two moving
averages with differing time periods. One is shorter (commonly 12 days) while the
other is longer (commonly 26 days). The shorter one is referred to as the fast line
while the longer one is termed the slow line. When a stock is in an uptrend, the
fast line will cross over the slow line. If a stock is trending down, the fast line will
cross under the slow line.
mutual fund An open-end investment company that pools investors’ money to
invest in a variety of stocks, bonds, or other securities.
naked option An option written (sold) without an underlying hedge position.
naked position A securities position not hedged from market risk.
narrowing the spread Refers to lessening the gap between the bid and asked
prices of a security as a result of bidding and offering.
Nasdaq National Association of Securities Dealers Automated Quotations sys-
tem is a computerized system that provides brokers and dealers with the ability to
trade approximately 3,300 securities over-the-counter. On average, Nasdaq trades
more shares than any other exchange.
Glossary 547
ccc_fontanills_glos_533-556.qxd 12/17/04 4:45 PM Page 547