Strategy strategic planning for project management phần 6 pptx
Bạn đang xem bản rút gọn của tài liệu. Xem và tải ngay bản đầy đủ của tài liệu tại đây (486.97 KB, 28 trang )
Managing Multiple Projects 125
8
7
6
5
4
3
2
1
0
Productive
Hours Per
Day
Without Project
Management
Competency
With Project
Management
Competency
Time Robbers
Time Robbers
Rework
Rework
Effective
Use of Time
Effective
Use of Time
FIGURE 9–11. Core competency analysis.
Immaturity
Maturity
Excellence
Excellence
Charter Charter
Job
Descriptions
With
Authority
Job
Descriptions
Without
Authority
Competency
Models
Generic
External
Training
Generic
In-house
Training
Customized
In-house
Training
FIGURE 9–12. Competency models and training.
MANAGING MULTIPLE PROJECTS
As organizations begin to mature in project management, there is a tendency to-
ward wanting to manage multiple projects. This might entail either the company’s
sponsoring the various projects, or each project manager’s managing multiple
projects. There are several factors supporting the managing of multiple projects.
9755.ch09 10/31/00 9:47 AM Page 125
TEAMFLY
Team-Fly
®
First, the cost of maintaining a full-time project manager on all projects may
be prohibitive. The magnitude and risks of the project dictate whether a full-time
or part-time assignment is necessary. Assigning a project manager full-time on an
activity that does not require it is an overmanagement cost. Overmanagement of
projects was considered an acceptable practice in the early days of project man-
agement because we had little knowledge on how to handle risk management.
Today, methods for risk management exist.
Second, line managers are now sharing accountability with project managers
for the successful completion of projects. Project managers are now managing at
the template levels of the work breakdown structure (WBS), with the line man-
agers accepting accountability for the work packages at the detailed WBS levels.
Project managers now spend more of their time integrating work rather than plan-
ning and scheduling functional activities. With the line manager accepting more
accountability, time may be available for the project manager to manage multiple
projects.
Third, senior management has come to the realization that they must provide
high quality training for their project managers if they are to reap the benefits of
managing multiple projects. Senior managers must also change the way that they
function as sponsors. There are six major areas where the corporation as a whole
may have to change in order for the managing of multiple projects to succeed:
●
Prioritization: If a project prioritization system is in effect, it must be
used correctly such that employee credibility in the system is realized.
There are downside risks to a prioritization system. The project manager,
having multiple projects to manage, may favor those projects having the
highest priorities. It is possible that no prioritization system at all may be
the best solution. Also, not every project needs to be prioritized.
Prioritization can be a time-consuming effort.
●
Scope changes: Managing multiple projects is almost impossible if the
sponsors/customers are allowed to make continuous scope changes.
When managing multiple projects, the project manager must understand
that the majority of the scope changes desired may have to be performed
through enhancement projects rather than through a continuous scope
change effort on the original projects. A major scope change on one pro-
ject could limit the project manager’s available time to service other pro-
jects. Also, continuous scope changes will almost always be accompanied
by reprioritization of projects, a further detriment to the management of
multiple projects.
●
Capacity planning: Organizations that support the management of multi-
ple projects generally have a tight control on resource scheduling. As a
precondition, these organizations must have knowledge of capacity plan-
ning, theory of constraints, resource leveling, and resource limited plan-
ning.
●
Project methodology: Methodologies for project management range
from rigid policies and procedures to more informal guidelines and
126 LEVEL 5: CONTINUOUS IMPROVEMENT
9755.ch09 10/31/00 9:47 AM Page 126
checklists. When managing multiple projects, the project manager must
be granted some degree of freedom. This necessitates guidelines, check-
lists, and forms. Formal project management practices create excessive
paperwork requirements, thus minimizing the opportunities to manage
multiple projects. The project size is also critical.
●
Project initiation: Managing multiple projects has been going on for al-
most 40 years. One thing that we have learned is that it can work well as
long as the projects are in relatively different life cycle phases. The de-
mands on the project manager’s time are different from each life cycle
phase. Therefore, for the project manager to effectively balance his/her
time among multiple projects, it would be best for the sponsor not to have
the projects begin at exactly the same time.
●
Organizational structures: If the project manager is to manage multiple
projects, then it is highly unlikely that the project manager will be a tech-
nical expert in all areas of all projects. Assuming that the accountability
is shared with the line managers, the organization will most likely adopt
a weak matrix structure.
END-OF-PHASE REVIEW MEETINGS
For more than 20 years, end-of-phase review meetings were simply an opportu-
nity for executives to “rubber-stamp” the project to continue on. The meetings
were used to give the executives some degree of comfort concerning project sta-
tus. Only good news was presented by the project team.
Executives, from a selfish point of view, very rarely cancelled projects. The
executive was better off allowing the new product to be developed, even though
the executive knew full well that the product would have no buyers or would be
overpriced. Once the product was developed, the executive sponsor was “off the
hook.” The onus now rested on the shoulders of the marketing group to find po-
tential customers. If customers could not be found, obviously the problem was
with marketing.
Today, end-of-phase review meetings take on a different dimension. First and
foremost, executives are no longer afraid to cancel projects, especially if the ob-
jectives have changed, the objectives are unreachable, or if the resources could be
used on other activities that have a greater likelihood of success. Executives now
spend more time assessing the risks in the future rather than focusing on accom-
plishments in the past.
Since project managers are now becoming more business-oriented, rather
than technically oriented, they are expected to present information on business
risks, reassessment of the benefit-to-cost ratio, and any business decisions that
could affect the ultimate objectives. Simply stated, the end-of-phase review meet-
ings now focus more on business decisions than on technical decisions.
End-of-Phase Review Meetings 127
9755.ch09 10/31/00 9:47 AM Page 127
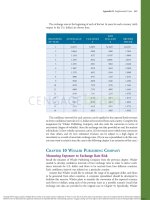
STRATEGIC SELECTION OF PROJECTS
What a company wants to do is not always what it can do. The critical constraint
is normally the availability and quality of the critical resources. Companies usu-
ally have an abundance of projects they would like to work on but, because of re-
source limitations, they have to develop a prioritization system for the selection
of projects.
One commonly used selection process is the portfolio classification matrix
shown in Figure 9–13. Each potential project undergoes a situational assessment
for strengths, weaknesses, opportunities, and threats. The project is then ranked
on the nine-square grid, based upon its potential benefits and the quality of re-
sources needed to achieve those benefits. The characteristics of the benefits ap-
pear in Figure 9–14, and the characteristics of the resources needed are shown in
Figure 9–15.
This classification technique allows for proper selection of projects, as well
as providing the organization with the foundation for a capacity planning model
to see how much work the organization can take on. Companies usually have lit-
tle trouble figuring out where to assign the highly talented people. The model,
however, provides guidance on how to make the most effective utilization of the
average and below average individuals as well.
The boxes in the nine-square grid of Figure 9–13 can then be prioritized ac-
cording to strategic importance, as shown in Figure 9–16. If resources are limited
but funding is adequate, the boxes identified as “high priority” will be addressed
first.
128 LEVEL 5: CONTINUOUS IMPROVEMENT
FIGURE 9–13. Portfolio classification matrix.
High
Strong Medium
Medium
Resource Quality
Projects’ Benefits
Low
Low
Strategic
Issues
Situation
Assessment
Strengths &
Weaknesses
Opportunities &
Threats
9755.ch09 10/31/00 9:47 AM Page 128
The nine-square grid in Figure 9–16 can also be used to identify the quality
of the project management skills needed, in addition to the quality of functional
employees. This is shown in Figure 9–17. As an example, the project managers
with the best overall skills will be assigned to those projects that are needed to
protect the firm’s current position. Each of the nine cells in Figure 9–17 can be
described as follows:
●
Protect position (high benefits and high quality of resources): These pro-
jects may be regarded as the survival of the firm. These projects mandate
professional project management, possibly certified project managers,
and the organization considers project management as a career path posi-
Strategic Selection of Projects 129
Projects
,
Benefits
Profitability
Customer Satisfaction/Goodwill
Penetrate New Markets/Future
Business
Develop New Technology
Technology Transfer
Reputation
Stabilize Work Force
Utilize Unused Capacity
•
•
•
•
•
•
•
•
FIGURE 9–14. Potential benefits of a project.
Quality of Resources
Knowledge of Business
Manpower
Facilities, Equipment, Machinery
Proprietary Knowledge
Special Expertise
Reputation
Relationship with Key Stakeholders
Project Management Skills
Money
•
•
•
•
•
•
•
•
•
FIGURE 9–15. Characteristics of the resources needed to achieve a project’s benefits.
9755.ch09 10/31/00 9:47 AM Page 129
tion. Continuous improvement in project management is essential to
make sure that the methodology is the best it can be.
●
Protect position (high benefits and medium quality of resources):
Projects in this category may require a full-time project manager, but not
necessarily a certified one. An enhanced project management methodol-
130 LEVEL 5: CONTINUOUS IMPROVEMENT
Strong Medium Low
HighMediumLow
Quality of Resources Needed
Projects’ Benefits
High
Project’s
Priority:
Medium
Low
FIGURE 9–16. Strategic importance of projects.
FIGURE 9–17. Strategic guide to allocating project resources.
Projects’ Benefits
Quality of Resources Needed
Low
High
Protect
Position
Protect
Position
Team
Leaders
Protect
Position
Build
Selectively
Part-Time
Project
Management
Part-Time
Project
Management
Part-Time
Project
Management
Line
Management
Project
Management
Medium Low
Medium High
9755.ch09 10/31/00 9:47 AM Page 130
ogy is needed with emphasis on reinforcing vulnerable areas of project
management.
●
Protect position (medium benefits and high quality of resources):
Emphasis in these projects is on training project managers, with special
attention to their leadership skills. The types of projects here are usually
efforts to add customer value rather than to develop new products.
●
Line management project management (high benefits and low quality of
resources): These projects are usually process improvement efforts to
support repetitive production. Minimum integration across functional
lines is necessary, which allows line managers to function as project man-
agers. These projects are characterized by short time frames.
●
Build selectively (medium benefits and medium quality of resources):
These projects are specialized, perhaps repetitive, and focus on a specific
area of the business. Limited project management strengths are needed.
Risk management may be needed, especially technical risk management.
●
Team leaders (low benefits but high quality of resources): These are nor-
mally small, short-term R&D projects that require strong technical skills.
Since minimal integration is required, scientists and technical experts
will function as team leaders. Minimal knowledge of project manage-
ment is needed.
●
Part-time project management (medium benefits and low quality of re-
sources): These are small capital projects that require only an introduc-
tory knowledge of project management. One project manager could end
up managing multiple small projects.
●
Part-time project management (low benefits and medium quality of re-
sources): These are internal projects or very small capital projects. These
projects have small budgets and perhaps a low to moderate risk.
●
Part-time project management (low benefits and low quality of re-
sources): These projects are usually planned by line managers but exe-
cuted by project coordinators or project expediters.
PORTFOLIO SELECTION OF PROJECTS
Companies that are project-driven organizations must be careful about the type
and quantity of projects they work on because of the constraints on available re-
sources. Because timing is often critical, it is not always possible to hire new em-
ployees and have them trained quickly enough, or to hire subcontractors, whose
skills may well be questionable anyway.
Figure 9–18 shows a typical project portfolio.* Each circle represents a pro-
Portfolio Selection of Projects 131
*This type of portfolio was adapted from the life cycle portfolio model used for strategic planning ac-
tivities.
9755.ch09 10/31/00 9:47 AM Page 131
ject. The location of each circle represents the quality of resources needed and the
life cycle phase that the project is in. The size of the circle represents the magni-
tude of the achievable benefits, relative to those of other projects, and the “pie
wedge” represents the percentage of the project completed thus far.
In Figure 9–18, Project A has relatively low benefits and uses medium qual-
ity of resources. Project A is in the definition phase. However, when Project A
moves into the design phase, the quality of resources may change to low or high
quality. Therefore, this type of chart has to be updated frequently.
Figures 9–19, 9–20, and 9–21 show three different types of portfolios. Figure
9–19 represents a high-risk project portfolio where high-quality resources are re-
quired on each project. This may be representative of a project-driven organiza-
tion that has been awarded several highly profitable, large projects. This could
also be a company that competes in the computer field, an industry that has short
product life cycles and where product obsolescence occurs only six months
downstream.
Figure 9–20 represents a conservative, profit-oriented project portfolio, say
that of an organization that works mainly on low risk projects that require low-
quality resources. This could be representation of project portfolio selection in a
service organization, or even a manufacturing firm that has projects designed
mostly for product enhancement.
132 LEVEL 5: CONTINUOUS IMPROVEMENT
A
BC
D
E
F
G
Quality of Resources
Life
Cycle
Phases
Strong
Definition
Design
Development
Implementation
Conversion
Medium Low
FIGURE 9–18. Basic portfolio.
9755.ch09 10/31/00 9:47 AM Page 132
Quality of Resources
Life
Cycle
Phases
Strong
Definition
Design
Development
Implementation
Conversion
Medium Low
FIGURE 9–19. Typical high-risk project portfolio.
Quality of Resources
Life
Cycle
Phases
Strong
Definition
Design
Development
Implementation
Conversion
Medium Low
FIGURE 9–20. Typical conservative, profit-oriented project portfolio.
133
9755.ch09 10/31/00 9:47 AM Page 133
134 LEVEL 5: CONTINUOUS IMPROVEMENT
Quality of Resources
Life
Cycle
Phases
Strong
Definition
Design
Development
Implementation
Conversion
Medium Low
FIGURE 9–21. Typical balanced project portfolio.
Figure 9–21 shows a balanced portfolio with projects in each life cycle phase
and where all quality of resources is being utilized, usually quite effectively. A
very delicate juggling act is required to maintain this balance.
HORIZONTAL ACCOUNTING
In the early days of project management, project management was synonymous
with scheduling. Project planning meant simply laying out a schedule with very
little regard for costs. After all, we know that costs will change (i.e., most likely
increase) over the life of the project and that the final cost will never resemble the
original budget. Therefore, why worry about cost control?
Recessions and poor economic times have put pressure on the average com-
pany to achieve better cost control. Historically, costs were measured on a verti-
cal basis only. This created a problem in that project managers had no knowledge
of how many hours were actually being expended in the functional areas to per-
form the assigned project activities. Standards were very rarely updated and, if
they were, it was usually without the project manager’s knowledge.
9755.ch09 10/31/00 9:47 AM Page 134
Today, methodologies for project management mandate horizontal account-
ing using earned value measurement techniques. This is extremely important, es-
pecially if the project manager has the responsibility for profit and loss. Projects
are now controlled through a series of charge numbers or cost account codes as-
signed to all of the work packages in the WBS.
Strategic planning for cost control on projects is a three-phase effort, as
shown in Figures 9–22 through 9–24. The three phases are:
●
Phase I—Budget-based planning (Figure 9–22): This is the development
of a project’s baseline budget and cash flow based upon reasonably ac-
curate historical data. The historical databases are updated at the end of
each project.
●
Phase II—Cost/performance determination (Figure 9–23): This is where
the costs are determined for each work package and where the actual
costs are compared against the actual performance in order to determine
the true project status.
●
Phase III—Updating and reporting (Figure 9–24): This is the preparation
of the necessary reports for the project team members, line managers,
sponsors, and customer. At a minimum, these reports should address the
questions of:
●
Where are we today (time and cost)?
●
Where will we end up (time and cost)?
●
What problems do we have now and will we have in the future, and
what mitigation strategies have we come up with?
Good methodologies provide the framework for gathering the information to
answer these questions.
Horizontal Accounting 135
Financial
History
Forward
Pricing Rates
Financial
Plan
Historical
Data/Project
Files
Estimating
Data Bases
Team
Members’
Knowledge
Subject Matter
Experts
Labor Rates
Overhead
Rates
Material
Expenditures
Cost of Capital
Baseline
Budget
Cash Flow
Plan
•
•
•
•
•
•
•
•
•
•
FIGURE 9–22. The evolution of integrated cost-schedule management. Phase I—Budget-
based planning.
9755.ch09 10/31/00 9:47 AM Page 135
TEAMFLY
Team-Fly
®
ORGANIZATIONAL RESTRUCTURING
Effective project management cultures are based on trust, communication, coop-
eration, and teamwork. When the basis of project management is strong, organi-
zational structure becomes almost irrelevant. Restructuring an organization only
to add project management is unnecessary and perhaps even dangerous.
Companies may need to be restructured for other reasons, such as making the cus-
tomer more important. But successful project management can live within any
structure, no matter how awful the structure looks on paper, just as long as the
culture of the company promotes teamwork, cooperation, trust, and effective
communication.
136 LEVEL 5: CONTINUOUS IMPROVEMENT
Analysis of The
Financial Data
Variance
Analysis
Comparison of
Actual Versus
Planned
Trend
Extrapolation
Cash Flow
Versus
Commitments
•
•
•
•
•
Cost Variance
Schedule
Variance
Estimated
Cost at
Completion
Update
Corporate
Portfolio
FIGURE 9–24. The evolution of integrated cost-schedule management. Phase III—
Updating and reporting.
Cost/
Performance
Actual Costs
Actual Performance
Timecards
Overhead
Rates
Materials
Subcontracts
Percent
Complete
•
•
•
•
•
FIGURE 9–23. The evolution of integrated cost-schedule management. Phase II—
Cost/performance determination.
9755.ch09 10/31/00 9:47 AM Page 136
The organizations of companies excellent in project management can take al-
most any form. Today, small- to medium-size companies sometimes restructure
to pool management resources. Large companies tend to focus on the strategic
business unit as the foundation of their structures. Many companies still follow
matrix management. Any structure can work with project management as long as
it has the following traits:
●
The company is organized around nondedicated project teams.
●
It has a flat organizational hierarchy.
●
It practices informal project management.
●
It does not consider the reporting level of project managers to be impor-
tant.
The first point listed above may be somewhat controversial. Dedicated pro-
ject teams have been a fact of life since the late 1980s. Although there have been
many positive results from dedicated teams, there has also been a tremendous
waste of manpower coupled with duplication of equipment, facilities, and tech-
nologies. Today, most experienced organizations believe that they are scheduling
resources effectively so that multiple projects can make use of scarce resources at
the same time. And, they believe, nondedicated project teams can be just as cre-
ative as dedicated teams, and perhaps at a lower cost.
Although tall organizational structures with multiple layers of management
were the rule when project management came on the scene in the early 1960s, to-
day’s organizations tend to be lean and mean, with fewer layers of management
than ever. The span of control has been widened, and the results of that change
have been mass confusion in some companies but complete success in others. The
simple fact is that flat organizations work better. They are characterized by better
internal communication, greater cooperation among employees and managers,
and atmospheres of trust.
In addition, today’s project management organizations, with only a few ex-
ceptions (purely project-driven companies), prefer to use informal project man-
agement. With formal project management systems, the authority and power of
project managers must be documented in writing. Formal project management
policies and procedures are required. And documentation is required on the sim-
plest tasks. By contrast, in informal systems, paperwork is minimized. In the fu-
ture, I believe that even totally project-driven organizations will develop more in-
formal systems.
The reporting level for project managers has fluctuated between top-level
and lower-level managers. As a result, some line managers have felt alienated
over authority and power disagreements with project managers. In the most suc-
cessful organizations, the reporting level has stabilized, and project managers
and line managers today report at about the same level. Project management
simply works better when the managers involved view each other as peers. In
large projects, however, project managers may report higher up, sometimes to
the executive level. For such projects, a project office is usually set up for proj-
Organizational Restructuring 137
9755.ch09 10/31/00 9:47 AM Page 137
ect team members at the same level as the line managers with whom they inter-
act daily.
To sum it all up, effective cross-functional communication, cooperation, and
trust are bound to generate organizational stability. Let’s hope that organizational
restructuring on the scale we’ve seen in recent years will no longer be necessary.
CAREER PLANNING
In organizations that successfully manage their projects, project managers are
considered professionals and have distinct job descriptions. Employees tradition-
ally are allowed to climb one of two career ladders: the management ladder or the
technical ladder. (They cannot, however, jump back and forth between the two.)
This presents a problem to project managers, whose responsibilities bridge the
two ladders. To solve this problem, some organizations have created a third lad-
der, one that fills the gap between technology and management. It is a project
management ladder, with the same opportunities for advancement as the other
two.
ASSESSMENT INSTRUMENT FOR
LEVEL 5
The following 16 questions concern how mature you believe your organization to
be with regard to Level 5. Beside each question you will circle the number that
corresponds to your opinion. In the example below, your choice would have been
“Slightly Agree.”
Ϫ3 Strongly Disagree
Ϫ2 Disagree
Ϫ1 Slightly Disagree
ϩ0 No Opinion
ϩ1 Slightly Agree
ϩ2Agree
ϩ3 Strongly Agree
Example:(Ϫ3, Ϫ2, Ϫ1, 0, ϩ1, ϩ2, ϩ3)
The row of numbers from Ϫ3 to ϩ3 will be used later for evaluating the results.
After answering Question 16, you will grade the exercise by completing Exhibit
5.
138 LEVEL 5: CONTINUOUS IMPROVEMENT
᭺
᭺
9755.ch09 10/31/00 9:47 AM Page 138
QUESTIONS
Answer the following questions based upon continuous improvement changes
over the past 12 months only. Circle the answer you feel is correct.
1. The improvements to our methodology
have pushed us closer to our customers. (Ϫ3 Ϫ2 Ϫ10ϩ1 ϩ2 ϩ3)
2. We have made software enhancements to
our methodology. (Ϫ3 Ϫ2 Ϫ10ϩ1 ϩ2 ϩ3)
3. We have made improvements that allowed
us to speed up the integration of
activities. (Ϫ3 Ϫ2 Ϫ10ϩ1 ϩ2 ϩ3)
4. We have purchased software that allowed
us to eliminate some of our reports and
documentation. (Ϫ3 Ϫ2 Ϫ10ϩ1 ϩ2 ϩ3)
5. Changes in our training requirements
have resulted in changes to our
methodology. (Ϫ3 Ϫ2 Ϫ10ϩ1 ϩ2 ϩ3)
6. Changes in our working conditions (i.e.,
facilities, environment) have allowed us
to streamline our methodology (i.e.,
paperwork reduction). (Ϫ3 Ϫ2 Ϫ10ϩ1 ϩ2 ϩ3)
7. We have made changes to the
methodology in order to get corporate-
wide acceptance. (Ϫ3 Ϫ2 Ϫ10ϩ1 ϩ2 ϩ3)
8. Changes in organizational behavior have
resulted in changes to the methodology. (Ϫ3 Ϫ2 Ϫ10ϩ1 ϩ2 ϩ3)
9. Management support has improved to
the point where we now need fewer gates
and checkpoints in our methodology. (Ϫ3 Ϫ2 Ϫ10ϩ1 ϩ2 ϩ3)
10. Our culture is a cooperative culture to
the point where informal rather than
formal project management can be used,
and changes have been made to the
informal project management system. (Ϫ3 Ϫ2 Ϫ10ϩ1 ϩ2 ϩ3)
11. Changes in power and authority have
resulted in looser methodology (i.e.,
guidelines rather than policies and
procedures). (Ϫ3 Ϫ2 Ϫ10ϩ1 ϩ2 ϩ3)
12. Overtime requirements mandated change
in our forms and procedures. (Ϫ3 Ϫ2 Ϫ10ϩ1 ϩ2 ϩ3)
13. We have changed the way we
communicate with our customers. (Ϫ3 Ϫ2 Ϫ10ϩ1 ϩ2 ϩ3)
Questions 139
9755.ch09 10/31/00 9:47 AM Page 139
14. Because our projects’ needs have
changed, so have the capabilities of our
resources. (Ϫ3 Ϫ2 Ϫ10ϩ1 ϩ2 ϩ3)
15. (If your organization has restructured)
Our restructuring caused changes in
signoff requirements in the
methodology. (Ϫ3 Ϫ2 Ϫ10ϩ1 ϩ2 ϩ3)
16. Growth of the company’s business base
has caused enhancements to our
methodology. (Ϫ3 Ϫ2 Ϫ10ϩ1 ϩ2 ϩ3)
Exhibit 5
Each response you circled in Questions 1–16 had a column value between Ϫ3
and ϩ3. In the appropriate spaces below, place the circled value (between Ϫ3
and ϩ3) beside each question.
1.
2.
3.
4.
5.
6.
7.
8.
9.
10.
11.
12.
13.
14.
15.
16.
Total:
The grading system for this exercise follows.
EXPLANATION OF POINTS FOR LEVEL 5
Scores 20 or more are indicative of an organization committed to benchmarking
and continuous improvement. These companies are probably leaders in their
140 LEVEL 5: CONTINUOUS IMPROVEMENT
9755.ch09 10/31/00 9:47 AM Page 140
field. These companies will always possess more project management knowledge
than both their customers and their competitors.
Scores between 10–19 are indicative that some forms of continuous im-
provement are taking place, but the changes may be occurring slowly. There may
be resistance to some of the changes, most likely because of shifts in the power
and authority spectrum.
Scores less than 9 imply a strong resistance to change or simply a lack of se-
nior management support for continuous improvement. This most likely occurs in
low technology, non–project-driven organizations where projects do not neces-
sarily have a well-defined profit-loss statement. These organizations will eventu-
ally change only after pressure by their customers or an erosion of their business
base.
Explanation of Points for Level 5 141
9755.ch09 10/31/00 9:47 AM Page 141
This Page Intentionally Left Blank
10
Sustainable Competitive
Advantage
143
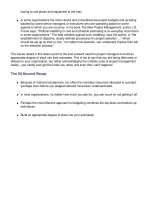
INTRODUCTION
To spend time and money developing a project management methodology be-
cause you believe it is the right thing to do is a wasted effort. The better approach
is to develop a methodology with the intent of converting it into a sustainable
competitive advantage. A sustainable competitive advantage not only placates
your customers, it also puts pressure on your competitors to spend money to com-
pete with you.
Sustainable competitive advantages can be determined for individual func-
tional areas rather than for the entire company. As an example, consider Figure
10–1, which illustrates the efforts needed to achieve a sustained competitive ad-
vantage in research and development (R&D). As a company advances through the
various stages of innovation, the technical risks will increase. The organization
must have developed a good approach to the problem of assessing technical risks
and must be willing to admit when a project should be cancelled because the re-
sources could be allocated more effectively on other projects. Maintaining a com-
petitive advantage requires a continuous stream of new and/or enhanced products
or services. Risk management is an essential ingredient in the evaluation process.
As technical risks increase, so does the amount of money expended, as well
as the requirement for superior technical ability. The technical skills required in-
crease as we go from basic to applied research and on through development.
Although some people may argue about the need for this increase in skill levels,
the fact remains that a product that can be developed on a small laboratory bench
may never be able to be mass-produced or, even if it can be mass-produced, the
9755.ch10 10/31/00 9:46 AM Page 143
quality may have to be degraded. Also, it is in development where one finally ob-
tains the hard numbers as to whether the product can be manufactured at a com-
petitive price.
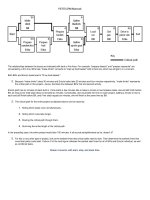
STRATEGIC THRUSTS
As shown in Figure 10–2, there are four “strategic thrusts” that must be consid-
ered before your project management methodology can be turned into a sustained
competitive advantage. These strategic thrusts must be identified while the
methodology is being designed and developed, not later on. Developing a
methodology and then having to make major changes to it because the strategic
thrusts were not considered can waste time and money, as well as lowering
morale. Poor morale can cause the workers to lose faith in the methodology.
144 SUSTAINABLE COMPETITIVE ADVANTAGE
FIGURE 10–1. R&D Efforts for a sustained competitive advantage. Source: Reprinted
from P. Rea and H. Kerzner, Strategic Planning. New York: Wiley, 1997, p. 105.
9755.ch10 10/31/00 9:46 AM Page 144
The first strategic thrust is the core values/purpose. The core values/purpose
thrust describes the heart of the company, as well as the basic reason for its exis-
tence.
●
Core values: There are usually three to five core values for a company,
the timeless, passionately held guiding principles of the organization. At
Procter & Gamble, for example, the core values are delivering consumer
value, developing breakthrough innovation, and building strong brands.
The core values for the Walt Disney Company might be imagination and
wholesomeness, while at Nordstrom they could be service to the cus-
tomer, trust, and products with style. Core values come from within the
organization; they represent what the organization is at its very essence,
as opposed to what it does from day to day.
●
The core purpose: An organization’s core purpose should last for at least
100 years; it is the organization’s reason for being that goes beyond cur-
rent products and services. For 3M, the core purpose is “to solve unsolved
problems innovatively.” For Hewlett-Packard, it is “to make technical
contributions for the advancement and welfare of humanity.” For
McKinsey & Company, it is “to help leading corporations and govern-
Strategic Thrusts 145
Sustainable
Competitive
Advantage
Strategic
Focus
Core
Values/
Purpose
Competitive
Focus
Synergy
FIGURE 10–2. Strategic thrusts.
9755.ch10 10/31/00 1:47 PM Page 145
TEAMFLY
Team-Fly
®
ments to be more successful.” For Merck it is “to preserve and improve
human life.” And for the Walt Disney Company it is “to make people
happy.” One approach to finding a core purpose is to ask five whys. Start
with a description of the business and ask, “Why is that important?” five
times; after a few whys you get to the very essence of the business.*
Generally speaking, all projects undertaken using the project management
methodology must support the company’s core values/purpose, which could very
well be regarded as the most important strategic thrust.
The second strategic thrust in Figure 10–2 is the strategic focus. The strate-
gic focus identifies the product/market element in which the organization com-
petes. There are three primary questions that must be addressed in the strategic
focus:
●
Where will the organization compete? (What products are offered, which
markets are served, by segment or geographically?)
●
Against whom will the organization compete? (Who is the competition?)
●
How will the organization compete? (By product, by proper positioning,
by functional strategy as channels of distribution, etc.?)
The answers to these three questions provide guidance on the quality and
competencies of the resources and assets needed. Project management method-
ologies must be designed around the competencies of the resources.
The third strategic thrust is the competitive focus. Although this thrust has
some similarities to the strategic focus thrust, there are other overriding factors.
The competitive focus emphasizes the differences between your organization and
your major competitors. The differences can exist in such areas as:
●
Product features
●
Product design
●
Product performance
●
Product quality
●
Products offered
●
Value-added opportunities
●
Brand name and image
●
Cost reduction opportunities (i.e., experience curves, labor rates)
●
Strategic alliances and partnerships
These strategic competitive differences can give your methodology one step
up on the competition.
146 SUSTAINABLE COMPETITIVE ADVANTAGE
*D. A. Aaker, Strategic Market Management, 5th ed. New York: Wiley, 1998; p. 28.
9755.ch10 10/31/00 1:47 PM Page 146
The final strategic thrust in Figure 10–2 is synergy. Synergy reflects the or-
ganization’s ability to perform more work in less time and with fewer resources.
Organizational synergy is a measure of how well the employees cooperate with
one another. Does the organization have a cooperative or noncooperative culture?
Cooperative cultures allow for the design of a flexible methodology that will take
advantage of continuous improvement opportunities.
Because market conditions and the environment can change, continuous im-
provement is necessary to maintain the sustained competitive advantage. Change
generates risk that, if not properly analyzed and mitigated, can cause a firm to
lose its competitive advantage. The key here is for the competitive advantage to
become a sustainable competitive advantage. Typical risks associated with main-
taining a sustainable advantage are shown in Figure 10–3.
THE NEED FOR CONTINUOUS
IMPROVEMENT
Sustained competitive advantages require continuous improvement for a firm to
maintain its strength in the marketplace. Although new products/services are one
way, strengthening one’s internal position can also effective if it results in the in-
The Need for Continuous Improvement 147
Firm’s
Limitations
Quality of
Assets
Availability
of Resources
New
Constraints
•
•
•
Competitive
Risks
Too many
Competitors
New Entrants
New Strategic
Alliances
•
•
•
Market
Changes
Price/Cost
Instability
New
Legislation
• New
Technologies
•
•
Risks to Maintaining
a Sustained Competitive
Advantage
FIGURE 10–3. Risks associated with maintaining a sustainable competitive advantage.
9755.ch10 10/31/00 1:47 PM Page 147
troduction of new and/or more sophisticated tools that allow a firm to make faster
and better decisions. Tools for the future can be classified as follows:
Resource Analysis Tools
●
Resource limited planning
●
Resource leveling
●
Capacity planning
●
Multiproject resource analysis
Cost Analysis Tools
●
Earned value forecasting
●
Variance analysis
●
Trend analysis
●
Crashing costs
Risk Analysis Tools
●
Risk analysis
●
Risk quantification
●
Lessons learned databases
Forecasting Analysis Tools
●
Technology forecasting
●
Forward pricing rates
●
Escalation factors
●
Market analysis
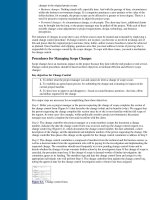
PROJECT MANAGEMENT
COMPETITIVENESS
Figure 10–4 shows the process of developing project management competitive-
ness. These steps are somewhat similar to the steps in the project management
maturity model (PMMM). In the first step in Figure 10–4, the organization un-
dergoes project management training, which leads to the development of project
management skills. But even with a reasonable skill base, the organization can
still be reasonably immature. The project management skill base must be re-
garded as a company-wide project management competency designed to benefit
the entire company.
This is more than simply obtaining the knowledge. It also includes develop-
ing a corporate culture that is based upon effective organizational behavior and
creating a well-developed project management methodology, accompanied by the
proper supporting tools. The tools can be characterized into three areas, as shown
in Figure 10–4.
148 SUSTAINABLE COMPETITIVE ADVANTAGE
9755.ch10 10/31/00 9:46 AM Page 148
Once the organization recognizes that project management is a core compe-
tency, the organization can convert this competency into a sustainable competi-
tive advantage, as shown in Figure 10–4. The ultimate purpose is for the sustain-
able competitive advantage to become the pathway for a strategic competency
that becomes a primary effort during strategic planning activities. This requires
strong executive support and a firm belief that project management does, in fact,
impact the bottom line of the corporation.
Project Management Competitiveness 149
Strategic
Competency
Is the
Pathway to
Sustained
Competitive
Advantage
Are the
Foundation for
Project
Management
Competencies
Are the
Source of
Project
Management
Skills
Leads to
Immaturity
Maturity
Excellence
Project
Management
Training
FIGURE 10–4. Project management competitiveness.
9755.ch10 10/31/00 9:46 AM Page 149


![Wiley strategic planning for project management found @ [redsamara com]](https://media.store123doc.com/images/document/14/ri/gk/medium_gki1396437553.jpg)