Strategy strategic planning for project management phần 7 pdf
Bạn đang xem bản rút gọn của tài liệu. Xem và tải ngay bản đầy đủ của tài liệu tại đây (480.85 KB, 28 trang )
are seen through the eyes of the customer. The secondary definitions of success
are usually internal benefits. If achieving 86 percent of the specification is ac-
ceptable to the customer and follow-on work is received, then the original project
might very well be considered as a success.
It is possible for a project management methodology to identify primary and
secondary success factors. This could provide guidance to a project manager for
the development of a risk management plan, as well as help the project manager
decide which risks are worth taking and which are not acceptable.
THE MANY FACES OF FAILURE*
Previously we stated that success might be a cube rather than a point. If we stay
within the cube but miss the point, is that a failure? Probably not! The true defi-
nition of failure is when the final results are not what were expected, even though
the original expectations may or may not have been reasonable. Sometimes cus-
tomers, and even internal executives, set performance targets that are totally un-
realistic, they may hope to achieve 80 to 90 percent at best. For simplicity’s sake,
let us define failure as unmet expectations.
When unmeetable expectations are formed, failure is virtually assured, since
we have defined failure as unmet expectations. This is called a planning failure
and is the difference between what was planned to be accomplished and what
was, in fact, achievable. The second component of failure is poor performance or
The Many Faces of Failure 153
TABLE 11–1. SUCCESS FACTORS
Primary Secondary
• Within time • Follow-on work from this customer
• Within cost • Using the customer’s name as a
• Within quality limits reference on your literature
• Accepted by the customer • With minimum or mutually agreed upon
scope changes
• Without disturbing the main flow of work
• Without changing the corporate culture
• Without violating safety requirements
• Providing efficiency and effectiveness
of operations
• Satisfying OSHA/EPA requirements
• Maintaining ethnical conduct
• Providing a strategic alignment
• Maintaining a corporate reputation
• Maintaining regulatory agency relations
* Adapted from Robert D. Gilbreath, Winning At Project Management. New York: John Wiley, 1986,
pp. 2–6.
9755.ch11 10/31/00 9:52 AM Page 153
actual failure. This is the difference between what was achievable and what was
actually accomplished.
Perceived failure is the net sum of actual failure and planning failure. Figures
11–2 and 11–3 illustrate the components of perceived failure. In Figure 11-2, project
management has planned a level of accomplishment (C) lower than what is achiev-
able given project circumstances and resources (D). This is a classic underplanning
situation. Actual accomplishment (B), however, was even less than planned.
A slightly different case is illustrated in Figure 11–3. Here, management has
planned to accomplish more than can be achieved. Planning failure is again as-
sured even if no actual failure occurs. In both of these situations (overplanning
and underplanning), the actual failure is the same, but the perceived failure can
vary considerably.
Today, most project management practitioners focus on planning failure. If this
aspect of the project can be compressed, or even eliminated, then the magnitude
of the actual failure, should it occur, would be diminished. A good project man-
agement methodology helps to reduce planning failure. Today, we believe that
planning failure, when it occurs, is due in large part to the project manager’s in-
ability to perform effective risk management. In the 1980s, we believed that the
failure of a project was largely a quantitative failure due to:
●
Ineffective planning
●
Ineffective scheduling
●
Ineffective estimating
●
Ineffective cost control
●
Project objectives being a “moving target”
During the 1990s, we changed our view of failure from being quantitatively
oriented to qualitatively oriented. A failure in the 1990s was largely attributed to:
154 SPECIAL PROBLEMS WITH STRATEGIC PLANNING
None
A
Perceived
Failure
Actual Planned PerfectionAchievable
B
C
D
Actual Failure
Planning
Failure
E
Accomplishment
FIGURE 11–2. Components of failure.
9755.ch11 10/31/00 9:52 AM Page 154
●
Poor morale
●
Poor motivation
●
Poor human relations
●
Poor productivity
●
No employee commitment
●
No functional commitment
●
Delays in problem solving
●
Too many unresolved policy issues
●
Conflicting priorities between executives, line managers, and project
managers
Although these quantitative and qualitative approaches still hold true to some
degree, today we believe that the major component of planning failure is inap-
propriate or inadequate risk management, or having a project management
methodology that does not provide any guidance for risk management.
Sometimes, the risk management component of failure is not readily identi-
fied. For example, look at Figure 11–4. The actual performance delivered by the
contractor was significantly less than the customer’s expectations. Is the differ-
ence between these two arrows poor technical ability or a combination of techni-
cal inability and poor risk management? Today we believe that it is a combina-
tion.
When a project reaches completion, the company performs a lessons learned
review (or at least a well-managed company does). Sometimes lessons learned are
inappropriately labeled and thus the true reason for the risk event remains un-
known. Figure 11–5 illustrates the relationship between the marketing personnel
and technical personnel when undertaking a project to develop a new product. If
the project is completed with actual performance being less than customer ex-
pectations, is it because of poor risk management by the technical assessment and
The Many Faces of Failure 155
None
A
Perceived Failure
Actual Planned PerfectionAchievable
B
D
Actual
Failure
Planning
Failure
Accomplishment
C
FIGURE 11–3. Components of failure.
9755.ch11 10/31/00 9:52 AM Page 155
TEAMFLY
Team-Fly
®
forecasting personnel or poor marketing risk assessment? The interrelationship
between marketing and technical risk management is not always clear.
Another point illustrated in Figure 11–5 is that opportunities for tradeoffs di-
minish as we get further downstream on the project. There are numerous oppor-
tunities for tradeoffs prior to establishing the final objectives for the project, but
more limited chances during project execution. Thus if the project fails, it may
very well be because of the timing when the risks were analyzed.
156 SPECIAL PROBLEMS WITH STRATEGIC PLANNING
Poor Risk
Management
Technical
Inability
Customer Expectations
Actual Performance
Performance
Time
Opportunities for Tradeoffs
Resulting from Risk Analyses
Project
Objectives
Project
Planning
Schedule Risk
Assessment
Financial Risk
Assessment
Technical Risk
Assessment
and Forecasting
Market Risk
Assessment
and Forecasting
Project
Execution
Numerous
Limited
Technical
Strategy
Product/Market
Strategy
FIGURE 11–4. Risk planning.
FIGURE 11–5. Mitigation strategies available.
9755.ch11 10/31/00 9:52 AM Page 156
Care must be taken that the proper identification of failure is made and that the
company knows to which functional areas the lessons learned should be applied.
TRAINING AND EDUCATION
Given the fact that most companies use the same basic tools as part of their
methodology, what then makes one company better than another? The answer lies
in the execution of the methodology. Training and education can accelerate not
only the project management maturity process but also the ability to execute the
methodology.
Actual learning takes place in three areas, as shown in Figure 11–6: on-the-
job experience, education, and knowledge transfer. Ideal project management
knowledge would be obtained by allowing each employee to be educated on the
results of the company’s lessons learned studies including risk management,
benchmarking, and continuous improvement efforts. Unfortunately, this is rarely
done and ideal learning is hardly ever reached. To make matters worse, actual
learning is less than most people believe because of lost knowledge. This lost
knowledge is shown in Figure 11–7 and will occur even in companies that main-
tain low employee turnover ratios.
Training and Education 157
Time
On-the-Job
Experience
Education
Knowledge
Transfer
Actual
Learning
Ideal
Learning
Benchmarking/
Continuous
Improvement
Project Management Knowledge
FIGURE 11–6. Project management learning curve.
9755.ch11 10/31/00 9:52 AM Page 157
CHANGE MANAGEMENT
It has often been said that the most difficult projects to manage are those that in-
volve the management of change. Figure 11–8 shows the four basic inputs needed
to develop a project management methodology. Each of these four inputs has a
“human” side that may require that people change.
Successful development and implementation of a project management
methodology requires:
●
Identification of the most common reasons for change in project man-
agement and why these reasons occur.
●
Identification of the ways to overcome the resistance to change.
●
Application of the principles of change management to ensure that the
desired project management environment will be created and sustained.
For simplicity’s sake, resistance can be classified as departmental resistance
and personal resistance to change. Organizational resistance occurs when a func-
tional unit as a whole feels threatened by project management. This is shown in
Figure 11–9. Examples include:
●
Sales: The sales staff’s greatest resistance to change arises from fear that
project management will now take credit for corporate profits, thus re-
ducing the year-end bonuses for the salesforce. Sales personnel fear that
158 SPECIAL PROBLEMS WITH STRATEGIC PLANNING
Project Management Knowledge
Time
Resignation
Complacency
Termination
Lost
Knowledge
Ideal
Learning
Actual
Learning
FIGURE 11–7. Project management learning curve.
9755.ch11 10/31/00 9:52 AM Page 158
Change Management 159
Project
Management
Methodology
Organization
Work
(Tasks)
Tools
People
Low
Neutral
High
H.R.
I.T.
Sales
Marketing
Procurement
Manufacturing R&D
Finance
Engineering
FIGURE 11–8. Methodology imputs.
FIGURE 11–9. Resistance to change.
9755.ch11 10/31/00 9:52 AM Page 159
project managers may become involved in the sales effort, thus diminish-
ing the power of the salesforce.
●
Marketing: Marketing people fear that project managers will end up
working so closely with the customers that they may eventually be given
some of the marketing and sales functions. This fear is not without merit
because customers often want to communicate with the personnel man-
aging the project rather than with marketing staff, who may well disap-
pear after the closure of the sale.
●
Finance (and accounting): These departments fear that project manage-
ment will require the development of a project accounting system (such
as earned value measurement), which, in turn, will increase the workload
in accounting and finance. Accounting personnel are not happy with hav-
ing to learn earned value measurement, and having to perform account-
ing both horizontally (i.e., in projects) and vertically (i.e., in line groups).
●
Procurement: The fear among this group is that a project procurement
system will be implemented in parallel with the corporate procurement
system, and that the project managers will perform their own procure-
ment, thus bypassing the procurement department.
●
Human resources management: The H. R. department may fear that a
project management career path ladder will be created, not to mention a
need for project management training programs. Human resources per-
sonnel may find that their traditional training courses, with which they
feel very comfortable, have to undergo major change to satisfy project
management requirements. This will increase their workloads.
●
Manufacturing: Little resistance is usually found here because, although
the manufacturing segment of a company is not project-driven, staff there
are usually familiar with numerous capital installation and maintenance
projects, which will have required the use of project management.
●
Engineering, R&D, and Information Technology: These departments
are almost entirely project-driven with very little resistance to project
management. Project management is viewed as a necessity.
Getting the support of and partnership with functional management in the in-
volved departments can usually overcome the resistance that exists on an organi-
160 SPECIAL PROBLEMS WITH STRATEGIC PLANNING
TABLE 11–2. RESISTANCE: WORK HABITS
Causes of Resistance Ways to Overcome Resistance
• New guidelines/processes • Dictate mandatory conformance
• Need to share “power” from above
information • Create new comfort zones at an
• Creating a fragmented work acceptable pace
environment • Identify tangible/intangible individual
• Giving up established work benefits
patterns
• Changing comfort zones
9755.ch11 10/31/00 9:52 AM Page 160
zational level. However, the resistance that may occur on an individual level is
usually more complex and more difficult to overcome. Individual resistance levels
may result from:
●
Potential changes in work habits
●
Potential changes in the social groups
●
Embedded fears
●
Potential changes in the wage and salary administration program
Tables 11–2 through 11–5 show how these different issues can lead to resis-
tance, and list possible solutions. It is imperative that we understand the resistance
to change. If individuals are happy with their current environment, there will always
be resistance to change. But even if people are unhappy with their present environ-
ment, there will still exist resistance to change unless: (1) people believe that the
change is possible, and (2) people believe that they will somehow benefit from the
change. People are usually apprehensive over what they must give up rather than
excited about what they will get in return. Not all people will be at the same readi-
ness level for change even if the entire organization is going through the change.
People will handle only so much change at one time and, if management eases up
on its pressure for change, employees will revert back to their old ways.
Management is the architect for the change process. Management must de-
velop the appropriate strategies such that the organization can align itself with
change. This is best done by developing a shared understanding with the em-
ployees expected to make the change.
Change Management 161
TABLE 11–3. RESISTANCE: SOCIAL GROUPS
Causes of Resistance Ways to Overcome Resistance
• Unknown new relationships • Maintain existing relationships in effect
• Multiple-boss reporting • Avoid cultural shock
• Multiple temporary assignments • Find an acceptable pace for rate of change
• Severing established ties
TABLE 11–4. RESISTANCE: EMBEDDED FEARS
Causes of Resistance Ways to Overcome Resistance
• Fear of failure • Educate employees on benefits of changes to
• Fear of termination the individual/corporation
• Fear of added workload • Show a willingness to admit/accept mistakes
• Fear of uncertainty/unknowns • Show a willingness to pitch in
• Dislike of uncertainty/unknowns • Transform unknowns into
• Fear of embarrassment opportunities
• Fear of a “we/they” organization • Share information
9755.ch11 10/31/00 9:52 AM Page 161
Performing the following can facilitate the change process:
●
Management must explain to the employees the reasons for the change
and solicit feedback.
●
Management must explain to the employees what outcomes are desired
and why.
●
Management must champion the change process.
●
Management must empower the appropriate individuals to institutional-
ize the changes.
●
Management must be willing to invest in training necessary to support the
changes.
PARTNERSHIPS
A partnership is a group of two or more individuals or groups working together
to achieve a common objective. Historically, partnerships were often between
companies working together rather than between individuals. In project manage-
ment, the critical partnership is the working relationship between the project and
line managers.
In the early days of project management, the selection of the individual to
serve as the project manager was most often dependent upon who possessed the
greatest command of technology. The ultimate result, as shown in Figure 11–10,
was a very poor working relationship between the project and line managers. Line
managers viewed project managers as a threat, and their relationship developed
into a competitive, superior-subordinate relationship. The most common form of
organizational structure was a strong matrix where the project manager, perceived
as having a command of technology, had a greater influence over the assigned
employees than did their line manager.
As the magnitude and technical complexity of the projects grew, it became ob-
vious that the project managers could not maintain a command of technology in all
aspects of the project. Now, project managers were viewed as possessing an under-
standing of rather than command of technology. Project managers were now be-
coming more dependent upon line managers for technical support. The project man-
162 SPECIAL PROBLEMS WITH STRATEGIC PLANNING
TABLE 11–5. RESISTANCE: WAGE AND SALARY ADMINISTRATION
Causes of Resistance Ways to Overcome Resistance
• Shifts in authority and power • Link incentives to change
• Lack of recognition after the changes • Identify future advancement
• Unknown rewards and punishment opportunities/career paths
• Improper evaluation of personal
performance
• Multiple-boss reporting
9755.ch11 10/31/00 9:52 AM Page 162
ager now finds himself or herself in the midst of a weak matrix where the employ-
ees are receiving the majority of their technical direction from the line managers.
As the partnership between the project and line managers begins to develop,
management recognizes that partnerships work best on a peer-to-peer basis,
rather than on a superior-to-subordinate basis. Now the project and line managers
view each other as equals and share in the authority, responsibility, and account-
ability needed to assure project success.
Good project management methodologies emphasize the cooperative working
relationship that must exist between the project and line managers. Conflict resolu-
tion channels may be clearly spelled out as part of the methodology, and which man-
ager has the final decision in specific areas of knowledge may be specified.
THE IMPACT OF RISK
CONTROL MEASURES
Most project management methodologies today have sections on risk management.
The project management methodology may very well dictate the magnitude of the
risk control measures to be undertaken. The risk control measures for risk assump-
tion may be significantly more complex than risk control measures for avoidance.
Figure 11–11 shows the intensity of the controls versus the intensity of the
risks. As the intensity of the risks increase, we tend to place more controls in the
risk management process and the project management methodology. Care must
The Impact of Risk Control Measures 163
Weak
Partnership
Strength
Matrix Strength
Peers
Superior-
Subordinate
Technical
Understanding
Command
of Technology
Weak
Strong
Working Relationship
Technical Capability
Strong
Increasing Cooperation
FIGURE 11–10. Partnership strength.
9755.ch11 10/31/00 9:52 AM Page 163
be taken that the cost of maintaining these control measures does not overly bur-
den the project. Time and money are required for effective risk management.
Excessive controls may require that the project manager spend more time per-
forming risk management rather than actually managing the project.
How to determine the proper amount of risk control measures is not easy.
This can be seen from Figure 11–12, which illustrates the impact on the schedule
164 SPECIAL PROBLEMS WITH STRATEGIC PLANNING
Intensity of Controls
Risk Intensity
Standard
Controls
High
Range of Controls
Low
Low
Extreme
Schedule Length
Risk Controls
Appropriate
Too
Long
Low
High
Too Many
Filters and
Gates
No
Risk Plan
Risk Management
FIGURE 11–11. Risk control measures.
FIGURE 11–12. Risk controls.
9755.ch11 10/31/00 1:50 PM Page 164
constraint. If not enough control measures are in place, or if there simply is no
risk management plan, the result may be an elongated schedule due to ineffective
risk control measures. If excessive risk control measures are in place, such as too
many filters and gates, the schedule can likewise be elongated because the work-
ers are spending too much time on contingency planning, risk reporting, docu-
mentation, and risk management meetings (i.e., there may be too many gates).
This results in very slow progress being made. A proper balance is needed.
DEPENDENCIES BETWEEN RISKS
If project managers had unlimited funding they could always identify a multitude
of risk events. Some of the risk impacts may be insignificant, whereas others may
expose the project to severe danger. With a large number of possible risk events,
it is impossible to address each and every situation. It may be necessary to prior-
itize risks.
Assume that the project manager categorizes the risks according to the proj-
ect’s time, cost, and performance constraints, as illustrated in Figure 11–13.
According to the figure, the project manager should focus his/her efforts on re-
ducing the scheduling risks first. The prioritization of risks could be established
by the project manager, by the project sponsor, or even by the customer. The pri-
oritization of risks can also be industry- or even country-specific, as shown in
Figure 11–14. It is highly unlikely that any project management methodology
would dictate the prioritization of risks. It is simply impossible to develop stan-
Dependencies between Risks 165
Schedule Cost
Technical
Performance
or Quality
First
(Highest)
Priority
Second
Priority
Third
Priority
FIGURE 11–13. Prioritization of risks.
9755.ch11 10/31/00 9:52 AM Page 165
TEAMFLY
Team-Fly
®
dardization in this area such that the application could be uniformly applied to
each and every project.
The prioritization of risks for an individual project is a good starting point and
could work well if it were not for the fact that most risks are interrelated. We know
from tradeoff analysis that changes to a schedule can, and probably will, induce
changes in cost and performance. Therefore, even though schedules have the high-
est priority in Figure 11–13, risk response to the schedule risk events may cause im-
mediate evaluation of the technical performance risk events. Risks are interrelated.
The interdependencies between risks can also be seen from Table 11–6. The
first column identifies certain actions that the project manager can opt for to take
advantage of the opportunities in column 2. Each of these opportunities, in turn,
can cause additional risks, as shown in column 3. In other words, risk mitigation
strategies that are designed to take advantage of an opportunity could create an-
other risk event that is more severe. As an example, working overtime could save
you $15,000 by compressing the schedule. But if the employees make more mis-
takes on overtime, retesting may be required, additional materials may need to be
purchased, and a schedule slippage could well occur, thus causing a loss of
$100,000. Therefore, is it worth risking a loss of $100,000 to save $15,000?
To answer this question, we can use the concept of expected value, assuming
we can determine the probabilities associated with mistakes being made and the
cost of the mistakes. Without any knowledge of these probabilities, the actions
taken to achieve the opportunities would be dependent upon the project man-
ager’s tolerance for risk.
Most project management professionals seem to agree that the most serious
risks, and the ones about which we seem to know the least, are the technical risks.
166 SPECIAL PROBLEMS WITH STRATEGIC PLANNING
(Note: Lower priorities more often undergo tradeoffs)
1
2
3
4
5
6
7
8
1 2 3 4 5 6 7 8
American Priorities
Product
Price
Timing
Quality &
Performance
Japanese Priorities
Quality
Timing
Cost of Development
Product Performance
FIGURE 11–14. Ordering of tradeoffs.
9755.ch11 10/31/00 9:52 AM Page 166
The worst situation is to have multiple technical risks that interact in an unpre-
dictable or unknown manner.
As an example, assume you are managing a new product development project.
Marketing has provided you with two technical characteristics that would make the
product highly desirable in the marketplace. The exact relationship between these
two characteristics is unknown. However, your technical subject matter experts
have prepared the curve shown in Figure 11–15. According to the curve, the two
characteristics may end up moving in opposite directions. In other words, maxi-
mizing one characteristic may require degradation in the second characteristic.
Working with marketing, you prepare the specification limits according to
characteristic B in Figure 11–15. Because these characteristics interact in often un-
Dependencies between Risks 167
TABLE 11–6. RISK INTERDEPENDENCIES
Action Opportunity Risk
• Work overtime • Schedule compression • More mistakes; higher
cost and longer schedule
• Add resources • Schedule compression • Higher cost and learning
curve shift
• Arrange for parallel work • Schedule compression • Rework and higher costs
• Reduce scope • Schedule compression • Unhappy customer and
and lower cost no follow-on work
• Hire low cost • Lower cost • More mistakes and
resources longer time period
• Outsource • Lower cost and • Contractor possesses
critical work schedule compression critical knowledge at
your expense
Specification Limit
On Characteristic B
Product Feature A
Product Feature B
Desirable
Undesirable
Undesirable Desirable
FIGURE 11–15. Interacting risks.
9755.ch11 10/31/00 9:52 AM Page 167
known ways, the specification limit on characteristic B may force characteristic A
into a region that would make the product less desirable to the ultimate consumer.
Although project management methodologies provide a framework for risk
management and the development of a risk management plan, it is highly unlikely
that any methodology would be sophisticated enough to account for the identifi-
cation of technical dependency risks. The time and cost associated with the iden-
tification, quantification, and handling of technical risk dependencies could se-
verely tax the project financially.
Another critical interdependency is the relationship between change man-
agement and risk management, both of which are part of the singular project man-
agement methodology. Each risk management strategy can results in changes that
generate additional risks. Risks and changes go hand in hand, which is one of the
reasons companies usually integrate risk management and change management
together into a singular methodology. Table 11–7 shows the relationship between
managed and unmanaged changes. If changes are unmanaged, then more time
and money is needed to perform risk management. And what makes the situation
even worse is that higher salaried employees and additional time is required to as-
sess the additional risks resulting from unmanaged changes. Managed changes,
on the other hand, allows for a lower cost risk management plan to be developed.
Project management methodologies, no matter how good, cannot accurately
define the dependencies between risks. It is usually the responsibility of the proj-
ect team to make these determinations.
SELECTING THE APPROPRIATE
RESPONSE MECHANISM
There exist four widely accepted risk response methods; assumption, reduction,
transfer, and avoidance. Historically, most practitioners argue that the risk re-
168 SPECIAL PROBLEMS WITH STRATEGIC PLANNING
TABLE 11–7. UNMANAGED VERSUS MANAGED CHANGES
How Which
Type of Where Time Energy Resources
Change Is Invested Is Invested Are Used
Unmanaged • Back-end • Rework • Senior management
• Enforcement and key players only
• Compliance
• Supervision
Managed • Front-end • Education • Stakeholders
• Communication (internal)
• Planning • Suppliers
• Improvements • Customers
• Value added
9755.ch11 10/31/00 9:52 AM Page 168
sponse method selected is heavily biased toward the magnitude of the risk and the
project manager’s tolerance level for risk. While this may still be true, there are
other factors that influence the risk response method selected, and many of these
can be included as part of the project management methodology.
The potential rewards of selecting the appropriate risk response can influence
the selection process. Figure 11–6 shows the risk-reward matrix. What is impor-
tant to recognize in Figure 11–16 is that the risk-reward matrix is actually three-
dimensional, with the third axis being the quality of resources required. Certain
risk response actions, such as assumption or reduction, require that resources be
consumed. The quality and availability of the resources required can influence the
risk response selection process irrespective of the potential rewards. For example,
if a company adopts a risk assumption approach on an R&D project, the rewards
could be huge if patents are issued and licensing agreements follow. But this is
predicated upon available, qualified resources. Without the appropriate available
resources, the only response mechanisms remaining might be risk avoidance or
risk transfer.
A second factor influencing the risk response method selected is the proce-
dural documentation requirements of the project management methodology. This
appears in Figure 11–17. Project management methodologies that are based on
policies and procedures are very rigid. Most good methodologies today are based
upon guidelines that provide the project manager with significantly more flexi-
bility in decision-making.
This flexibility (i.e., use of guidelines) can affect the risk response method
selected. Although no empirical data exists as yet to support this, there appears a
Selecting the Appropriate Response Mechanism 169
Low High
Reward
Medium
Risk
High
Low
Medium
Quality
of
Resources
Needed
Low
Medium
High
FIGURE 11–16. The risk-reward matrix.
9755.ch11 10/31/00 9:52 AM Page 169
tendency for project managers to accept higher levels of risk if the project man-
ager is given more freedom in decision-making. On the other hand, the rigidity of
policies and procedures generally allows for lower levels of risk acceptance and
project managers seem to prefer avoidance. As risk management grows, more re-
search will be expected in this area.
CONCLUSIONS
General strategic planning is never accomplished only once. It must be reexam-
ined over and over again as requirements change and new information appears.
The same holds true for strategic planning for project management. As more and
more of these problem areas are identified internally from lessons learned files
and externally in published articles, some of these often overlooked problems will
be corrected.
170 SPECIAL PROBLEMS WITH STRATEGIC PLANNING
Project Procedural
Documentation
Guidelines
High Low
Tolerance for Risk
Rigid
Policies/
Procedures
Reduction
Transfer
Avoidance
Assumption
FIGURE 11–17. Which method to use?
9755.ch11 10/31/00 9:52 AM Page 170
171
Case 1
Packer Telecom
Background
The rapid growth of the telecom industry made it apparent to Packer’s executives that
risk management must be performed on all development projects. If Packer were late
in the introduction of a new product, then market share would be lost. Furthermore,
Packer could lose valuable opportunities to “partner” with other companies if Packer
were regarded as being behind the learning curve with regard to new product devel-
opment.
Another problem facing Packer was the amount of money being committed to
R&D. Typical companies spend 8 to 10 percent of earnings on R&D, whereas in the
telecom industry, the number may be as high as 15 to 18 percent. Packer was spend-
ing 20 percent on R&D, and only a small percentage of the projects that started out in
the conceptual phase ever reached the commercialization phase, where Packer could
expect to recover its R&D costs. Management attributed the problem to a lack of ef-
fective risk management.
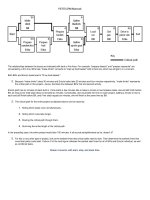
The Meeting
PM: I have spent a great deal of time trying to benchmark best practices in risk man-
agement. I was amazed to find that most companies are in the same boat as us, with
very little knowledge in risk management. From the limited results I have found from
other companies, I have been able to develop a risk management template for us to
use.
Sponsor: I’ve read over your report and looked at your templates. You have words
and expressions in the templates that we don’t use here at Packer. This concerns me
greatly. Do we have to change the way we manage projects to use these templates?
9755.ch12 10/31/00 9:50 AM Page 171
Are we expected to make major changes to our existing project management method-
ology?
PM: I was hoping we could use these templates in their existing format. If the other
companies are using these templates, then we should also. These templates also have
the same probability distributions that other companies are using. I consider these
facts equivalent to a validation of the templates.
Sponsor: Shouldn’t the templates be tailored to our methodology for managing proj-
ects and our life cycle phases? These templates may have undergone validation, but
not at Packer. The probability distributions are also based upon someone else’s his-
tory, not our history. I cannot see anything in your report that talks about the justifi-
cation of the probabilities.
The final problem I have is that the templates are based upon history. It is my un-
derstanding that risk management should be forward looking, with an attempt at pre-
dicting the possible future outcomes. I cannot see any of this in your templates.
PM: “I understand your concerns, but I don’t believe they are a problem. I would
prefer to use the next project as a “breakthrough” project using these templates. This
will give us a good basis to validate the templates.
Sponsor: I will need to think about your request. I am not sure that we can use these
templates without some type of risk management training for our employees.
Questions
1. Can templates be transferred from one company to another, or should tailoring be
mandatory?
2. Can probability distributions be transferred from one company to another? If not,
then how do we develop a probability distribution?
3. How do you validate a risk management template?
4. Should a risk management template be forward looking?
5. Can employees begin using a risk management template without some form of
specialized training?
172 PACKER TELECOM
9755.ch12 10/31/00 9:50 AM Page 172
173
Case 2
Luxor Technologies
Between 1992 and 1996, Luxor Technologies had seen their business almost quadru-
ple in the wireless communications area. Luxor’s success was attributed largely to the
strength of its technical community, which was regarded as second to none. The tech-
nical community was paid very well and given the freedom to innovate. Even though
Luxor’s revenue came from manufacturing, Luxor was regarded by Wall Street as be-
ing a technology-driven company.
The majority of Luxor’s products were based upon low cost, high quality appli-
cations of the state-of-the-art technology, rather than advanced state-of-the-art tech-
nological breakthroughs. Applications engineering and process improvement were
major strengths at Luxor. Luxor possessed patents in technology breakthrough, appli-
cations engineering, and even process improvement. Luxor refused to license their
technology to other firms, even if the applicant was not a major competitor.
Patent protection and design secrecy were of paramount importance to Luxor. In
this regard, Luxor became vertically integrated, manufacturing and assembling all
components of their products internally. Only off-the-shelf components were pur-
chased. Luxor believed that if they were to use outside vendors for sensitive compo-
nent procurement, they would have to release critical and proprietary data to the ven-
dors. Since these vendors most likely also serviced Luxor’s competitors, Luxor
maintained the approach of vertical integration to maintain secrecy.
Being the market leader technically afforded Luxor certain luxuries. Luxor saw
no need for expertise in technical risk management. In cases where the technical com-
munity was only able to achieve 75–80 percent of the desired specification limit, the
product was released as it stood, accompanied by an announcement that there would
be an upgrade the following year to achieve the remaining 20–25 percent of the spec-
ification limit, together with other features. Enhancements and upgrades were made
on a yearly basis.
9755.ch12 10/31/00 9:50 AM Page 173
By the fall of 1996, however, Luxor’s fortunes were diminishing. The competi-
tion was catching up quickly, thanks to major technological breakthroughs. Marketing
estimated that by 1998, Luxor would be a “follower” rather than a market leader.
Luxor realized that something must be done, and quickly.
In January 1999, Luxor hired an expert in risk analysis and risk management to
help Luxor assess the potential damage to the firm and to assist in development of a
mitigation plan. The consultant reviewed project histories and lessons learned on all
projects undertaken from 1992 through 1998. The consultant concluded that the ma-
jor risk to Luxor would be the technical risk and prepared Exhibits I and II.
Exhibit I shows the likelihood of a technical risk event occurring. The consultant
identified the six most common technical risk events that could occur at Luxor over
the next several years, based upon the extrapolation of past and present data into the
future. Exhibit II shows the impact that a technical risk event could have on each pro-
ject. Because of the high probability of state-of-the-art advancements needed in the
future (i.e., 95 percent from Exhibit I), the consultant identified the impact probabil-
ities in Exhibit II for both with and without state-of-the-art advancement needed.
Exhibits I and II confirmed management’s fear that Luxor was in trouble. A
strategic decision had to be made concerning the technical risks identified in Exhibit
I, specifically the first two risks. The competition had caught up to Luxor in applica-
tions engineering and was now surpassing Luxor in patents involving state-of-the-art
174 LUXOR TECHNOLOGIES
Exhibit I. Likelihood of a technical risk
Event Likelihood Rating
• State-of-the-art advance needed 0.95
• Scientific research required 0.80
• (without advancements)
• Concept formulation 0.40
• Prototype development 0.20
• Prototype testing 0.15
• Critical performance demonstrated 0.10
Exhibit II. Impact of a technical risk event
Impact Rating
With State-of- Without State-of
Event the-Art Changes the-Art Changes
• Product performance not at 0.95 0.80
• 100 percent of specification
• Product performance not at 0.75 0.30
• 75–80 percent of specification
• Abandonment of project 0.70 0.10
• Need for further enhancements 0.60 0.25
• Reduced profit margins 0.45 0.10
• Potential systems 0.20 0.05
• performance degradation
9755.ch12 10/31/00 9:50 AM Page 174
advancements. From 1992 to 1998, time was considered as a luxury for the technical
community at Luxor. Now time was a serious constraint.
The strategic decision facing management was whether Luxor should struggle to
remain a technical leader in wireless communications technology or simply console
itself with a future as a “follower.” Marketing was given the task of determining the
potential impact of a change in strategy from a market leader to a market follower.
The following list was prepared and presented to management by marketing:
1. The company’s future growth rate will be limited.
2. Luxor will still remain strong in applications engineering but will need to out-
source state-of-the-art development work.
3. Luxor will be required to provide outside vendors with proprietary informa-
tion.
4. Luxor may no longer be vertically integrated (i.e., have backward integra-
tion).
5. Final product costs may be heavily influenced by the costs of subcontractors.
6. Luxor may not be able to remain a low cost supplier.
7. Layoffs will be inevitable, but perhaps not in the near term.
8. The marketing and selling of products may need to change. Can Luxor still
market products as a low-cost, high quality, state-of-the-art manufacturer?
9. Price-cutting by Luxor’s competitors could have a serious impact on Luxor’s
future ability to survive.
The list presented by marketing demonstrated that there was a serious threat to
Luxor’s growth and even survival. Engineering then prepared a list of alternative
courses of action that would enable Luxor to maintain its technical leadership position:
1. Luxor could hire (away from the competition) more staff personnel with pure
and applied R&D skills. This would be a costly effort.
2. Luxor could slowly retrain part of its existing labor force using existing, ex-
perienced R&D personnel to conduct the training.
3. Luxor could fund seminars and university courses on general R&D methods,
as well as R&D methods for telecommunications projects. These programs
were available locally.
4. Luxor could use tuition reimbursement funds to pay for distance learning
courses (conducted over the Internet). These were full semester programs.
5. Luxor could outsource technical development.
6. Luxor could purchase or license technology from other firms, including com-
petitors. This assumed that competitors would agree to this at a reasonable
price.
7. Luxor could develop joint ventures/mergers with other companies which, in
turn, would probably require Luxor to disclose much of its proprietary knowl-
edge.
With marketing’s and engineering’s lists before them, Luxor’s management had
to decide which path would be best for the long term.
Questions
1. Can the impact of one specific risk event, such as a technical risk event, create ad-
ditional risks, which may or may not be technical risks? Can risk events be inter-
related?
Case 2 175
9755.ch12 10/31/00 9:50 AM Page 175
TEAMFLY
Team-Fly
®
2. Does the list provided by marketing demonstrate the likelihood of a risk event or
the impact of a risk event?
3. How does one assign probabilities to the marketing list?
4. The seven items in the list provided by engineering are all ways of mitigating cer-
tain risk events. If the company follows these suggestions, is it adopting a risk re-
sponse mode of avoidance, assumption, reduction, or deflection?
5. Would you side with marketing or engineering? What should Luxor do at this
point?
176 LUXOR TECHNOLOGIES
9755.ch12 10/31/00 9:50 AM Page 176
177
Case 3
Altex Corporation
Background
Following World War II, the United States entered into a Cold War with Russia. To
win this Cold War, the United States had to develop sophisticated weapon systems
with such destructive power that any aggressor knew that the retaliatory capability of
the United States could and would inflict vast destruction.
Hundreds of millions of dollars were committed to ideas concerning technology
that had not been developed as yet. Aerospace and defense contractors were growing
without bounds, thanks to cost-plus-percentage-of-cost contract awards. Speed and
technological capability were judged to be significantly more important than cost. To
make matters worse, contracts were often awarded to the second or third most quali-
fied bidder for the sole purpose of maintaining competition and maximizing the total
number of defense contractors.
Contract Award
During this period Altex Corporation was elated when it learned that it had just been
awarded the R&D phase of the Advanced Tactical Missile Program (ATMP). The
terms of the contract specified that Altex had to submit to the Army, within 60 days
after contract award, a formal project plan for the two-year ATMP effort. Contracts at
that time did not require that a risk management plan be developed. A meeting was
held with the project manager of R&D to assess the risks in the ATMP effort.
PM: I’m in the process of developing the project plan. Should I also develop a risk
management plan as part of the project plan?
Sponsor: Absolutely not! Most new weapon systems requirements are established
by military personnel who have no sense of reality about what it takes to develop a
9755.ch12 10/31/00 9:50 AM Page 177


![Wiley strategic planning for project management found @ [redsamara com]](https://media.store123doc.com/images/document/14/ri/gk/medium_gki1396437553.jpg)