The option trader s guide to probability volatility and timing phần 2 pptx
Bạn đang xem bản rút gọn của tài liệu. Xem và tải ngay bản đầy đủ của tài liệu tại đây (371.18 KB, 29 trang )
depict the expected profit or loss as of a different date based on
the price of Coffee at that time. A range of Coffee prices is listed
along the bottom of the graph.
By looking at the risk curves on several dates leading up to
expiration, we get a more realistic picture of the risk involved.
The real risk in this trade is not that Coffee will be trading above
8098 at the time of option expiration. The real risk in this trade
is that Coffee prices will experience a sustained move upward
immediately after the trade is entered. If Coffee rallies sooner
rather than later, traders may be holding a trade with a large
open loss. Although the probability of this happening may be
low, when you consider that Coffee once opened 3000 points
higher, you can begin to appreciate the need to acknowledge that
such a thing could happen and the potential impact that such a
move could have on this trade. Therefore, you need to know how
such a move would affect your position to ensure that you could
weather the worst-case scenario.
The key is not in figuring out what to do once the worst-
case scenario unfolds. The key is advance planning to
avoid getting into such a situation in the first place.
This type of planning would be impossible if you looked only
at the risk curve at expiration, which is what the graph in Figure
1.3 shows. Unfortunately, the graph showing how the trade
would work out if it were held until expiration is the one that
usually shows up when option-trading strategies are discussed.
As you can see in Figure 1.4, the single risk curve drawn at expi-
ration does not tell the full story.
It is impossible to overemphasize the importance of recog-
nizing the risks that exist for any given trade and planning in ad-
vance to minimize risk should the worst-case scenario unfold,
rather than waiting for the worst to happen and then trying to
figure out how to save your skin!
There is a 91% probability of profit if the position is held to
expiration; however,
Introduction 15
More free books @ www.BingEbook.com
• If Coffee rallies sharply before expiration, large unlimited
losses can occur!
• Maximum profit potential of $2092 occurs only if Coffee
closes exactly at 7500 at expiration!
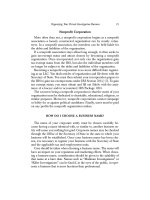
Case 2: Synthetic Long Futures Position
The trade presented in Figure 1.5 appears to be close to a sure
thing. The strategy used in this example is referred to as a syn-
thetic long futures position. The trade is established by buying
an out-of-the-money call and simultaneously writing an out-of-
the-money put. The risk curve depicts the profit or loss for a
trader holding this position if the trade is held until option expi-
ration. The expected dollar profit or loss is listed down the left
side of the graph, and a range of underlying futures prices are
listed across the bottom of the graph.
If this trade is held until expiration,
• There is an 80% probability of profit. In other words, with
S&P 500 futures trading at 1239 as the trade is entered, there
is an 80% probability that S&P 500 futures will be trading
above the break-even price of 1170 at the time of option ex-
piration.
16 The Option Trader’s Guide
6146
1639
–2868
–7375
113950 117283 120616 123949 127283 130616 133949
Date: 4/19/01
Profit/Loss: –16
Underlying: 117003
Above: 80%
Below: 20%
% Move Required: –5.7%
Figure 1.5 Risk curve for S&P synthetic futures at expiration.
More free books @ www.BingEbook.com
• There is unlimited risk if the S&P 500 falls below 1170.
However, when this trade is entered there is only a 20%
probability of the S&P 500 declining from 1239 to 1170 or
lower by the time of option expiration.
• This trade has unlimited upside potential.
Unfortunately, just as in Case 1, looking at this trade only at
expiration fails to answer the most important question about
risk. Remember, the questions you need to answer are “How
bad can things get?” and “What do I plan to do about it?” To an-
swer these questions, you must again look at what could happen
to this trade before expiration (see Figure 1.6).
Synthetic futures: long a call, short a put
• Long 1 Apr 1320 call at 1730.
• Short 1 Apr 1175 put at 1830.
• As long as S&P is above 1170 at option expiration, this trade
is profitable.
• An 80% probability of profit.
• Unlimited profit potential.
Sounds like a sure thing! But as with the Coffee trade in
Case 1, the risk curves in Figure 1.6 paint a much more illumi-
Introduction 17
13760
4587
–4587
–13761
113950 117283 120616 123949 127283 130616 133949
Date: 3/16/01
Profit/Loss: –7631
Underlying: 117004
Above: 94%
Below: 6%
% Move Required: –5.7%
Figure 1.6 Risk curves for S&P synthetic futures leading up to expiration.
TEAMFLY
Team-Fly
®
More free books @ www.BingEbook.com
nating picture of the risks involved with this trade than does the
graph in Figure 1.5. By looking at the risk curves on several dates
before expiration, we get a more realistic picture of the risk
involved.
The real risk in this trade is not that the S&P will fall below
1170 at expiration. The real risk is that the S&P will decline
sharply before expiration. If the S&P falls sooner than later, the
trader may be holding a large open loss. The key is not figuring
out what to do once this occurs; the key is to plan in order to
avoid getting into such a situation in the first place. This type of
planning would be impossible if you looked only at the risk
curve at expiration, which was shown in the graph in Figure 1.5.
Unfortunately, the graph showing how the trade would work out
if it were held until expiration is the one that usually shows up
when various option-trading strategies are discussed. As you can
see in Figure 1.6, the single profit/loss line drawn at expiration
does not tell the full story.
NOTE
The purpose of this example is not to imply that synthetic futures are a bad
idea nor that option educational materials are purposefully misleading when
all they include is a profit/loss graph as of option expiration. The purpose is
simply to illustrate the importance of identifying and planning for the risks in-
volved with any trade. It is impossible to state definitively that this is a good
trade or a bad trade—that is up to each trader to determine.
As long as the S&P is above 1170 at option expiration, this
trade is profitable; however, if S&P falls sooner than later, un-
limited losses can occur!
Summary
The primary message to take away from this chapter is simply
that options differ in many ways from other forms of invest-
ment. When you buy a stock or a futures contract, you either
make a point for each point it rises in price, or you lose a point
18 The Option Trader’s Guide
More free books @ www.BingEbook.com
for each point it declines. With options it is not always so
straightforward.
You should also prepare yourself to focus on the key ele-
ments that must be understood and applied to achieve success in
option trading.
Introduction 19
More free books @ www.BingEbook.com
More free books @ www.BingEbook.com
Chapter 2
THE BASICS OF OPTIONS
21
Before one can hope to succeed in any field of endeavor, one
must have a firm grasp of the fundamental concepts. It is no dif-
ferent in the field of option trading. Anyone can get lucky on a
trade now and then, but a solid understanding of the basics is re-
quired to achieve consistent long-term success. Option trading
has a vocabulary all its own. In this chapter you will learn many
common and essential terms.
When you buy or sell short a stock or a futures contract, the
results you can expect are fairly straightforward. If you buy 100
shares of stock and that stock goes up 5 points, you will make
$500. If it goes down 5 points, you will lose $500. With options,
these simple parameters do not apply. Depending on the option
or options you choose to buy or write, your expected return and
the amount of risk you are exposed to can vary greatly. Before
delving into these possibilities, let’s define some important
option terms.
Option Definitions
Call option. A call buyer pays a premium to the option
writer, which gives the option buyer the right, within a
specified period, to buy 100 shares of stock (or one fu-
tures contract) at a specified price (known as the strike
price), no matter how high the stock price may rise. For
example, say a trader buys a call option with a strike price
More free books @ www.BingEbook.com
of 50. The stock then rises to 100. By virtue of holding a
call option with a strike price of 50, the trader can exer-
cise the option and buy 100 shares of stock at a price of 50
a share.
Put option. A put buyer pays a premium to the option
writer, which gives the option buyer the right, within a
specified period, to sell 100 shares of stock (or one futures
contract) at a specific price, no matter how low the stock
price may fall. For example, say a trader buys a put option
with a strike price of 50. The stock then falls to 10. Be-
cause the trader holds a put option with a strike price of
50, the trader can exercise the option and sell 100 shares
of stock at 50.
Underlying. In the world of options, the word underlying
refers to the security on which a given option is based.
For example, IBM is the underlying security for all IBM
options. In futures markets, Soybean futures are the un-
derlying for all Soybean options.
Option buyer. The person who buys an option.
Option writer. The person who writes an option.
Option premium. The price of an option contract. Stock
options are for 100 shares, so a stock option that is quoted
at a price of $5 (or 5), represents an option premium of
$500 (100 × $5). The option premium is the amount that
the option buyer pays to the option writer. It also repre-
sents the total amount of risk assumed by the buyer of
the option and the maximum amount of profit that can
be obtained by the writer of the option.
Strike price or exercise price. The strike price is the price at
which an option can be exercised, that is, the price per
share that the buyer of a call option must pay to buy the
stock if the buyer chooses to exercise his or her option.
Option exchanges designate the available strike prices for
each listed security. For most stocks the default range be-
tween strike prices is 5 points (e.g., 25, 30, 35, 40). Many
stocks also offer strike prices at 2.5-point increments
below 30 (e.g., 2.5, 7.5, 12.5, 17.5, 22.5, 27.5). If a stock or
stock index reaches a price above 200, the options often
trade only in increments of 10 points or more (e.g., 250,
22 The Option Trader’s Guide
More free books @ www.BingEbook.com
260, 270, 280). Strike prices for options on futures are
set by the exchange and vary from commodity to
commodity.
Expiration date. The date after which an option is void and
ceases to exist is its expiration date. For U.S. stock op-
tions, the expiration date is the third Friday of the expi-
ration month. In other words, June options expire on the
third Friday in June, July options expire on the third Fri-
day in July, and so on. For futures options, the expiration
months and expiration dates can vary and are set by the
exchange on which a given series of options is traded.
Expiration cycle. For U.S. stock options, the exchange on
which the options are traded designates a particular expi-
ration cycle—either a January cycle, February cycle,
March cycle, or all months. The expiration months for
the options on a given stock are determined by the expi-
ration cycle assigned to that stock.
Theoretical price or fair value. The price at which a given
option is considered fairly valued based on a combination
of variables used in a standard option pricing model is
called the option’s fair value (see Chapter 4 for more de-
tails on option pricing).
In-the-money option. A call option is in the money if its
strike price is less than the current market price of the
underlying. A put option is in the money if its strike price
is higher than the current market price of the underlying.
A call option with a strike price of 50 is considered in
the money as long as the price of the stock is greater than
50. A put option with a strike price of 50 is considered in
the money as long as the price of the stock is less than 50.
Out-of-the-money option. An option that currently has no
intrinsic value is an out-of-the-money option. A call op-
tion is out of the money if its exercise price is higher than
the current market price of the underlying. A put option
is out of the-money if its exercise price is lower than the
current price of the underlying.
A call option with a strike price of 50 is considered out
of the money as long as the price of the stock is less than
50. A put option with a strike price of 50 is considered out
The Basics of Options 23
More free books @ www.BingEbook.com
of the money as long as the price of the stock is greater
than 50.
At-the-money option. For any security, the option whose
strike price is currently closest to the actual price of the
underlying security is generally referred to as the at-the-
money strike. Please note that, technically speaking,
the at-the-money option is usually slightly in or out of the
money. For example, if a stock is trading at a price of 96,
the 95 call and the 95 put options are considered the at-
the-money strikes, even though the call option is 1 point
in the money and the put is 1 point out of the money.
Intrinsic value. The amount by which an option is in the
money is its intrinsic value. An out-of-the-money option
has no intrinsic value. If a call option has a strike price of
50 and the underlying stock is trading at 55, the 50 call
option has 5 points of intrinsic value. If a put option has
a strike price of 50 and the underlying stock is trading at
45, the 50 put option has 5 points of intrinsic value.
Extrinsic value (or time premium). The price of an option
less its intrinsic value is its extrinsic value. The entire
premium of an out-of-the-money option consists of ex-
trinsic value, or time premium. Time premium is essen-
tially the amount an option buyer pays to the option
seller (above and beyond the intrinsic value of the op-
tion) to induce the seller to enter into the trade. All
options lose the entire time premium at expiration, a
phenomenon referred to as time decay (see Chapter 5).
Long. A long position results from the purchase of an op-
tion contract.
Short. A short position results from the short sale of an op-
tion contract, also known as writing a contract.
Buy premium or long premium. A buy premium results
when you enter into a position where you are paying
more money for the option you buy than you take in for
any option you may write.
Sell premium or short premium. A sell premium results
from entering into a position where you are taking in
more money for the option you buy than you pay out for
any option you may write.
24 The Option Trader’s Guide
More free books @ www.BingEbook.com
Naked option. Buying an option of a single strike price is
considered a naked long option. Writing an option of a
single strike price is considered a naked short position.
The buyer of the IBM 95 call is holding a long naked op-
tion. The writer of the IBM 95 call is holding a short
naked option.
Spread. A spread position involves buying or writing options
of different strike prices or different expiration months. A
trader who buys the IBM 95 call and simultaneously writes
the IBM 100 call has entered into a spread position.
Historic volatility. A value calculated based on the price
fluctuations of the underlying security is the stock’s his-
toric volatility. This value represents an estimate of how
far the underlying security is likely to fluctuate in price
over the ensuing 12-month period. A stock with a his-
toric volatility of 20% would be expected to fluctuate
plus or minus 20% from its current price over the ensu-
ing 12 months.
Implied option volatility. The implied option volatility is
the value that must be plugged into an option pricing
model to cause the model to arrive at the current market
price as an output, given the other known variables (see
Chapter 4, Option Pricing, and Chapter 6, Volatility). It
may also be referred to as option volatility and implied
volatility.
Overvalued option. An option is considered overvalued if
market price is greater than the theoretical price gener-
ated for that option by an option pricing model.
Undervalued option. An option is considered undervalued
if its market price is less than the theoretical price gener-
ated for that option by an option pricing model.
Expensive option. An option can be considered expensive if
implied volatility is high relative to the historic range of
implied volatility for options on the underlying security
(see Chapter 6).
Inexpensive option. An option can be considered inexpen-
sive or cheap if its implied volatility is low relative to the
historic range of implied volatility for options on the un-
derlying security (see Chapter 6).
The Basics of Options 25
More free books @ www.BingEbook.com
Options on a Specific Security
On January 5, IBM closed at a price of 94. Table 2.1 shows most
of the available call and put options for IBM at that time. The
strike prices—in this case, ranging from 70 to 120—are listed
down the left side of each grid. The available expiration months
and the number of days left until expiration for each available
month is listed across the top of each grid.
Table 2.1 shows the latest market price for each option. For
example, the February 95 call option has 42 days left until
expiration and is currently trading at a price of 6.88. The April 90
put has 106 days left until expiration and is trading at a price
of 7.88.
By examining the price grid you can see that as the strike
prices get higher, call prices decrease and put prices increase.
This happens because at each successively higher strike price
there is less intrinsic value in each call option price and more in-
trinsic value in each put option price. As strike prices go lower,
call prices increase and put prices decrease. This happens be-
cause at each successively lower strike price there is more in-
trinsic value in each call option price and less intrinsic value in
each put option price.
26 The Option Trader’s Guide
Table 2.1 Market Price of IBM Options on January 5 (Stock Price = 94)
Calls Puts
JAN FEB APR JUL JAN FEB APR JUL
14 42 106 197 14 42 106 197
70 Market 24.25 25.00 26.88 28.88 70 Market .44 1.00 2.12 3.38
75 Market 19.75 20.50 22.88 2.25 75 Market .62 1.44 2.88 4.38
80 Market 15.25 16.50 19.75 21.50 80 Market 1.38 2.38 4.25 5.62
85 Market 11.12 13.00 15.75 18.50 85 Market 2.06 3.62 5.88 7.38
90 Market 7.88 9.50 13.12 15.75 90 Market 3.50 5.12 7.88 9.88
95 Market 4.50 6.88 10.12 13.25 95 Market 5.25 7.62 10.12 12.00
100 Market 2.38 4.75 8.00 10.88 100 Market 8.12 10.12 12.50 14.38
105 Market 1.31 3.00 6.12 8.88 105 Market 12.50 13.38 16.25 17.38
110 Market .62 2.00 4.88 7.50 110 Market 17.00 17.75 19.12 20.62
115 Market .31 1.25 3.50 6.12 115 Market 21.62 21.38 23.00 24.38
120 Market .12 .56 2.62 4.75 120 Market 25.75 25.88 27.00 28.25
More free books @ www.BingEbook.com
Call Options
Table 2.1 and Figures 2.1 through 2.3 depict the risk curves at
expiration for 3 separate IBM call options: the deep-in-the-
money 80 call, the at-the-money 95 call, and the far-out-of-
the-money 115 call.
The Basics of Options 27
2750
1986
1222
458
–306
–1070
–1834
64.00 74.00 84.00 94.00 104.00 114.00 124.00
Date: 2/16/01
Profit/Loss: –7
Underlying: 96.42
Above: 45%
Below: 55%
% Move Required: –1.9%
Figure 2.1 Risk curve for buying 1 February IBM 80 call for $1650.
4426
3442
2459
1475
492
–492
–1476
64.00 74.00 84.00 94.00 104.00 114.00 124.00
Date: 2/16/01
Profit/Loss: –7
Underlying: 101.98
Above: 29%
Below: 71%
% Move Required: +8.4%
Figure 2.2 Risk curve for buying 2 February IBM 95 calls for $1375.
TEAMFLY
Team-Fly
®
More free books @ www.BingEbook.com
Take a close look at the differences in the risk curves for the
deep-in-the-money February 80 call option and the far-out-of-
the-money February 115 call option. Many traders are lured into
buying the inexpensive out-of-the-money option because of its
low price (a trader can buy thirteen 115 calls for about the same
cost as one 80 call, which to some traders represents a deal they
just can’t pass up). In fact, if IBM makes a big jump in price, the
buyer of the 115 calls stands to make almost four times as much
money on the same investment as the buyer of one 80 call. How-
ever, the tradeoff here is that the stock must rise 24% by option
expiration for the 115 call just to reach its break-even point. The
stock need only advance 1.9% or more by option expiration for
the 80 call to exceed its break-even point.
In sum, for the trader who expects IBM stock to rise in price,
the 115 call offers the greater opportunity for making a great deal
of money, whereas the 80 call offers a greater chance of making
any money.
Put Options
Figures 2.4 through 2.6 depict the risk curves for three separate
IBM put options: the far-out-of-the-money 80 put, the at-the-
money 95 put, and the deep-in-the-money 115 put.
28 The Option Trader’s Guide
10075
8116
6157
4198
2239
280
–1680
64.00 74.00 84.00 94.00 104.00 114.00 124.00
Date: 2/16/01
Profit/Loss: 7
Underlying: 116.17
Above: 7%
Below: 93%
% Move Required: +24.0%
Figure 2.3 Risk curve for buying 13 February IBM 115 calls for $1625.
More free books @ www.BingEbook.com
Take a close look at the differences in the risk curves for the
far-out-of-the-money February 80 put option and the deep-in-
the-money February 115 put option. Many traders are lured into
buying the inexpensive out-of-the-money option because of its
low price (a trader can buy nine 80 puts for the about the same
cost as one 115 put, which to some traders represents a deal they
The Basics of Options 29
12267
6815
1363
–4089
64.00 74.00 84.00 94.00 104.00 114.00 124.00
Date: 2/16/01
Profit/Loss: 25
Underlying: 77.54
Above: 91%
Below: 9%
% Move Required: –17.5%
Figure 2.4 Buy 9 February IBM 80 puts for $2138.
7014
3897
779
–2338
64.00 74.00 84.00 94.00 104.00 114.00 124.00
Date: 2/16/01
Profit/Loss: 14
Underlying: 87.35
Above: 69%
Below: 31%
% Move Required: –7.1%
Figure 2.5 Buy 3 February IBM 95 puts for $2288.
More free books @ www.BingEbook.com
just can’t pass up). In fact, if IBM stock declines dramatically, the
buyer of the 80 put stands to make more than four times as
much money on the same investment as the buyer of one 115
put. However, the tradeoff here is that the stock must decline
–17.5% by option expiration for the 80 put to reach its break-
even point. The stock need only decline –1.9% or more by option
expiration for the 115 put to exceed its break-even point.
In sum, for the trader who truly expects IBM stock to fall
sharply in price, the 80 put offers the greater opportunity for
making lots of money, whereas the 115 put offers a greater
chance of making any money.
Intrinsic Value versus Extrinsic Value
Table 2.2 shows the current price for several IBM call options
and breaks the current price down into intrinsic value and ex-
trinsic value. Column 1 shows the option’s strike price, Column
2 shows the actual price of the option, Column 3 shows the
amount of intrinsic value built into the price of the option, and
Column 4 shows the amount of extrinsic value—or time pre-
mium—built into the current option price. These figures are
30 The Option Trader’s Guide
2888
1123
–642
–2407
64.00 74.00 84.00 94.00 104.00 114.00 124.00
Date: 2/16/01
Profit/Loss: –3
Underlying: 92.66
Above: 55%
Below: 45%
% Move Required: –1.9%
Figure 2.6 Buy 1 February IBM 115 put for $2138.
More free books @ www.BingEbook.com
based on IBM trading at 94 on January 5. With 42 days left until
February option expiration,
• 31% of the price of the 85 call is made up of the time pre-
mium (4.00 of time premium divided by the 13.00 option
price)
• 81% of the price of the 90 call is made up of the time pre-
mium (5.50 of time premium divided by the 9.50 option
price)
• 100% of the price of the 95 call is made up of the time pre-
mium (6.88 of time premium divided by the 6.88 option
price)
The last column shows how much the option will be worth if
IBM is still trading at 94 at the time of option expiration. Notice
that the price at expiration is exactly equal to the intrinsic value.
A beginning trader might wonder, “Why is there time pre-
mium in the price of each option? How come options don’t just
trade for their intrinsic value, since that is the only real value
they have?” The answer is that time premium can be thought of
as a premium paid to the option writer in order to induce him or
her to assume the risk of writing an option, which can expose
the option writer to unlimited risk. Similarly, if the underlying
security happens to be extremely volatile, the option writer is
likely to demand more of a premium than if volatility is low.
This is roughly equivalent to an insurance company charging a
higher premium to insure a high-risk driver. In other words, to
assume the unlimited risk associated with writing options in a
volatile market, the option writer demands more premium in
The Basics of Options 31
Table 2.2 Intrinsic and Extrinsic Value
February Call Intrinsic Time Price at
Option Price Value Premium Expiration*
85 call 13.00 9.00 4.00 9.00
90 call 9.50 4.00 5.50 4.00
95 call 6.88 0.00 6.88 0.00
*If IBM is trading at a price of 94 at the time of expiration.
More free books @ www.BingEbook.com
order to compensate for this risk. This is discussed in more detail
in Chapters 4 through 6.
In-the-Money versus Out-of-the-Money Options
Which option a trader chooses to purchase has a significant im-
pact on the cost of entry, the profit potential, and the probability
of profit. Consider the following example. On January 5, a trader
with $3000 to invest expects IBM to rise before the February op-
tion expiration. She considers the following choices:
• Buy 3 February 90 calls at 9.88 for $2962.
• Buy 4 February 95 calls at 7.12 for $2850.
• Buy 6 February 100 calls at 4.88 for $2925.
What are the implications for each choice? The best way to
assess the relative advantages and disadvantages is to examine
the risk curves for each potential trade.
Figures 2.7 through 2.9 depict the risk curves for the three op-
tions closest to the money—the 90, 95, and 100 strike prices—
with IBM trading at a price of 94.
32 The Option Trader’s Guide
6038
4529
3019
1510
0
–1510
–3020
68.00 76.69 85.31 94.00 102.69 111.31 120.00
Date: 2/16/01
Profit/Loss: –22
Underlying: 99.88
Above: 27%
Below: 73%
% Move Required: +6.2%
Figure 2.7 Risk curve for buying 3 February 90 calls at 9.88.
More free books @ www.BingEbook.com
Table 2.3 displays the break-even price for each trade, the
percentage move required to reach the break-even point, and the
probability of that price level being reached at the time of option
expiration. The obvious trend to note is that the further out-of-
the-money the strike price of the option is, the lower the proba-
bility of generating a profit.
The Basics of Options 33
715 2
5364
3576
1788
0
–1788
–3576
68.00 76.69 85.31 94.00 102.69 111.31 120.00
Date: 2/16/01
Profit/Loss: –26
Underlying: 102.04
Above: 21%
Below: 79%
% Move Required: +8.4%
Figure 2.8 Risk curve for buying 4 February 95 calls at 7.12.
9078
5043
1009
–3026
68.00 76.69 85.31 94.00 102.69 111.31 120.00
Date: 2/16/01
Profit/Loss: 19
Underlying: 104.93
Above: 13%
Below: 87%
% Move Required: +11.8%
Figure 2.9 Risk curve for buying 6 February 100 calls at 4.88.
More free books @ www.BingEbook.com
Table 2.4 displays the expected dollar and percentage return
for each trade based on different movements in the underlying
stock. From the returns displayed in this example we can make
the following observations:
• If you are highly confident that the stock is going to explode
sharply higher, the February 100 call offers the greatest lever-
age if your opinion turns out to be correct.
• The February 90 call is the only option (in this example) that
will not lose 100% if the stock is unchanged at expiration. In
addition, if the stock rises 15% or even 30%, the 90 call will
outperform the 95 call.
• In sum, the February 100 call offers the greatest profit poten-
tial, and the February 90 call offers the most favorable trade-
off between reward and risk.
From all the information presented on these three trades,
there is no way to state definitively that one trade is better than
the other. Just as beauty is in the eye of the beholder, the crite-
ria that make a given trade more attractive than another vary
34 The Option Trader’s Guide
Table 2.3 Break-Even Analysis
Stock Break-Even Percentage Probability of
Trade Entered Price Move Required Reaching Break-Even
Buy 3 February 90 calls at 9.88 99.88 +6.2% 27%
Buy 4 February 95 calls at 7.12 102.12 +8.4% 21%
Buy 6 February 100 calls at 4.88 104.88 +11.8% 13%
Table 2.4 Expected Returns
Stock Down Stock Down Stock Stock Up Stock Up
Trade Entered –30% –15% Unchanged +15% +30%
Buy 3 February –$2962 –$2962 –$1762 +$2467 +$6698
90 calls at 9.88 (–100%) (–100%) (–59%) (+83%) (+126%)
Buy 4 February –$2850 –$2850 –$2850 +$2390 +$6023
95 calls at 7.12 (–100%) (–100%) (–100%) (+84%) (+111%)
Buy 6 February –$2925 –$2925 –$2925 +$1935 +$10395
100 calls at 4.88 (–100%) (–100%) (–100%) (+66%) (+255%)
More free books @ www.BingEbook.com
from trader to trader. Nevertheless, regardless of which trade
you might choose, the key to success remains the same. The
trader who will succeed in the long run is the one who takes
the time to analyze the various risk-versus-reward characteris-
tics of several potential trades and then chooses the trade that
best matches his or her particular objective for that trade.
Summary
In any field of endeavor, a thorough understanding of the basics
is a prerequisite to success. If you are new to option trading, you
should take the time to review the material in this chapter thor-
oughly. Once you have a firm handle on the basics, the material
in the following chapters will flow much more easily and the
relevance of each concept will be much more obvious as you
proceed.
The Basics of Options 35
More free books @ www.BingEbook.com
More free books @ www.BingEbook.com
Chapter 3
REASONS TO TRADE OPTIONS
37
Because they trade based on the price action of some underlying
security, be it a stock, a stock index, or a futures contract,
options are referred to as derivatives. In other words, their char-
acteristics derive from the price action of the underlying secu-
rity. As a result, although the action of the options for a given
underlying security are related to the underlying, options offer
many unique opportunities that cannot be attained solely
through trading the underlying security.
Before getting into the nitty-gritty of option trading, let’s
examine the bigger picture. The first question on the table is not
“How should I trade options?” but rather “Why bother with op-
tions in the first place?” In other words, what qualities of options
are so valuable that a trader should consider using options rather
than simply sticking to stocks, bonds, futures, and mutual
funds?
Options offer a number of extremely useful advantages over
other forms of investment. At the same time, it should not be as-
sumed that you should therefore ignore traditional investments
and commit all your capital to option trading—quite the oppo-
site. Options are best used to augment your other investments.
The Three Primary Uses of Options
There are three primary uses of options. Each of these uses offer
unique benefits—and risks—that traders and investors cannot
TEAMFLY
Team-Fly
®
More free books @ www.BingEbook.com
obtain from traditional investment vehicles. The three primary
uses of options follow.
1. Leveraging an opinion on market direction. Buying an op-
tion gives a trader the ability to control 100 shares of stock or
one futures contract, usually for far less money than it would
cost to trade the underlying security outright. If a trader’s timing
is right when entering into an option trade, he or she can obtain
a much higher percentage rate of return than by simply trading
the underlying while risking fewer investment dollars. By buy-
ing a naked option a trader can potentially make the same dollar
profit, and a much greater percentage return, than he or she might
by committing the capital to buy or sell short the underlying
security itself.
2. Hedging an existing position (or generating income from a
stock portfolio). At times traders may wish to temporarily min-
imize or eliminate the downside risk associated with a position
they presently hold without completely exiting the current po-
sition altogether. This process—referred to as hedging an exist-
ing position—can be accomplished in several different ways
using options. One alternative is to buy one put option for every
100 shares of stock (or every futures contract) held. Another al-
ternative many investors engage in is covered call writing, which
reduces downside risk to a certain degree and can increase an in-
vestor’s income. Covered call writing is discussed in more detail
in Chapter 18.
3. Taking advantage of neutral situations. Taking advantage of
neutral situations is an area that is entirely unique to option
trading. If you buy a stock or a futures contract, that security
must rise in price in order for you to profit. If you sell short a
stock or sell short a futures contract, the price of that security
must fall for you to profit. With the use of options, you can enter
positions that can benefit from a security rising or falling and po-
sitions that benefit from a security remaining in a particular
price range for a certain period. Some examples of these types of
strategies are calendar spreads (see Chapter 14), straddles (see
Chapter 15), vertical spreads (see Chapter 16), and butterfly
spreads (see Chapter 19).
38 The Option Trader’s Guide
More free books @ www.BingEbook.com
Leveraging an Opinion on Market Direction
The most common use of options is to leverage the amount of
profit possible from an anticipated move by a given stock, stock
index, or futures contract. Buying a call or a put option can allow
a trader to
• Put up less money than would be needed to buy or sell short
100 shares of stock or to go long or short a futures contract
• Earn a much greater percentage return on a trade than would
result from buying or selling short 100 shares of stock or
going long or short a futures contract
To buy an option, a trader pays a premium to the option
writer. The amount paid to buy the option represents the option
buyer’s total risk on the trade. Conversely, upside potential is
unlimited. The mantra of “limited risk, unlimited profit poten-
tial” is an oft-quoted and technically accurate description. Nev-
ertheless, as discussed in Chapter 1, there are tradeoffs associated
with every potential option trade.
For the sake of example, let’s consider a trader who expects
the price of IBM stock to rise. With the stock trading at 94, the
trader can simply buy the stock or buy a call option. Because he
wants a position that is roughly equivalent to 100 shares of
stock, he may consider the following possible trades:
• Buy 100 shares of IBM at 94 a share for $9400.
• Buy 2 IBM 95 call options at 7.12 for $1425.
Table 3.1 depicts the expected dollar and percentage returns
that would be achieved depending on the movement of the un-
derlying security.
Figures 3.1 and 3.2 depict graphically the expected profit or
loss for both of these positions. Consider the tradeoffs involved
in choosing between the trades shown in Figure 3.1. In this ex-
ample, extreme moves in either direction favor the option trader.
If the stock goes up 20%, the option trader will actually experi-
ence a larger dollar gain than the stock trader despite putting up
only 15% as much capital as the stock trader. Also, if the stock
Reasons to Trade Options 39
More free books @ www.BingEbook.com