The option trader s guide to probability volatility and timing phần 7 ppsx
Bạn đang xem bản rút gọn của tài liệu. Xem và tải ngay bản đầy đủ của tài liệu tại đây (254.35 KB, 29 trang )
Managing a backspread position can be extremely subjective.
First, you have unlimited profit potential on one side and a de-
fined profit potential on the other side. Also, you must be con-
cerned about time decay, particularly, the longer the trade goes
on with the underlying drifting in a narrow range. The other con-
cern is the prospect of getting assigned on the option you write.
If the underlying moves far enough in the expected direction, the
option you wrote will eventually trade deep in the money. As
the amount of time premium narrows, the likelihood of exercise
and assignment becomes greater. For purposes of setting objec-
tive position-management rules for this trade, we will first look
at what we know for sure about this trade. The two things we
know for sure are that
1. Our profit potential on the downside is $212.
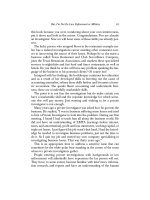
2. Our maximum risk is $2268 and can occur only if we hold
this trade until expiration. The effect of time decay can be
seen in Figure 13.8, which shows risk curves as of February
15, April 15, and June 15 (option expiration). Notice how risk
increases significantly at expiration.
160 The Option Trader’s Guide
3409
1894
379
–1137
5.68 9.00 12.31 15.69 19.00 22.31 25.69
Date: 3/16/01
Profit/Loss: 1917
Underlying: 22.34
Above: 5%
Below: 95%
% Move Required: +42.9%
Figure 13.7 Toys “R” Us backspread (3 months later if volatility is at 80, 60, or 40).
More free books @ www.BingEbook.com
Our first step is simply to decide that we will not hold this
trade until expiration. This relieves any worry about experienc-
ing the maximum potential loss. The good news regarding this
trade is that unless volatility plunges to new lows, there is al-
most no way to lose a lot of money for at least the next three
months because volatility is already low and there is a great deal
of time left until expiration. We will hold this trade for a maxi-
mum of three months.
Looking at the historical volatility for Toys “R” Us, we cal-
culate that a two-standard-deviation move for Toys “R” Us over
a 90-day period would be 5.64 points. In other words, if Toys “R”
Us falls to 10.04 or rises to 21.33 at any time during the next
three months, this would constitute a statistically significant
move for this stock. As a result, we decide to close the trade if ei-
ther of these price levels is pierced. Looking again at the risk
curves in Figure 13.4, we can see that if the stock fell to 10.04 the
trade would be about at break-even, and the stock would then
have to rally significantly to achieve a meaningful profit. We are
hoping that the Toys “R” Us price will rally. If, however, the
stock collapses later on and we have the opportunity to get out
Buy a Backspread 161
3004
1168
–668
–2504
5.68 9.00 12.31 15.69 19.00 22.31 25.69
Date: 6/15/01
Profit/Loss: –2268
Underlying: 17.51
Above: 37%
Below: 63%
% Move Required: +11.7%
Figure 13.8 Toys “R” Us as of 2/15, 4/15, and 6/15 (expiration).
More free books @ www.BingEbook.com
at about break-even, we will take the opportunity to do so. No-
tice in Figure 13.4 that if we had bought naked calls and the
stock collapsed, we would be faced with a large percentage loss.
If the stock rallies to 21.33 within the next three months, we
can anticipate a profit of $700 to $1700, depending on how soon
the rally takes place and the level of volatility at the time our
target price is reached.
Position Management
Trade exit criteria:
• If Toy “R” Us rallies to 21.33 or falls to 10.04, exit the entire
trade.
• If neither target is hit within three months, exit the entire
trade.
As you can see in Figure 13.9, Toys “R” Us shot higher in
early January, closing on January 4 above our upside target of
21.33. This trade could have been closed out on January 4 for a
quick profit of $1443 (see Table 13.2). Obviously, not every trade
will work out this well or this quickly.
Nevertheless, this example illustrates two key factors in op-
tion trading success:
1. The importance of recognizing each trade’s weak spot
2. Planning in advance to deal with the worst-case scenario
In this example, we felt that Toys “R” Us had bottomed out,
but we were not highly confident that the recent low would
hold. This is why we used the backspread strategy rather than
162 The Option Trader’s Guide
Table 13.2 Toys “R” Us Backspread
Long/Short Quantity Type Price In Last Price $ + /–
Short 5 June 12.5 calls 4.00 10.75 –$3375
Long 11 June 17.5 calls 1.62 6.00 +$4818
More free books @ www.BingEbook.com
simply buying a naked call. We also recognized that the worst
case would occur if Toys “R” Us drifted in a narrow range. To
limit our dollar risk under such circumstances, we bought op-
tions with six months left until expiration and planned to exit
them after only three months.
The purpose of this example is not to show you how easy it
is to make money trading options. The purpose is to emphasize
the benefits of intelligent position management. Too many
traders put on a trade like this and simply wait to see what hap-
pens. This is usually a mistake. It will be very beneficial to your
long-term results if you always have a plan when you enter any
trade. This includes setting criteria for deciding when to take a
loss. It is no fun to lose money in trading, but the fact remains
that cutting a loss and moving on is very often the proper move
to make. It is much easier to implement this important step if
you have planned in advance to cut your loss based on some rea-
sonable criteria rather than to react by making an emotional de-
cision to an adverse price movement after the fact.
If you already know when you enter a trade what has to hap-
pen for you to exit, the number of mistakes you make in trading
will decline significantly.
Buy a Backspread 163
2668
2465
2262
2059
1856
1653
1450
901 926 1018 1110 1206 1229 10129
Figure 13.9 Toys “R” Us rallies to upper price target.
More free books @ www.BingEbook.com
Trade Result
Upside target of 21.33 exceeded on January 4.
Profit = $1443
KEY POINT
Do not plan on holding a backspread position until expiration. Exiting the
trade before expiration guarantees that you cannot sustain the maximum
potential loss.
164 The Option Trader’s Guide
More free books @ www.BingEbook.com
Chapter 14
BUY A CALENDAR SPREAD
165
PURPOSE: To take advantage of differences in option
volatilities.
Key Factors
1. The option sold should be trading at a volatility at least 15%
higher than that of the option bought.
2. Do not use this strategy if option volatility is high (the lower
the volatility, the better).
3. No more than 45 days remain until the option sold expires.
4. You have some reason to believe the underlying will remain
within a particular range of prices.
One area of opportunity unique to option trading is that each
option for a given underlying security generally trades at a dif-
ferent implied volatility level. Sometimes the disparity between
the volatility of different options can be quite large. This situa-
tion gives alert traders the opportunity to take advantage of dis-
parities between the implied volatility levels of different options.
The idea is simply to write an option that is trading at a signifi-
cantly higher implied volatility than the option you buy.
One way to take advantage of a large disparity in volatility is
to buy an option that is trading at a given implied volatility level
and simultaneously write a different option that is trading at a
More free books @ www.BingEbook.com
much higher implied volatility. This gives you an edge because
you are buying a cheaper option and selling a more expensive op-
tion. Whenever you trade a spread, you should look for an op-
portunity to write an option trading at a higher volatility than
the option you buy. This type of opportunity is also discussed in
Chapter 13, Buy a Backspread, and Chapter 16, Sell a Vertical
Spread. Each of these strategies trade different options within
the same expiration month. Another useful way to take advan-
tage of volatility disparities is by trading a calendar spread.
A calendar spread is entered into by buying one option of a
given strike price and expiration month and simultaneously
writing an option with the same strike price but a different ex-
piration month that has less time until expiration than the op-
tion you bought. Buying a July 50 call option on a particular
stock and simultaneously selling a June 50 call option is an ex-
ample of a calendar spread.
As a rule of thumb, the time to enter a calendar spread is
when a near-term option is trading at an implied volatil-
ity that is at least 15% above the implied volatility of the
farther-out option of the same strike price.
A calendar spread is a neutral position. In other words, you
benefit from having the underlying security remain within a par-
ticular range of prices and by allowing time decay to work in
your favor. The width of this profitable range of underlying
prices is determined by the difference in the implied volatility
levels of the options used. Thus, the higher the implied volatil-
ity of the option sold relative to the implied volatility of the
option bought, the higher the probability of profit.
A calendar spread is a limited-risk position, but there are two
dangers in trading a calendar spread. First, if the underlying se-
curity advances or declines significantly, this trade can become
very unprofitable. Second, a major decline in option volatility
can put you in a position in which you have little or no chance
of making money (more on this topic later).
The less time left until expiration for the options you sell,
the better (assuming you receive enough premium to make the
166 The Option Trader’s Guide
More free books @ www.BingEbook.com
trade worth taking in the first place). In addition, by trading op-
tions with deltas between 35 and 65 for calls and from –35 to –65
for puts, you can establish a range of underlying prices above
and below the current price that can yield a profitable trade. Out-
side of these delta values you can get into a situation in which
the underlying security must make a fairly substantial move in
price to generate a profit, which can greatly reduce your proba-
bility of profit. The exception to this rule is that you can trade a
strike price that is within one strike price of the underlying se-
curity price, regardless of the deltas of the options involved.
To maximize your potential when trading calendar spreads:
• Enter a calendar spread only when the option you sell is trad-
ing at an implied volatility at least 15% above the implied
volatility of the option you purchase.
• Trade calendar spreads only when the relative volatility rank
is below 6 (on a scale of 1 to 10). The ideal situation is to
trade a security with a relative volatility rank of 1 or 2 that
also meets the other criteria. The reason for this suggested
criterion is simply that if volatility increases after you enter
a calendar spread, you stand to reap windfall profits because
the price of the longer-term option you bought will rise much
more than the short-term option you wrote.
• Sell options with no more than 45 days (and preferably fewer)
remaining until expiration.
• Trade options with delta values between 35 and 65 (calls) or
from –35 to –65 (puts), or trade options that are no more than
one strike price away from the current underlying price.
Make certain that the overall level of option volatilities for
the underlying security is relatively low before entering a calen-
dar spread. This is extremely important because a sharp decline
in volatility has the potential to wipe out any chance you have
of making money when trading a calendar spread. Remember,
you are paying more for the option you buy than you are receiv-
ing for the option you write. In terms of its effect on option
prices, a decline in volatility lowers all boats. Therefore, if
volatility falls dramatically, you have more to lose from a de-
cline in the price of the option you bought than you do to gain
Buy a Calendar Spread 167
TEAMFLY
Team-Fly
®
More free books @ www.BingEbook.com
from a decline in the price of the option you sold. As a result, in
order to put the odds as far in your favor as possible you should
focus your search for calendar spreads on stocks or futures mar-
kets with low relative volatility rankings.
In Table 14.1 and Figure 14.1 you see an ideal setup for a cal-
endar spread using options on America Online (AOL).
• The near-term at-the-money put option (the February 50 put)
is trading at an implied volatility level (62.02%) that is 17%
higher than the implied volatility (53.06%) for the same op-
tion two months out (the April 50 put).
• The overall level of option volatility for AOL is extremely
low (a relative volatility rank of 1).
168 The Option Trader’s Guide
Table 14.1 America Online Volatility Skew
Puts
FEB MAR APR JUL
25 54 89 180
Delta –16 –22 –25 –27
Bid 1.15 2.75 4.10
47.5
Asked 1.30 3.00 4.40
Imp. V. 67.75 57.34 53.09
Delta –27 –30 –32 –32
Bid 1.65 2.50 3.30 4.90
50
Asked 1.80 2.75 3.60 5.20
Imp. V. 62.02 55.65 53.06 51.00
Delta –52 –48 –46 –42
Bid 3.60 4.70 5.60 7.00
55
Asked 3.90 5.00 5.90 7.30
Imp. V. 57.15 53.68 51.70 48.24
Delta –74 –65 –59 –52
Bid 6.90 7.80 8.50 9.90
60
Asked 7.20 8.10 8.80 10.20
Imp. V. 54.61 52.13 49.58 47.61
Delta –88 –79 –71 –61
Bid 11.20 11.60 12.10 13.30
65
Asked 11.60 12.00 12.50 13.70
Imp. V. 57.16 51.06 48.91 47.74
More free books @ www.BingEbook.com
• There are only 25 days left until the February option expires.
This means that the effect of time decay will begin to work
in our favor quickly, which is ideal when writing options.
• The deltas for these options (–32 and –27) are outside the pre-
ferred –35 to –65 range, but the options are within one strike
price of the underlying price, so this trade still qualifies as a
neutral trade.
One other favorable factor to look for when considering a
calendar spread is an underlying security in a trading range. For
an example of a trading range market, look at the graph of AOL
in Figure 14.2. In this graph you can see that AOL stock traded in
a range of 31 to 62 for almost 4 months. In a properly constructed
calendar spread, you will generally not be at risk to lose a lot of
money unless the underlying security makes a significant price
movement. Focusing on securities with easily identifiable sup-
port and resistance levels above and below the current price
gives you a better chance of making money with calendar
spreads. Underlying securities with established support and re-
sistance levels are ideal candidates for calendar spreads because
the underlying security is required to stage a breakout to a new
(at least short-term) high or low for the trade to turn into a loss
Buy a Calendar Spread 169
Figure 14.1 America Online implied volatility.
24-Month Relative Volatility Rank = 1
90.00
85.30
80.60
75.90
71.20
66.50
61.80
57.10
52.40
47.70
43.00
990412 990728 991112 301 619 1004 10122
More free books @ www.BingEbook.com
of any meaningful size. Nevertheless, although support and
resistance levels are important, the difference between the
volatility of the option you buy and the option you write re-
mains the key element in selecting calendar spreads to trade. A
trading range is simply another favorable factor to look for.
As shown in Figure 14.3, using this strategy establishes a po-
sition that will generate a profit only if the underlying security
stays within a particular range of prices. If the underlying secu-
170 The Option Trader’s Guide
6226
5716
5206
4696
4186
3676
3166
927 1013 1102 1121 1211 10102 10122
Figure 14.2 America Online in a trading range.
2230
743
–743
–2230
36.84 42.50 48.19 53.81 59.50 65.19 70.81
Date: 2/16/01
Profit/Loss: 7
Underlying: 45.4
Above: 85%
Below: 15%
% Move Required: –16.1%
Figure 14.3 America Online calendar spread risk curves.
More free books @ www.BingEbook.com
rity moves outside this range, losses will occur. The width of
this profit range is determined by the size of the difference in the
implied volatility of the option bought versus that of the option
sold. This underscores the importance of having as wide a spread
as possible between the volatility levels of the option bought
versus the option sold.
NOTE
Before trading a calendar spread on a futures contract, you should make cer-
tain that both the options you are going to use trade based on the same un-
derlying futures contract month. For example, January, February, and March
T-bond options trade based on the March T-bond futures. April, May, and
June options trade based on the June futures contract. You should not trade
one option based on the June futures and another option based on the March
futures because futures contracts of different months can trade independently
of one another. This is especially true in the grain markets (e.g., Corn, Soy-
beans, Wheat) and the soft markets (e.g., Coffee, Sugar). If you trade options
based on different futures months, you run the risk of losing money on both
options if the underlying futures contracts move in opposite directions. For
example, it is not uncommon for July Soybeans to rally while November Soy-
beans decline. If you were long a November call option and short a July call
option, you could end up losing money on both sides of the trade. Do not
make the mistake of putting yourself in this potentially dangerous situation.
The graph in Figure 14.3 displays risk curves for three dates
leading up to option expiration. With AOL trading at 53.81, we
bought 10 April 50 puts at 3.60 and sold 10 February 50 puts at
1.65. The cost of this position is $1995. Our maximum profit po-
tential is approximately $2230. The amount of profit potential is
only an approximation because although we can state with cer-
tainty how much the February option will be worth at the time
of February expiration at a given underlying price, we can only
estimate the price at which the April option will be trading at
that time. This is because the volatility of that option may rise
or fall in the meantime, thus inflating or deflating the price of
our long option accordingly.
Buy a Calendar Spread 171
More free books @ www.BingEbook.com
Of key importance in viewing these risk curves (or the risk
curve for any calendar spread) is to note the break-even points.
As you can see in Figure 14.3 (assuming no change in implied
volatility levels), this trade will a show a profit at February op-
tion expiration if the price of AOL is between 45.34 and 56.64.
Based on the historic volatility of AOL stock when this trade
was entered, there is a 43% probability that the price of AOL
will be within this price range at the time of option expiration.
As always, there is no way to know in advance how this trade
will work out. All we can do is put the odds as much in our
favor as possible. To that end, with this example trade we
• Chose a market with low option volatility (a relative volatil-
ity rank of 1)
• Sold a call option with an implied volatility 17% higher than
the volatility of the option we bought
• Sold a call option with less than 45 days until expiration (25
days in this case)
In this trade we exceeded our target delta range (of –35 to –65
when trading puts), but the strike price (50) is within one strike
price of the current stock price (53.81)
The biggest risk we assume when entering this trade is that
AOL will trade outside the profit range of 45.34 to 56.64. The
key question to answer when setting position management
criteria is how to deal with this possibility. Our choices are as
follows:
• Establish some arbitrary stop-loss level.
• Simply hold the trade until near expiration and hope that the
stock is within our profit range.
• Establish some alternate exit criteria.
In this case we decided to hold the trade until expiration un-
less one of the following two criteria is met:
1. If the time premium on the February 50 put declines to 0.125
or less, we will exit the entire trade. If the stock falls and the
short February 50 put trades deep in the money, we will close
172 The Option Trader’s Guide
More free books @ www.BingEbook.com
the trade to avoid being exercised on the short puts. If the
stock rises and the amount of time premium built into the
price of the February 50 put falls to 0.125, we can either close
out the entire trade or buy back the February puts and con-
tinue to hold the long April puts in hopes that AOL stock
will fall. This would be a subjective decision, however, and
would expose us to greater risk.
2. If the trade shows an open loss in excess of $1000, we will
exit the trade. Inspecting the risk curves, we find that in
order for this loss level to be reached the stock price would
have to fall below 42 or rise above 62.50. Based on the his-
toric volatility for AOL, the probability of this happening is
only about 26%.
Position Taken
Buy 10 April 50 puts at 3.60.
Sell 10 February 50 puts at 1.65.
Approximate maximum profit $2230
Approximate maximum risk –$1994
Approximate probability of profit 43%
Current underlying price 53.81
Break-even price at expiration Above 45.34 and
below 56.64
Position Management
Stop-loss:
• If the time premium on the February 50 put declines to
0.125, exit the entire trade.
• If the trade shows an open loss greater than $1000, exit the
entire trade.
Profit-taking: As long as trade shows a profit, hold as close to ex-
piration as possible.
Buy a Calendar Spread 173
More free books @ www.BingEbook.com
As you can see in Figure 14.4, AOL stock rallied for a couple
of days after this trade was entered and then fell back below 50.
Fortunately, it did not fall far enough to cause our short option
to trade deep in the money, so we were able to let the trade ride.
At the close of the day before February expiration, the April put
could be sold at a price of 4.00, generating a profit of $400 on a
10-lot. The February 50 put could be bought back at a price of
0.75, generating a profit of $900 on a 10-lot. As a result, this
trade netted a profit of $1300 (Table 14.2).
Trade Result
174 The Option Trader’s Guide
5710
5286
4862
4438
4014
3890
3166
1113 1130 1220 10110 10130 10220 10309
Figure 14.4 America Online stays in profitable range.
Table 14.2 AOL Calendar Spread Result
Long/Short Quantity Type Price In Last Price $ + /–
Long 10 April 50 Puts 3.60 4.00 +$400
Short 10 February 50 Puts 1.65 0.75 +$900
KEY POINT
The ideal time to enter a calendar spread is when the implied volatility of the
option you sell is at least 15% higher than the implied volatility of the option
you buy.
More free books @ www.BingEbook.com
A Decline in Volatility Is Deadly to Calendar Spreads
To understand why low volatility is one of the suggested guide-
lines in selecting calendar spreads, you must understand the im-
pact that changes in volatility can have on this type of spread. In
a calendar spread you are long an option that has more time left
until expiration than the option you are short. As discussed in
Chapter 6, the more time left until expiration, the more sensitive
an option will be to changes in volatility. As a result, if volatility
rises after you enter a calendar spread, you stand to gain a wind-
fall profit because that increase in volatility will serve to inflate
the price of the option you are long far more than it will the price
of the option you have written. Conversely, if volatility falls dra-
matically after you enter a calendar spread, you stand to take un-
expected losses because this decline in volatility will serve to
deflate the price of the option you are long far more than it will
the price of the option you have written.
The graph in Figure 14.5 depicts three risk curves for the
AOL calendar spread we just discussed. Each line represents the
profit or loss we could expect from this trade as of February op-
tion expiration, depending on the level of implied option volatil-
ity at that time.
Buy a Calendar Spread 175
4693
2346
0
–2347
36.84 42.50 48.19 53.81 59.50 65.19 70.81
Figure 14.5 America Online calendar spread (volatility of 83%, 63%, or 43%).
More free books @ www.BingEbook.com
If you look again at Figure 14.1, you will see that implied
volatility for AOL options had recently ranged as low as 43% and
as high as 83%. In Figure 14.5 you can see three risk curves.
Each curve represents the expected profit or loss from our calen-
dar spread example trade, with the only difference being the level
of option volatility at the time of February option expiration.
• The upper curve depicts the profit or loss we could expect at
the time of February expiration if volatility rose back up to
its most recent high of 83%.
• The middle curve is based on a volatility of 63%.
• The lowest curve assumes that option volatility fell back to
its recent low of 43%.
Please take a moment to study these curves because they dra-
matically illustrate why volatility is so important when trading
calendar spreads.
Remember, at expiration the February call that we wrote will
have no time premium left, only intrinsic value. However, the
price of the April call option that we bought will be highly de-
pendent on the level of volatility at that time. If volatility rises
to high levels, the price of our long option will be inflated ac-
cordingly. If volatility falls to lower levels, the price of our long
option will be deflated accordingly.
It would be optimistic to assume that volatility will rise back
to its recent high of 83% after this trade was entered. Neverthe-
less, it is important to understand the effect that such a rise in
volatility would have on our example trade. If the April 50 put
traded at a volatility of 83% at the time of February expiration,
the break-even points on this trade would expand from 45.34 on
the downside and 56.64 on the upside to 39.61 on the downside
and 68.06 on the upside. As a result, the expected return is
higher at any underlying price, and the probability of profit soars
from 43% to 88%. Clearly an increase in volatility greatly en-
hances the profit potential of this trade because it serves to in-
flate the price of the option we bought.
At the other end of the spectrum, if volatility falls to 43%,
the profit potential for this trade declines sharply (as depicted by
the lowest risk curve in Figure 14.5). In addition, the range of un-
176 The Option Trader’s Guide
More free books @ www.BingEbook.com
derlying prices that will generate a profit contracts significantly.
Accordingly, as volatility declines, our probability of profit is
dramatically reduced.
In this example, if implied volatility fell from the current
level of 53% to 43%, AOL stock would have to be trading be-
tween 47.25 and 53.50 at the time of February option expiration
for this calendar spread to show a profit. This is an extremely
narrow range of profitability. A close at any price outside of this
range would result in a loss.
The purpose of this example is to illustrate the importance of
entering calendar spreads when implied volatility levels are rel-
atively low. If you enter a trade when implied volatility is low,
there is no guarantee that volatility will then rise or that it will
not fall to even lower levels. Nevertheless, if you enter a calen-
dar spread when the relative volatility rank for the underlying se-
curity is high (6 to 10), you put yourself in a very dangerous
situation. As the risk curves in Figure 14.5 clearly illustrate, a
sharp decline in volatility can leave you with almost no chance
of making a meaningful profit when trading a calendar spread!
Buy a Calendar Spread 177
TEAMFLY
Team-Fly
®
More free books @ www.BingEbook.com
More free books @ www.BingEbook.com
Chapter 15
BUY A STRADDLE
179
PURPOSE: To take advantage of low volatility or quiet
market conditions to profit from the next big price move.
Key Factors
1. You have some reason to expect a sizable price movement by
the underlying.
2. Option volatility is low.
3. Adequate time remains until expiration.
4. There is an equal opportunity to make money whether the
underlying rises or falls.
The strategy of buying a straddle involves buying a call option
and a put option simultaneously. The options can be of the same
strike price or different strike prices. Buying a call and a put with
different strike prices is called a strangle. For our purposes we
will use the terms straddle and strangle interchangeably.
On a strictly mathematical basis, buying a straddle probably
has the lowest probability of generating a profit of any strategy
covered in this book. Consider this: Whenever you buy a call or
a put option, time decay can eat away a large portion of the op-
tion premium you pay, particularly if the underlying security
fails to make the expected move within a relatively short period.
More free books @ www.BingEbook.com
When you buy both a call and a put option, this negative effect
is multiplied.
The only reason to ever consider buying a straddle is that
you expect a significant price movement by the underly-
ing security, but you are uncertain as to the direction of
the next move.
Several other important factors should be considered before
buying a straddle. If you enter a position without giving any con-
sideration to these other factors, even a significant price move-
ment by the underlying security may not be enough to generate
a profit on the trade.
The key elements to consider when selecting buy-straddle
trades are these:
• Some catalyst to make you believe that a large price move is
imminent.
• Low implied option volatility (the lower the implied volatil-
ity, the less time premium you pay).
• Adequate time, that is, allowing enough time until option
expiration for the underlying security to make a move big
enough to generate a profit.
Most traders make the mistake of not giving the underlying
security enough time to make a significant price move. Many
traders would rather buy short-term options because they cost
less than longer-term options (those with at least 60 days until
expiration) and are in fact more sensitive to underlying price
changes. Unfortunately, when it comes to buying a straddle, this
can be a costly mistake in the long run.
Generally, when you buy a straddle, the underlying security
must make a fairly significant move in one direction or the other
in order to generate enough of a gain on the profitable option to
offset the loss on the other option. If you buy a straddle using op-
tions with 30 days left until expiration, you are putting yourself
in a situation in which the underlying security must make an
immediate and substantial move for you to profit. Doing this on
a regular basis puts you on the path to trading failure.
180 The Option Trader’s Guide
More free books @ www.BingEbook.com
One useful rule of thumb in buying straddles is to buy op-
tions with a minimum of 74 days left until expiration. Why 74
days? By buying options with at least 74 days left until expira-
tion, you know that you can hold the position for a full 60 days
without getting into the last two weeks before expiration, when
time decay really accelerates. You should generally exit any
straddles before the last two weeks of trading prior to expiration
unless one of the options you are holding is deep in the money
and you feel strongly that the trend will continue in the direc-
tion of that option (up for a call, down for a put). In this case you
may get more bang for your buck by holding the deep-in-the-
money option a while longer. This is a subjective decision that
must be made on a trade-by-trade basis.
When buying a straddle, you should make the trade as neu-
tral as possible. In other words, since you are not choosing a di-
rection, you want to have an equal chance of making money
whether the underlying security price rises or falls. One way to
facilitate this is to consider the deltas for the options you buy
and try to make the trade as close to delta neutral as possible.
Whenever you buy a straddle, you are exposing yourself to
time decay not only on one position but on two. As a result, it is
extremely important that you do not buy straddles on stocks or
futures markets when the implied volatility for the options on
that security is relatively high. If you buy a straddle when option
volatility is high,
• You pay more to buy the options than you would if volatility
was low, thereby reducing your probability of profit.
• If option volatility subsequently collapses, you may have lit-
tle hope of generating a profit. This is because the amount of
time premium built into the price of your options will col-
lapse also, thus requiring the underlying security to move
even further to make up for this loss of time premium.
Conversely, buying options when implied volatility is low al-
lows you to buy cheap options. As a result, your dollar goes fur-
ther. Focusing on low-option-volatility situations also gives you
the opportunity to profit should option volatility increase after
you enter the trade. It is certainly possible that a stock or futures
contract with high implied volatility may rally or decline
Buy a Straddle 181
More free books @ www.BingEbook.com
enough to generate a profit on a long straddle. Be aware that just
because implied volatility happens to be low does not necessar-
ily mean that it will increase significantly any time soon, nor
that it cannot go even lower.
The goal in option trading is to put the odds as far in your
favor as possible each time you enter a trade. Paying a lot
of time premium on both a call option and a put option is
not consistent with this goal and should generally be
avoided.
Ideally, you should buy a straddle when the relative volatil-
ity rank for the underlying security is 1, 2, or 3 (on a scale of 1 to
10). As you can see in the graph in Figure 15.1, the relative
volatility rank for Reader’s Digest is 1. This objective measure
indicates that the options for this stock are currently cheap.
Additionally, there is no reason to ever buy a straddle if you
do not have some objective reason to believe that the underlying
security will soon make a significant price movement. As you
can see in the daily bar chart in Figure 15.2, Reader’s Digest
182 The Option Trader’s Guide
24-Month Relative Volatility Rank = 1
63.00
59.60
56.20
52.80
49.40
46.00
42.60
39.20
35.80
32.40
29.00
990302 990630 991029 301 630 1031 10301
Figure 15.1 Reader’s Digest implied volatility at a low level.
More free books @ www.BingEbook.com
stock has been trading in a fairly narrow 3-point range for three
months. A further inspection of this bar chart reveals that
Reader’s Digest has a history of trading in a narrow range and
then breaking out. Since Reader’s Digest has already spent a con-
siderable amount of time chopping back and forth within a trad-
ing range, it is not unreasonable to expect a meaningful breakout
at some point soon.
This combination of factors—low option volatility and an
extended trading range—suggest that the time may be right to
buy a straddle on Reader’s Digest.
With Reader’s Digest trading at a price of 38.88, we purchase
6 April 40 calls at a price of 2.50 and 6 April 40 puts at a price of
3.12. The total dollar risk associated with this trade is equal to
the amount of premium paid to buy the options, or $3375. The
graph in Figure 15.3 depicts risk curves for six dates leading up to
option expiration (also see Table 15.1).
The risk curve lines in the graph in Figure 15.3 clearly depict
the negative effect of time decay that will result if Reader’s Di-
gest continues to trade in a narrow range. Notice how each line
drops lower and spreads out wider as time decay eats away at the
price of both options. If Reader’s Digest fails to make a sustained
Buy a Straddle 183
4186
4029
3872
3715
3558
3401
3244
703 802 831 1003 1102 1204 10105
Figure 15.2 Reader’s Digest daily price in a trading range.
More free books @ www.BingEbook.com
price movement in one direction, either up or down, our loss be-
comes bigger and our break-even prices move out further as time
goes by.
To give ourselves as much chance as possible of a profit on
this trade,
• We bought options with 106 days (more than three full
months) left until expiration. Giving the underlying security
time to move is crucial to trading long straddles profitably.
• We made the trade delta neutral (our net delta is –6). This
gives us an equal chance of making money whether the stock
goes up or down.
If we were to hold this position until option expiration, our
break-even prices are 34.24 on the downside and 45.72 on the up-
side. If we are still holding this position at expiration and
Reader’s Digest is not outside of that range, the trade will result
in a loss. When the trade was entered, there was a 26% probabil-
ity that Reader’s Digest would be below 34.24 at expiration and
a 21% probability that it would be above 45.72 at expiration. As
a result, if we hold this trade until expiration, we have about a
184 The Option Trader’s Guide
3337
1112
–1112
–3337
28.87 32.19 35.50 38.88 42.19 45.50 48.88
Date: 4/20/01
Profit/Loss: 5
Underlying: 34.24
Above: 74%
Below: 26%
% Move Required: –12.0%
Figure 15.3 Reader’s Digest Buy-Straddle Risk Curves.
More free books @ www.BingEbook.com