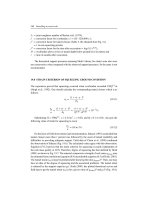
288 Tunnelling in weak rocks Jr = joint roughness number of Barton et al. (1974), f = correction potx
Bạn đang xem bản rút gọn của tài liệu. Xem và tải ngay bản đầy đủ của tài liệu tại đây (1.35 MB, 51 trang )
288 Tunnelling in weak rocks
J
r
= joint roughness number of Barton et al. (1974),
f = correction factor for overburden =1 +(H−320)/800 ≥1,
f
′
= correction factor for tunnel closure (Table 5.10) obtained from Fig. 5.4,
= 1 in non-squeezing ground,
f
′′
= correction factor for the time after excavation = log (9.5 t
0.25
),
H = overburden above crown or tunnel depth below ground level in meters and
t = time in months after excavation.
The theoretical support pressures assuming Mohr’s theory for elastic zone also were
too conservative when compared with the observed support pressures. So the same is not
recommended.
19.8 STRAIN CRITERION OF SQUEEZING GROUND CONDITION
The experience proved that squeezing occurred when overburden exceeded 350Q
1/3
m
(Singh et al., 1992). One should calculate the corresponding tunnel closure which is as
follows:
u
a
=
(1 + v) · a · P
E
d
(19.11)
u
a
a
=
(1 + v) · γ · H
E
d
=
(1 + v) · γ · H
Q
0.36
· H
0.20
× 10
−5
%
Substituting H =350Q
1/3
, γ =2.5 t/m
3
, ν =0.20, and Q =0.1 to 0.01, one gets the
following value of strain for squeezing to occur
u
a
a
= 0.8 to 1% (19.12)
On the basis of field observations and instrumentation, Sakurai (1983) concluded that
tunnel closure more than 1 percent was followed by the onset of tunnel instability and
difficulties in providing adequate support. Field data of Cheru et al. (1998) confirmed
the observation of Sakurai (Fig. 19.6). The calculated values agree with this observation.
Equation (19.12) proves that the strain criterion for squeezing is nearly independent of
the rock mass quality or UCS. Therefore, degree of squeezing has been defined by Hoek
(2001) as shown in Fig. 19.7. The uniaxial compressive strength of rock mass q
cmass
may
be estimated from correlations (equation (8.9) or preferably equation (8.5) of Hoek, 2001).
The tunnel strain (u
a
/a) may be predicted after knowing the ratio q
cmass
/P. Then, one may
have an idea of the degree of squeezing and the associated problems. The tunnel strain
is reduced by the support capacity (p
i
). Hoek (2001) has plotted theoretical curves and
field data to get the tunnel strain (u
a
/a) for a given value of q
cmass
/P and p
i
/P (Fig. 19.8).
Tunnel with Safety Problems
Tunnel with no Safety Problems
0.1
1 10 100
0.1
1
10
Uniaxial Compressive Strength, MPa
Percentage Strain (ε) = (Tunnel Closure/Tunnel Diameter)×100
Fig. 19.6 Field observations by Cheru et al. (1998) from second Freeway, Pinglin and New Tienlun
Headrace Tunnels in Taiwan.
Strain greater than 10%
Extreme squeezing problems
Strain between 5% and 10%
Very severe squeezing problems
Strain between 2.5% and 5%
Severe squeezing problems
Strain between 1% and 2.5%
Minor squeezing problems
Strain less than 1%
Few support problems
a
0.1 0.2 0.3 0.4 0.5 0.6
0
2
4
6
8
10
12
14
Rock Mass Strength/In situ Stress
Strain ε = (Tunnel Wall Displacement u
a
/ Tunnel Radius a)×100
u
a
Fig. 19.7 Tunnelling problems associated with different levels of strain (Hoek, 2001).
290 Tunnelling in weak rocks
16
0.25
0.20
0
5
11
14
9
4
13
12
10
0.10
0.05
0.15
1
7
2
3
15
6
8
0.10.0
0
5
10
0.2
15
20
25
30
0.40.3 0.5 0.6
Strength values considered reliable
Strength values estimated
Rock Mass Strength q
cmass
/ In situ Stress P
Percent Strain ε = (Tunnel Deformation/Tunnel Radius)×100
Support Pressure pi/In situ Stress P
Fig. 19.8 Influence of internal support pressure p
i
upon deformation of tunnels in weak ground
(Numbered points are from case histories) (Hoek, 2001).
Conversely, the support pressure ( p
i
) may be assessed from Fig. 19.8 for a pre-planned
value of tunnel strain for a given overburden pressure P.
Fig. 19.6 and experiences in Himalaya suggest that tunnels, in minor to severe squeez-
ing ground conditions, have been completed successfully but the construction problems
increased with increasing tunnel strain. Tunnelling through very severe squeezing ground
condition was naturally most difficult and must be avoided by changing alignment of
tunnel to reduce the overburden.
An educative case history of extreme squeezing ground conditions at Tymfristos tunnel
(11 m diameter), Greece has been illustrated by Kontogianni et al. (2004). The tunnel
closure was 20 percent. The redesigned supports also failed after 6 percent closure. The
tunnel cost increased by 10 times. The rock mass is claystone and slickensided argillaceous
schist, intensely folded and tectonized (q
c
=5–50 MPa). The overburden was only 153 m.
It should be realized that re-excavation and installation of the new supports should be
done after closure has stabilized. The latter may take several years of monitoring in very
severe squeezing ground conditions.
Tunnelling through squeezing ground condition 291
19.9 SUPPORT DESIGN
Fortunately, the steel fiber reinforced shotcrete with embedded ribs has proved to be
successful in supporting tunnels in the mild to severe squeezing ground conditions. The
Fig. 10.2 may be used for the design of support system. The following detailed strategy
has been adopted in squeezing grounds as shown in Fig. 19.9.
(i) Circular or horseshoe shaped tunnel should be planned in the squeezing ground
condition. The tunnel width should preferably be less than 6 m in severe or very
severe squeezing grounds. The excavated diameter may be 10 percent more than
the design diameter.
(ii) The excavation should be by heading and benching method in minor squeezing
ground and by multiple drift method in severe or very severe squeezing grounds.
Drill 10 m advance probe hole ahead of the tunnel face to know the rock mass
quality and drain out ground water if any.
(iii) The horizontal drill holes of 3 m length are drilled ahead of the tunnel face and the
forepoles of mild steel rods are inserted and welded to the nearest steel ribs. Then
smooth blasting is adopted with short length of blast holes (1 m) to cope up with
the low stand-up time.
(iv) A steel fiber reinforced shotcrete (SFRS) layer of 2.5 cm thickness is sprayed
immediately to prevent rock loosening. Full-column grouted bolts are installed all
around the tunnel including the bottom of tunnel.
(v) Steel ribs with struts at the bottom are erected and designed to support the forepole
umbrella and rock support pressure. The struts should be strong enough to resist
high wall support pressures in the squeezing grounds.
(vi) The additional layers of SFRS are sprayed after some delay to embed the steel ribs.
It will provide lateral stability of ribs and also create a structurally robust lining.
Drift
Umbrella of
Forepoles Welde
d
to Steel Ribs
Steel
Ribs
Rock Bolts
Invert Strut
SFRS
Fig. 19.9 Support system in severe squeezing ground condition.
292 Tunnelling in weak rocks
(vii) The SFRS should also be sprayed on the floor to cover steel struts and counter
heaving tendency of the squeezing ground by withstanding high bottom support
pressures.
(viii) The convergence of the tunnel roof and walls should be monitored and plotted
with time. In case rate of convergence/closure is not dropping with time, addi-
tional SFRS layers need to be sprayed. It is a good tunnelling practice if multiple
borehole extensometers are installed to know what is happening within the broken
zone particularly in severe or very severe squeezing ground conditions.
19.9.1 Precautions in tunnelling
In the cases of big tunnels (10 to 16 m span), the recommendations of Hoek (2001) need
to be followed. It is a very challenging task.
It may be mentioned that TBM is obviously a failure in squeezing grounds, as it is
struck inside the ground and may have to be abandoned.
In very poor ground, stand-up time is only a few hours. It is difficult to install support
system within the stand-up time. So length of blast holes may have to be decreased to
1 m to increase the stand-up time for unsupported span of 1 m. In very poor ground, it is
difficult to keep drill holes open for rock bolting. SFRS without rock bolt may work well
in such situation. Forepoling is difficult here.
For a very severe squeezing condition, rock anchors (dowels) may be added on the
tunnel face where the face is also squeezing, particularly in the big tunnels. This is in
addition to the forepole umbrella. A frequent mistake is made in using the large forepoles
for protecting the tunnel face. The steel ribs which support the forepoles are loaded
adversely, specially in big tunnels. Full face tunnelling method may be a failure due to
slow progress of tunnelling. It is good practice to install forepoles first and then make drill
holes for blasting.
It may be realized that there is no time to use lengthy software packages and for
academic advice at the tunnel face. Spot decisions have to be made on the basis of past
experiences. It is, therefore, justified that a tunnel engineer who understands the tunnel
mechanics and has experience should be made sole in charge of supporting the ground
and related works.
REFERENCES
Barla, G. (2004). Tunnelling Under Squeezing Rock Conditions. www.polito.it/ricerca/rockmech/
publcazioni/art-rivista.
Barton, N., Lien, R. and Lunde, J. (1974). Engineering classification of rock masses for the design
of tunnel support. Rock Mechanics, Springer-Verlag, 6, 189-236.
Cheru, J. C., Yu, C. W. and Shiao, F. Y. (1998). Tunnelling in squeezing ground and support
estimation. Proc. Reg. Symp. Sedimentary Rock Engineering, Taipei, 192-202.
Tunnelling through squeezing ground condition 293
Daemen, J. J. K. (1975). Tunnel Support Loading Caused by Rock Failure. PhD thesis, University
of Minnesota, Minneapolis, U.S.A.
Dube, A. K. (1979). Geomechanical Evaluation of Tunnel Stability under Failing Rock Condi-
tions in a Himalayan Tunnel. PhD thesis, Department of Civil Engineering, University of
Roorkee, India.
Dube, A. K., Singh, B. and Singh, Bhawani (1986). Study of squeezing pressure phenomenon
in tunnel Part-I and Part-II. Tunnelling and Underground Space Technology, 1(1), 35-39
(Part-I) and 41-48 (Part-II), U.S.A.
Hoek, E. (2001). Big tunnels in bad rock, The 36th Karl Terzaghi lecture. Journal of Geotechnical
and Geo-environmental Engineering, A.S.C.E., 127(9), 726-740.
Hsu, S. C., Chiang, S. S. and Lai, J. R. (2004). Failure mechanism of tunnels in weak rock with
interbedded structures, Sinorock 2004 Paper. Published in special issue of International
Journal of Rock Mech. & Mining Sciences, 41, UK.
Jethwa, J. L. (1981). Evaluation of Rock Pressures in Tunnels through Squeezing Ground in
Lower Himalayas. PhD thesis, Department of Civil Engineering, University of Roorkee,
India, 272.
Kontogianni, V., Tzortzis and Stiros, S. (2004). Deformation and failure of the tymfristos tunnel,
Greece. J. Geotechnical and Geoenvironmental Engineering, ASCE, 30(10), 1004-1013.
Labasse, H. (1949). Les Pressions de Terrians antour des Puits. Revue Universelle des Mines,
92 e Annee, 5-9, V-5, Mars, 78-88.
Sakurai, S. (1983). Displacement measurements associated with the design of underground
openings. Proc. Int. Symp. Field Measurements in Geomechanics, Zurich, 2, 1163-1178.
Shalabi, F. I. (2005). FE analysis of time-dependent behaviour of tunnelling in squeezing ground
using two different creep models. Tunnelling & Underground Space Technology, In Press.
Singh, Bhawani, Jethwa, J. L., Dube, A. K. and Singh, B. (1992). Correlation between observed
support pressure and rock mass quality. Tunnelling & Underground Space Technology,
Pergamon, 7(1), 59-74.
Singh, B. and Goel, R. K. (2002). Software for Engineering Control of Landslide and Tunnelling
Hazards. A. A. Balkema (Swets & Zeitlinger), The Netherlands, 344.
Terzaghi, K. (1946). Rock Defects and Load on Tunnel Supports, Introduction to Rock Tun-
nelling with Steel Supports, by Proctor, R. V. and White, T. L., Commercial Shearing
and Stamping Co., Youngstown, Ohio, U.S.A.
Yassaghi, A. and Salari-Rad, H. (2005). Squeezing rock conditions at an igneous contact zone
in the taloun tunnels, Tehran-Shomal freeway, Iran: A case study. Int. J. Rock Mech. &
Min. Sciences, January, 42(1), 95-108.
This Page is Intentionally Left Blank
20
Case history of tunnel in squeezing ground
∗
“The first sound and the first sign of instability is noted initially by the foreman and the
workers at the tunnel face, much before the big thud of collapse is felt in the designer’s
office.”
Source: THDC, India
20.1 INTRODUCTION
This is a case history of tackling serious tunnelling problems in squeezing ground within
the intra-thrust zone in lower Himalaya.
Stage II of the Yamuna hydroelectric scheme in the lower Himalayan region aims at
complete utilization of the power potential of the river Tons between Ichari and Khodri
(Fig. 20.1). A diversion dam at Ichari, and a 6.25 km long pressure tunnel of 7.0 m
diameter from Ichari to Chhibro with an underground powerhouse of 240 MW capac-
ity at Chhibro to utilize a drop of 120 m, are the major components of part I of the scheme.
In part II, a 5.6 km long tunnel of 7.5 m diameter has been constructed between Chhibro
and Khodri to utilize the discharge from the Chhibro powerhouse. A surface powerhouse
of 120 MW capacity is built at Khodri to utilize a drop of 64 m.
Tunnel construction in part II was started from both the Chhibro and the Khodri ends.
Near Kalawar, a village midway between these two places, a small incline (2 ×2.5 m),
called the Kalawar Inspection Gallery, was driven up to the tunnel level to observe the
behavior of rock masses in the fault zone (Fig. 20.1). Subsequently, this gallery was used
to construct the main tunnel through this zone by opening two additional headings.
20.2 REGIONAL GEOLOGY, TUNNELLING PROBLEMS AND
ALTERNATIVE LAYOUTS
The regional geology of the area was mapped by Auden (1934, 1942) followed by Mehta
(1962) and Krishnaswami (1967). Additional information was presented by Shome et al.
∗
This chapter is reproduced from the paper by Jethwa et al. (1980).
Tunnelling in Weak Rocks
B. Singh and R. K. Goel
© 2006. Elsevier Ltd
296 Tunnelling in weak rocks
F
F
Limestone, lower Krol
Slates, infra Krols
Slates
Boulder bed
Blaini
Quartzites, Nagthat
Slates, Chandpur
Limestone, Bansa
Limestone, Dhaira
Phyllites & slates - Mandhali
Quartzites Bhadraj
Sandstone, Nahan
Fault
Thrust
Drift
Drill hole
Village, colony
E
Khodri
4×30 MW
surface
powerhouse
F
K Thrust
K Thrust
K Thrust
D3
D
2
D1
D1
D1
Kg
Kg
Kg
Construction shaft
at Chhibro
F
B
C
G
A2
A2
A2
A
7-7.5 m dia finished
River Yamuna
Khadar
Kalsi
Kalsi
Kalsi
Dhaira
Dhaira
Dhaira
4×60 MW
Underground
Powerhouse
Chhibro
7.0 m dia finished 6.25 km long HRT
Ton s Riv er
Diversion Dam
at Ichari
INDEX
R.F. 1:31680
N
Alternative alignments
1 AE
2 AKgE
3 GE
4,5 ABCE
6 A2BCE
5.6 km HRT
5.6 km HRT
5.6 km HRT
Fig. 20.1 Regional geology and alternative layout of the Yamuna hydroelectric scheme, stage II,
part II.
Case history of tunnel in squeezing ground 297
(1973) based on their observations in a few drifts, drill holes and trenches near the villages
of Kalawar and Kala-Amb and some surface features in the region (Fig. 20.1).
20.2.1 Tectonic sequence
The following tectonic sequence from north to south was postulated by Auden (1934)
between Ichari and Khodri.
Simla slates
Nummulitics
Tons thrust
Nagthat quartzites
Thrust Bound Chandpur series
Jaunsar Syncline Mandhali series
Krol thrust
Nummulitics
Nahan thrust
Nahan series
20.2.2 Lithology
The Chhibro–Khodri tunnel passes through the following three formations from north to
south (Shome et al., 1973):
Mandhali series Boulder slates;
(Palaeozoic) Graphitic and quartzitic slates;
Bhadraj quartzite unit of width 5–10 m
Crushed quartzites near the Krol thrust.
Krol thrust
Subathu–Dagshai series 1–3 m thick plastic black clays along the
(Lower miocene) thrust, red and purple shales and siltstones;
Minor grey and green quartzites, 22 m thick
black clays with thin bands of quartzites;
5–10 m thick plastic black clays along the
Nahan thrust.
Nahan thrust
Nahan series Greenish-grey to grey micaceous sandstone;
(Upper tertiary) Purple siltstone;
Red, purple, grey and occasional mottled blue
concretionary clays.
298 Tunnelling in weak rocks
The regional strike of these formations is almost normal to the tunnel alignment with
the dips ranging from 20
◦
to 60
◦
in NNW to NNE direction, i.e., towards the upstream.
20.2.3 Structural features
The major structural features in this area are the two main boundary faults running from
Punjab to Assam along the foothills of the Himalaya. The faults are observed across the
river Tons near Khadar and at a few gully exposures near Kala-Amb and Kalawar. These
were further explored with the help of a few drill holes, drifts and trenches (Fig. 20.1).
The dips of the Nahan and the Krol thrusts vary from 27
◦
to 30
◦
due N10
◦
EtoN10
◦
W,
and 26
◦
due N26
◦
W, respectively. The strike is almost normal to the tunnel alignment.
20.2.4 Anticipated tunnelling problems and alternate layouts
Krishnaswami (1967) anticipated squeezing problems in the intra-thrust zone and indicated
that locked-up water was likely to be present in large quantities in the crushed Mandhali
quartzites. Subsequently, Krishnaswami and Jalote (1968) attempted either to avoid the
intra-thrust zone or to reduce the tunnel length through it, and they proposed several
layouts, as alternatives to a straight tunnel. These are shown with costs (of 1968) in
Table 20.1 and Fig. 20.1.
Table 20.1 Alternate layouts proposed for the Yamuna hydroelectric scheme, stage II, part II
(Fig. 20.1).
Increase in cost
related to layout
one in 1968
No. Details of layout (million rupees)
1. 5.5 km long and 7–7.5 m diameter straight tunnel AE, width of
intra-thrust zone = 800 m
Original
2. 5.6 km long and 7–7.5 m diameter tunnel AK
g
, E with a kink at K
g
,
near Kalawar village, width of intra-thrust zone = 230 m
nominal
3. A 51 m high earth and rockfill dam near Kalsi, a 3.0 km long and
7.0 m diameter tunnel GE, intra-thrust zone eliminated
33.8
4. A 2.4 km long and 7.0 m diameter tunnel AB, a 30 m high and
1.6 km long reservoir BC at Kalawar and a 2.8 km long and 7.0 m
diameter tunnel CE, open reservoir across intra-thrust zone
68.4
5. Replacing of open reservoir at Kalawar in layout No.4 by a 1.45 km
long open channel BC, open channel across intra-thrust zone
22.3
6. A 50 m high concrete dam at Dhaira, a 1.2 km long and 8.0 m
diameter tunnel A2B, a 1.2 km long open channel BC at Kalawar
and a 2.8 km long and 7.0 m diameter tunnel CE, open channel
across intra-thrust zone
21.1
Case history of tunnel in squeezing ground 299
Layout No.2, with a kink at Kalawar, was accepted on account of cost considerations.
Although the total length of the tunnel along this layout was increased by 0.4 km as
compared to the straight tunnel, the width of the intra-thrust zone was reduced from 800
to 230 m. Fig. 20.2a shows the original geological cross section along this alignment
(Auden, 1942).
20.2.5 Recurrence of intra-thrust zones
In addition to their presence at Kalawar, the Subathu–Dagshai red shales were again
intercepted in the tunnel between 1140 and 1300 m from the Chhibro end.
A hole drilled at 1180 m (from Chhibro) in the tunnel roof at an inclination of 60
◦
due
E established the presence of the Krol thrust over the tunnel. Finally, Jain et al. (1975)
presented an ingenious interpretation of the existing geological data and predicted the
existence of a series of tear faults (Fig. 20.2b) between Chhibro and Kalawar with a third
intra-thrust zone between 1861 and 2166 m (from Chhibro). Thus, the total width of the
intra-thrust zones was found to be 695 m against an estimated width of 230 m along the
tunnel alignment. Hence, there is a need for subsurface geological and proper rock mass
classification.
Considerable tunnelling difficulties were encountered within the intra-thrust zones.
The multi-drift method was adopted to prevent frequent rock falls at the face. A central pilot
had to be excavated by forepoling. Heavy steel arches (300 ×140 mm and 150 ×150 mm
sections with 20–25 mm thick plates welded on flanges) were erected at 0.25–0.50 m
spacing, (see Table 20.4 and Fig. 20.11) to cope with high squeezing pressures.
20.2.6 Branching of the main tunnel into three small tunnels
The project was delayed by over six years due to the very slow progress of tunnelling
(5–6 m per month) through the intra-thrust zones. At this rate, it would have taken five
and a half years to excavate the remaining 695 m (between P and Q, Fig. 20.2b) from the
two ends. At this stage, the project authorities considered it wiser to replace the main tunnel
by three smaller tunnels (5.0 m excavated diameter). Consequently, driving of the central
tunnel was started at the end of 1976 and was completed by the middle of 1979. Assuming
that the remaining two small tunnels would be excavated simultaneously during the same
length of time as the central tunnel, the saving in time would be barely six months. Thus,
branching of the main tunnel into three small tunnels is not proving to be a wise decision.
However, simultaneous excavation of the three tunnels could have been quicker.
20.2.7 Flooding of the tunnel at Kalawar
In November 1972, the perched water of the rock mass suddenly punctured the impervious
layer of argillaceous clays along the Krol thrust and rushed in from the tunnel roof at 182 m
towards Chhibro from K
g
(the point of inter-section of the Kalawar inspection gallery and
300 Tunnelling in weak rocks
200
400
600
800
1000
1200
?
?
?
?
?
?
F
F
From Under Ground
Power House at Chhibro
River Tons
Chhibro
Khodri
Kg
Kg
7.0 m - 7.5 m Dia. (Finished )
Head Race Tunnel
2590 m
Surge
Tank
??
(a)
S19° E
To be excavated
Excavated
Excavated
m
Index
Quartzites, Slates, Lime Stones
Intra-thrust zone consisting of crushed
red shales, silt stones, clays
Sand stone, siltstone, claystone
F F
Kg
Talus
Fault
Thrust
Intersection of Kalawar inspection
gallery and H. R. T.
0 200 400 600 m
SCALE
P
Q
?
From Under Ground
Power House At Chhibro
River Tons
Chhibro
Khodri
7.0 m - 7.5 m Dia
.
Head Race Tunnel
2590 m
Surge
Tank
(b)
S19°E
To be Excavated
Excavated
Excavated
m
?
?
N
.Th
N.Th
?
?
?
?
?
?
?
?
?
N.Th
1861 m
1139 m
2166
2166
m
2166
m
?
?
5600 m
200
400
600
800
1000
1200
F
FF
3
F
3
F
1
F
1
F
2
F
2
Krol
Thrust
Thrust
Nahan
Nahan
Thrust
Construction
Construction
Shaft
Shaft
Construction
Shaft
Kg
??
Construction
Construction
Shaft
Shaft
Construction
Shaft
K.Th
K.Th
K.Th
N
.Th
K.Thrust
K.Thrust
K.Thrust
1297
m
2377 m
2377 m
2377 m
?
Kg
Kg
Kg
Fig. 20.2 (a) Original geological section along the Chhibro–Khodri tunnel (Auden, 1942); (b) Revised geological section along the Chhibro–Khodri
tunnel (Jain et al., 1975).
Case history of tunnel in squeezing ground 301
Probable Trace of
Krol Thrust
Conjunctured Cavity
Observed Cavity
120 140 160 180 200 220 240 26
0
40
30
20
10
0
10
20
30
40
50
Tunnel Excavation
Face
S 19° E Khodri N 19° W Chhibro
Elevation with respect to invert, m
Distance from Kg towards Chhibro, m
Index
Water Bearing Crushed Quartzites of Mandhali Series
Black Clays Along Krol Thrust
Red Shales, Silt Stones and Minor Quartzites of Subathu Series
Non - Coring Drill Hole
Shear Zone, Upto 5 cm Gouge
Shear Zone, Upto 50 cm Gouge
Fig. 20.3 Geological features causing flooding of tunnel at Kalawar (Shome et al., 1973).
the main tunnel) and flooded the whole tunnel at Kalawar. Fig. 20.3 illustrates the detailed
geology around K
g
(Shome et al., 1973). The rate of inflow was estimated to be 1.2 cusecs
(34 liters/s), and 110,000 m
3
of water were pumped out in three months.
20.2.8 Properties of rock masses
The properties of the Subathu red shales and black clays are given in Tables 20.2a and b.
The samples were collected from the Kalawar inspection gallery and from gully exposures
near Kala-Amb.
Table 20.2a Properties of red shales and black clays.
Red shales Black clays
Particulars Kalawar Kala-Amb Kalawar Kala-Amb
General properties:
Unit weight (g/cm
3
) 2.73 – 2.64 –
Natural dry density (g/cm
3
) – 1.43−1.68 – 2.1
Density at zero moisture content (g/cm
3
) 1.86 – 1.88 –
Natural moisture content (% by wt) 8.02 9.5 11.7 18.95
Optimum moisture content (% by wt) 7.32 – 16.25 –
Grain-size distribution (%):
Gravel (above 2.0 mm) 58.40 10.50
Very coarse sand (1.0–2.0 mm) 2.50 3.50
Coarse sand (0.5–1.0 mm) 2.00 78–84 2.00 38–50
Medium sand (0.25–0.5 mm) 1.50 1.50
Fine sand (0.1–0.25 mm) 1.50 3.50
Very fine sand (0.05–0.1 mm) 0.46 21.20
Silt (0.005–0.05 mm) 12.00 9–14 26.05 23–29
Clay (below 0.005 mm) 21.64 7 31.75 27–33
Chemical analysis (%):
Silicon oxide 73.54 56.42 72.55 53.00
Iron oxide 6.93 1.40 7.32 3.14
Aluminum oxide 12.93 29.00 15.52 30.98
Calcium oxide 1.40 1.00 2.1 1.10
Magnesium oxide – 2.00 – 1.30
Sulphite – 2.30 – 3.65
Atterburg’s limits:
Liquid limit (%) 12.0–16.0 21.0–65.0 16.0–44.3 36.0–52.5
Plastic limit (%) 13.0–22.7 15.0–16.8 12.0–22.7 19.8–21.0
Plasticity index 3.0 4.3–40.0 4.0–26.6 –
Strength parameters:
Unconfined compressive strength (kg/cm
2
) 21.0 2.54 0.33 1.35
Cohesion (kg/cm
2
)
(1) at optimum moisture content 1.0 0.29 0.20–0.42 0.18
(2) at saturation – – 0.35–0.61 –
Angle of internal friction (degree)
(1) at optimum moisture content 8.54 3.0 12.0 18.0
(2) at saturation – 28.0 11.5 –
Free swell (%) – 60 – 55
Mineralogical composition of clay content:
Illite – 35 – 35
Kaolinite – 25 – 15
Chloride – 10 – 10
Continued
Case history of tunnel in squeezing ground 303
Table 20.2a—Continued
Attapulgite – 15 – 15
Montmorillonite – 0 – 5
Mica – 5 – 5
Table 20.2b Modulus of deformation of red shales and Black clays.
Modulus of deformation
(10
3
kg/cm
2
)
Location Rock type Method Horizontal Vertical
Kalawar inspection gallery Black clays Plate-bearing test 2.7 12.18
Flat jack test – 6.10
3.0 m diam. pilot tunnel Black clays Plate-bearing test 1.405 –
3.0 m diam. pilot tunnel Red shales Tiwag radial 3.7 (minimum)
Press test 35.2 (maximum)
19.5 (average)
20.3 TECTONIC ACTIVITY AND TUNNEL LINING
20.3.1 Seismic history
The project area is located in the Garhwal Lower Himalaya, adjacent to the main boundary
faults. The region is traversed by a number of secondary faults and thrusts and is known
for intense tectonic activity. The age of these activities is not known, but Auden (1934)
considered that the Krol thrust might have resulted from seismic activity spread over a
long period of time, from pre-pliocene to post-pliocene. In recent times, the only major
earthquake reported near the area was the one in 1905 with its epicenter between Kangra
and Dharamshala, while a minor region of intensity greater than isoseismal seven occurred
in Doon Valley. As a result of this earthquake, the town of Dehradun was lifted up by
0.13 m relative to Mussoorie. Other indications of recent tectonic activity are huge boulders
of quartzites (overall size 5 m) lying in the valley near the drift at Kala-Amb and elongated
spindle-shaped “boudins” of quartzite found embedded in the brecciated, pulverized and
gouged material along the Nahan thrust.
20.3.2 Measurement of tectonic movement
Agrawal and Gaur (1971) fixed a pillar on the Nahan sandstone and another pillar on
the Subathu clays across the Nahan thrust in the cross-cut from the Kalawar inspection
gallery (Fig. 20.4). They measured the relative vertical displacement between the two
pillars with the help of a water-tube tiltmeter. At the end of three years, they reported that
the rate of the vertical component of the relative displacement across the Nahan thrust
304 Tunnelling in weak rocks
Subathu
Shales and Clays
Cross Drift
TO
H. R. T.
Kalawar Gallery
N
Nahan
Sandstones
2 m
25 m 20 m 18 m 5 m 0
282 m
2 m
21
19 m
2 - Tiltmeter 1,
Nahan Thrust
Fig. 20.4 Plan of tiltmeter bases for measuring tectonic movement along the Nahan thrust
(Agrawal & Gaur, 1971).
varied from 0.4 to 1.0 mm per month. However, they conceded that a substantial portion
of this movement might be attributed to the squeezing of the clays and concluded that the
rate of the vertical component of the tectonic slip across the Nahan thrust was 0.5 mm per
month. Subsequently, Jethwa and Singh (1973) reported that the rate of radial closure in
the clays, as measured at the end of two years of excavation, was 1 mm per month in the
vertical direction.
A single-point rod-type borehole extensometer was installed across the Nahan thrust
in the Kalawar inspection gallery to measure the relative movement between the Nahan
sandstone and the Subathu red shales (Fig. 20.5). Observations, spread over six months,
did not show any movement across the Nahan thrust.
A conclusion which follows from the above measurements is that squeezing of the
clays should not have been ignored while assessing the fault slip.
20.3.3 Flexible tunnel lining
Based on the work of Agrawal and Gaur (1971), Jai Krishna et al. (1974) suggested
that the tunnel lining for the intra-thrust zone should be designed to withstand a total
vertical dislocation of 0.5 m expected during the life of the project (100 years). Further,
they considered that the total slip would be distributed uniformly along the width of the
intra-thrust zone. Based on the above assumptions, they proposed a “flexible lining” to
cope with the tectonic slip (Fig. 20.6). It consisted of circular segments of varying lengths
Case history of tunnel in squeezing ground 305
Nahan
Sandstone
Inspection
Subathu
Clay
Subathu
Shales
Nahan
Thrust
Kalawar
Gallery
Fig. 20.5 Schematic arrangement for measuring displacement across the Nahan thrust by single-
point borehole extensometer.
Nahan
Thrust
Krol
Thrust
Flow H . R . T .
D
C
BAB
C
BAB
C
3D 3D
Mixture of Bitumen and Sand
75 mm Thick Shotcrete
Wire Mesh
Steel Arches
Concrete
Rock
A– Segments of 1.5 m each
B– Segments of 3.0 m each
C– Segments of 6.0 m each
(a)
(
b
)
Fig. 20.6 Flexible tunnel lining in intra-thrust zone: (a) segmental lining; (b) flexible joint.
306 Tunnelling in weak rocks
connected together by flexible joints. Contrary to the above assumption, tectonic slip in
thick fault gouge may take place along any one plane as suggested by Brace and Byerlee
(1967) who explained the mechanism of earthquakes by the “stick-slip” phenomenon.
It cannot be proved conclusively from the above that the faults are active. Even if this
is so, it may be questionable to provide a tunnel lining on the assumption that the tectonic
slip would be uniformly distributed along the entire width of the intra-thrust zone.
20.4 TUNNEL CONSTRUCTION AND INSTRUMENTATION IN
THE INTRA-THRUST ZONE AT KALAWAR
20.4.1 Support behavior in Kalawar inspection gallery
Steel ribs for the Kalawar inspection gallery, under a maximum cover of 280 m were first
designed for Terzaghi’s (1946) rock load factor of 1.1 (B +H
t
) where B is width and H
t
is
height of the opening (Table 20.3). It corresponds to squeezing rocks at moderate depths.
The water table was observed to be below the tunnel invert but was considered to be above
the tunnel crown for the purpose of design. In order to arrest rib deformations, the rock
load factor was gradually increased to 3.5 (B + H
t
), which is equivalent to squeezing
rocks at “great depths.”
20.4.2 Tunnel construction
A pilot tunnel of 3.0 m diameter was driven on both sides from K
g
. In the Subathu red
shales, this diameter was enlarged to 9.0 m towards Chhibro from a point 36 m away from
K
g
. The tunnel was excavated by the multi-drift method. The heading was supported
by semi-circular steel arches with temporary invert struts to withstand side pressures
(Fig. 20.7). The Nahan thrust was exposed in the pilot tunnel at a distance of 40 m from
K
g
towards Khodri, whereas the Krol thrust was exposed at a distance of 190 m from K
g
towards Chhibro. The gouge in the 230 m wide intra-thrust zone consisted of soft and
plastic black clays over lengths of 16 m and 2 m along the Nahan and the Krol thrusts,
respectively, and of crushed, sheared and brecciated red shales and siltstones over a length
of 212 m between the layers of the black clays.
20.4.3 Instrumentation
The necessity for tunnel instrumentation was felt in order to evolve a rational tunnel
support system which could cope with the squeezing ground conditions encountered in
the intra-thrust zone. The instrumentation program consisted of measuring: (i) hoop load in
the steel arches by hydraulic load cells (ii) contact pressure at the rock-support interface by
contact pressure cells (iii) “tunnel closure,” defined as reduction in the size of the opening,
by an ordinary steel tape to an accuracy of ±1 mm and (iv) “borehole-extension” (defined
Table 20.3 Support details in the Kalawar inspection gallery.
Assumed rock load factor Equivalent support pressure Support details
Reach Rock (Terzaghi, 1946) (kg/cm
2
) Cross section Spacing Deformational behavior
(m) type Vertical (H
p
) Horizontal Horizontal Vertical Shape and size (mm) (mm) of supports (visual)
160 to Black 1.1 (B + H
t
) 0.3 (H
p
+H
t
) 1.30 4.48 D-shaped ribs 100 ×75 500 Intolerable rib deformations,
273 clays with inverts, buckling of invert and bulging
H
t
=2.5 m of vertical legs into the opening
B =2.0 m
273 to Black 2.1 (B + H
t
) 0.3 (H
p
+ H
t
) 2.57 0.83 As above As above 250 As above
295 clays
295 to Black As above As above 3.44 1.28 Circular ribs As above 250 Moderate rib deformation
378 clays
H
t
=B =3.0 m
378 to Red 3.5 (B + H
t
) 3.5 (B + H
t
) 5.73 5.73 As above 150 × 150 400 to Negligible rib deformation
440 shades
600
Notations: B = width of opening; H
t
= height of opening.
308 Tunnelling in weak rocks
2
1
I
Roof
I
II
II
3
1
4
Roof
4.5m
II I II
III
5
6
I - Excavation of central pilot in
heading
II - Excavation of side pilots in
heading
III - Excavation of bench
1 - Wooden sleepers
2 - Vertical Posts
3 - RCC Sleepers
4 - Temporary invert strut
5 - Steel ring support 150x150mm or
300x140mm RSJ at 40cm spacing
6 - Joint of circular support
Fig. 20.7 Sequence of excavation and support for the main tunnel through the intra-thrust zone at
Kalawar.
as the relative movement between the tunnel periphery and the interior of the rock mass)
by single-point, rod-type borehole extensometers (depth equal to the diameter of opening)
to an accuracy of ±0.02 mm.
These instruments were designed and developed at the Central Mining Research Insti-
tute, Dhanbad (India). Test sections were established with “loose backfill” and “tight
backfill” in both the red shales and the black clays. The loose backfill consisted of a 30 cm
thick layer of tunnel muck thrown manually in the hollows around steel arches. The tight
backfill consisted of systematically packed PCC (precast cement concrete) blocks.
20.4.4 Test sections
The instruments were installed at the tunnel face soon after excavation. Support density,
type of backfill and the method of tunnelling were kept unchanged on either side of
the test sections over a length equal to the tunnel diameter. Table 20.4 describes the
Table 20.4 Location of test sections, support details, type of backfill and results of instrumentation in intra-thrust zone at Kalawar.
Results of instrumentation
Distance Support details (maximum observed value)
No. of from Size and
Size Spacing Capacity Period of Pressure Closure
∗
Borehole extension
test Chhibro shape of Rock Method (mm) (mm) (kg/cm
2
) obersvation (kg/cm
2
) (cm) (cm)
section (m) opening type mining
Backfill days P
v
P
H
U
rv
U
rH
U
by
U
bR
U
bL
1. 2575 3.0 m φ Red Full face 150×150 500 6 Tight 155 3.07 1.72 4.65 2.25 3.058 1.706 2.052
pilot shales mild blast
tunnel
2. 2535 9.0 m φ As above Heading 150×150 415 10 Loose 828 ––––0.402 1.114 2.206
main and bench, with 16 mm
tunnel mild blast plate on
outer flange
3. 2530 As above As above As above As above As above As above As above 824 0.8 0.4 – – 3.772 1.250 0.332
4. 2621 3.0 m φ Black Full face As above 250 12 As above 758 3.20 2.70 13.40 14.30 – – –
pilot clays mild blast
tunnel
5. 2631 9.0 m φ As above Heading 300 ×140 275 20 Tight 719 11.50 12.20 – – 5.512 1.620 4.408
main and bench, with 20 mm
tunnel mild blast plates on
both flanges
Notations: φ = Diameter; P
v
= Support pressure at roof; P
H
= Support pressure at sides; U
rv
= Radial tunnel closure in vertical direction; U
rH
= Radial tunnel closure in horizontal
direction; U
by
= Borehole extension at roof; U
bR
= Borehole extension at right wall; U
bL
= Borehole extension at left wall; [* Borehole extension is defined as relative displacement
between two points – one located on the tunnel periphery and the other located at a depth equal to tunnel diameter].
310 Tunnelling in weak rocks
P, B
P
L,B
B
L,C,B
L,C
?
?
?
?
?
?
?
?
?
?
?
?
?
1
6
Test Section
B Bore Hole Extension
L Hoop Load in Ribs
C Tunnel Closure
P Contact pressure between
rock and rib
Intersection Of Kalawar Inspection Gallery
and H. R. T
Thrust
Crushed Quartzites, Slates, Lime Stones
Crushed, Brecciated, Sheared Red Shales, Silt Stone
Soft, Plastic Black Clays
Sandstone, Silt Stone, Clay Stone
Kg
Index
40 m200
Scale
Head Race Tunnel
Gallery
Inspection
3.0 m Dia. Kalawar
N 19 W
Thrust
Krol
9.0 m Diam. (Excavated)
2590 m
Thrust
Nahan
Kg
From Chhibro
6
3
2
1
4
To Khodri
5
Fig. 20.8 Locations of test sections and details of instrumentation in the intra-thrust zone at
Kalawar.
30
20
10
2400250026002700
Distance From Chhibro End, m
Support capacity,
kg/cm
2
Kg
Fig. 20.9 Support density in the intra-thrust zone at Kalawar.
locations of test sections, the size and shape of the opening, details of steel arches, type of
backfill and results of instrumentation. Test section 5 was set up in the black clays (near
the Nahan thrust) when the 3.0 m diameter pilot tunnel was widened to 9.0 m diameter.
Fig. 20.8 shows the locations of test sections and Fig. 20.9 shows the density of supports
provided in this zone. Typical observations of support pressure and radial tunnel closure,
and borehole extension are shown in Fig. 20.10.
20.4.5 Design of supports
Tight backfill was used to minimize the loosening of the rock mass above the tunnel crown
in order to minimize the risk of flooding (although the loose backfill relieved the rock
load). Hence higher support pressures were assumed; for example, 6.0 kg/cm
2
(0.6 MPa)
in the red shales and 20–22 kg/cm
2
(2.0 to 2.2 MPa) in the black clays against observed
support pressure of 3.07 and 12.2 kg/cm
2
(0.3 to 1.22 MPa), respectively (Fig. 20.10, a
and f). The support pressure was increased gradually from 6.0 kg/cm
2
(0.6 MPa) in the
middle portion of the intra-thrust zone to 22 kg/cm
2
(2.2 MPa) in the black clays along the
Case history of tunnel in squeezing ground 311
(a)
(b)
(c)
Left
Right
Vertical
Horizontal
Vertical
Horizontal
Vertical
4
3
2
1
0
5
3
4
2
1
0
2
1
0
Radial tunnel
closure, cm
Radial tunnel
closure, cm
Support pressure,
kg/cm
2
0 40 80 120 160
Time after excavation, days
0 200 400 600 800
0
4
8
12
0
2
4
6
0
2
4
Horizontal
Vertical
Horizontal
(d)
Vertical
Horizontal
(e)
Vertical
(f)
Time after excavation, days
Support pressure,
kg/cm
2
Radial tunnel
closure, cm
Support pressure,
kg/cm
2
(a) & (b) Red shales at Kalawar, Test section 1
(c) Red shales at Kalawar (closure at 3m),
Test section 1
(d) & (e) Black clays at Kalawar, Test section 4
(f) Black clays at Kalawar, Test section 5
Fig. 20.10 Monitoring of support pressure and radial tunnel closure in red shales and black clays
in different instrumentation test sections at Kalawar.
thrusts (Fig. 20.9). The support density was reduced gradually to 6.0 kg/cm
2
(0.6 MPa) on
either side of the intra-thrust zone. Subsequent embedment of these supports in concrete
has not shown any sign of distress.
20.5 TUNNEL CONSTRUCTION AND INSTRUMENTATION IN
INTRA-THRUST ZONE AT CHHIBRO
20.5.1 Tunnel construction
Local geology and construction details of the tunnel through this zone are shown in
Fig. 20.11. In the beginning, the unexpected exposure of the red shales at 1139 m while
tunnelling from Chhibro was considered to be a local occurrence and the support den-
sity was kept unchanged. With continuation of the red shales, it was realized that a
second intra-thrust zone had been intersected. The support pressure beyond 1185 m was
312 Tunnelling in weak rocks
11.3
11.3
0.6
0.6
Excessive
Precast Concrete Blocks
1.0 1.5 3.0 6.0 12.8 13.0 17.0 14.5
12.7
11.3
1.5 1.0 0.5 0.35 0.3 0.3 0.3 0.35
3.4
0.6
1112 3 4 5 6
6
6
6
9.0 m Dia. Half Ring
Mild Blast and Pavement Breakers
Heading Only
4 - 300 mm x 140 mm with 250 mm x 20 mm
Plate welded on outer flange
3 - 300 mm x 140 mm
2 - 250 mm x 125 mm
Block Concrete
9.0 m Dia. Full Ring
Mild Blast
F
1
Full Face
1139 m
Heading and
Bench
F
1
6 - 150 mm x 150 mm with 250 mm x 25 mm plate
welded on outer flange and 125 mm x 25 mm plate
welded on inner flange
5 - 150 mm x 150 mm with 250 mm x 25 mm plate
welded on outer flange
F
3
1297 m
F
3
Distance
from Chhibro
Red shales
and siltstone
To Khodri
Mandhali quartzites
and slates
Driving
Breaking
Supports
Shape and Size
Cross Section*
Spacing, mm
Back Fill
Support
Deformation
Mandhali quartzites
and slates
1312m
1304
1296
1277
1243
1220
1185
1175
1148
1135
Capacity, kg/cm
2
Minor
*1 - 150 mm x 150 mm
3.8
0.5
Fig. 20.11 Geological plan and construction details of head race tunnel through intra-thrust zone at Chhibro.