APPLICATIONS OF MATLAB IN SCIENCE AND ENGINEERING - PART 2 docx
Bạn đang xem bản rút gọn của tài liệu. Xem và tải ngay bản đầy đủ của tài liệu tại đây (10.93 MB, 49 trang )
Advanced Topics in Environmental Health and Air Pollution Case Studies
234
9. Conclusion
In this chapter the air pollution monitoring data in the Moscow region have been partly
examined. The temporal variation of the gaseous species concentrations were analyzed
including the diurnal and annual cycle of abovementioned concentrations. Statistical
characteristic of the concentration variations for carbon monoxide, nitrogen oxides, ozone,
methane and non – methane hydrocarbons has been calculated.
The aerosol mass concentration variations in Moscow region are discussed. The air pollution
investigation results in the urban boundary layer are presented. The gaseous species and
aerosol variability in smoky atmosphere is analyzed. It is shown that the aerosol mass
concentration and carbon monoxide concentration in the smoke screening period were
extremely large. The adverse weather conditions and the heavy air pollution influence on
the population health are briefly discussed. It should be noted that the uncontrolled
instrumental errors were possible in the smoky atmosphere.
10. Acknowledgment
In the work, the ecological monitoring data performed by State Environmental Institution
Mosecomonitoring on the network of automated stations of ambient air quality control were
used.
The study was supported by RFBR (project 11 – 05 – 01144).
Authors thank E. Baikova and A. Kolesnikova for the participation in the measurement data
processing.
11. References
Belan, B. (2009). Tropospheric Ozone. 6. Components of Main Cycles. Atmos. Ocean. Opt.
Vol. 22, No. 4. (April 2009), pp. 358 – 370, ISSN 1024 – 8560
Belikov, I.; Brennikmeijer, K.; Elansky, N. & Ral'ko, A. (2006). Methane, Carbon Monoxide,
and Carbon Dioxide Concentrations Measured in the Atmospheric Surface Layer
over Continental Russia in the TROICA Experiments. Izv. Atmos. Ocean. Phys. Vol.
42, No. 1, pp. 46 – 59, ISSN 0001 – 4338.
Bendat, J. & Piersol, A. (1986). Random Data. Analysis and Measurement Procedures, Wiley,
ISBN 0-471-04000-2, New York, USA
Grechko, E.; Gorchakov, G.; Dzhola, A.; Emilenko, A.; Elokhov, A.; Isakov, A.; Rakitin, V;
Sviridenkov, M.; Fokeeva, E.; Teterina, N.; Artamonova, M. & Maksimenkov, L.
(2010). Air pollution measurement results in the fire periods (Moscow region, July –
August 2010). Preliminary analysis of the fire influence on the population health,
Proceedings of Conference Air basin Moscow city state in extreme weather conditions in
summer 2010, pp. 88 -90, Moscow, Russia, November 25, 2010
Gorchakov, G.; Anikin, P.; Voloch, A.; Emilenko, A.; Isakov, A.; Kopeikin, V.; Ponomareva,
T.; Semoutnikova, E.; Sviridenkov, M. & Shukurov, K. (2003). Study of the
Composition of the Atmospheric Smoke Screen over the Moscow Region, Doklady
Earth Sciences, Vol. 390, Part. 2, (May 2003), pp. 562 – 565, ISSN 1028 – 334X.
Gorchakov, G.; Anikin, P.; Voloch, A.; Emilenko, A.; Isakov, A.; Kopeikin, V.; Ponomareva,
T.; Semoutnikova, E.; Sviridenkov, M. & Shukurov, K. (2004). Studies of the
Air Pollution in Moscow Megacity
235
Smoked Atmosphere Composition over Moscow during Turf Fires in the Summer –
Fall Season of 2002, Izv., Atmos. Ocean. Phys., Vol. 40, No 1, (January 2004), pp. 323 –
336, ISSN 0001 – 4338
Gorchakov, G.; Semoutnikova, E.; Zotkin, E.; Karpov, A.; Lezina, E. & Ul'yanenko, A.
(2006). Variations in Gaseous Pollutants in the Air Basin of Moscow, Izv., Atmos.
Ocean. Phys. Vol. 42, No. 2, (March 2006), pp. 156 – 170, ISSN 0001 – 4338
Gorchakov, G.; Semoutnikova, E.; & Anoshin, B. (2007). Statistical Analysis of the Mass
Concentration Variations of the Coarse Aerosol in Moscow. Atmos. Ocean. Opt.,
Vol 20, No. 6, (June 2007), pp. 461 – 464, ISSN 1024 – 8560
Gorchakov, G.; Semoutnikova, E.; Anoshin, B.; Karpov, A.; & Kolesnikova, A. (2009a).
Hydrocarbons in an Urban Atmosphere, Izv., Atmos. Ocean. Phys., Vol. 45, No. 3,
(May 2009), pp. 314 – 323, ISSN 0001 – 4338
Gorchakov, G.; Semoutnikova, E.; Glyadkov, P.; Karpov,A.; Kolesnikova, A.; & Lezina, E.
(2009b). Vertical Profiles of Concentrations of Carbon Monoxide and Nitrogen
Oxides in the Urban Atmospheric Boundary Layer, Atmos. Ocean. Opt., Vol. 22, No.
6, (June 2009), pp. 617 – 625, ISSN 1024 – 8560
Gorchakov, G.; Semoutnikova, E.; Anoshin, B.; Karpov, A. & Kolesnikova, A. (2010a).
Statistical Prediction of the Urban Atmosphere Contamination. 1. Statistical
Regularities of Interdiurnal Variability of the Carbon Monoxide and Nitrogen
Oxides Concentrations, Atmos. Ocean. Opt., Vol. 23, No. 4, (April 2010), pp. 309 –
316, ISSN 1024 – 8560
Gorchakov, G.; Semoutnikova, E.; Anoshin, B.; Karpov, A. & Kolesnikova, A. (2010b).
Statistical Prediction of the Urban Atmosphere Contamination. 2. Forecasting
Method of the Interdiurnal and Intradiurnal Concentration Variability of the
Carbon Monoxide and Nitrogen Oxides, Atmos. Ocean. Opt., Vol. 23, No. 5, (May
2010), pp. 396 – 403, ISSN 1024 – 8560
Gorchakov, G.; Semoutnikova, E.; Karpov, A.; Kolesnikova, A.; Baykova, E. & Zadorojnaya,
O. (2010c). Air Pollution Week-Long Cycle in Moscow: of Refinement Quantitative
Parameters and Statistical Forecasting of Impurity Concentration, Atmos. Ocean.
Opt., Vol. 23, No. 9, (September 2010), pp. 784 – 792, ISSN 1024 – 8560
Gorchakov, G.; Kopeikin, V.; Sviridenkov, M.; Semoutnikova, E.; Chubarova, N.; Emilenko,
A.; Isakov, A.; Karpov, A. & Lezina, E. (2010d). Optical and microphysical
properties of the aerosol in the smoky atmosphere of Moscow region, Proceedings of
Conference Air basin Moscow city state in extreme weather conditions in summer 2010,
pp. 40 -41, Moscow, Russia, November 25, 2010
Gorchakov, G.; Sviridenkov, M.; Semoutnikova, E.; Chubarova, N.; Holben, B.; Smirnov, A.;
Emilenko, A.; Isakov, A.; Kopeikin, V.; Karpov, A.; Lezina, E. & Zadorozhnaya, O.
(2011) Optical and Microphysical Parameters of the Aerosol in the Smoky
Atmosphere of the Moscow Region in 2010, Doklady Earth Sciences, Vol. 437, Part 2,
(April 2011), pp. 513 – 517, ISSN 1028 – 334X
Elansky, N.; Lokoshenko, M.; Belikov, I.; Skorohod, A. & Schumsky, R. (2007). Variability of
Trace Gaseous in the Atmospheric surface Layer from observations in the City of
Moscow. Izv., Atmos. Ocean. Phys., Vol. 43, No. 2 (March 2007), pp. 219 – 321, ISSN
0001 – 4338
Advanced Topics in Environmental Health and Air Pollution Case Studies
236
Kallistratova, M.; Kramer, V.; Kuznetsov, D.; Kulichkov, S.; Kuznnetsova, I. & Ushkov, V.
(2010). Wind field and turbulence over Moscow in Summer 2010, Proceedings of
Conference Air basin Moscow city state in extreme weather conditions in summer 2010 ,
pp. 26 – 28, Moscow, Russia, November 25, 2010
Revich, B. (2010). Hot summer 2010 and population mortality of European part of Russia,
Proceedings of Conference Air basin Moscow city state in extreme weather conditions in
summer 2010, pp.73 – 78, Moscow, Russia, November 25, 2010
12
Impact of Urban Air Pollution on Acute
Upper Respiratory Tract Infections
Marcos Abdo Arbex
1,3,4
, Silvia Leticia Santiago
3
,
Elisangela Providello Moyses
3
, Luiz Alberto Pereira
1,2
,
Paulo Hilário Saldiva
1
and Alfésio Luís Ferreira Braga
1,2
1
Environmental Epidemiology Study Group,
Laboratory of Experimental Air Pollution, Pathology Department,
University of São Paulo Faculty of Medical Science,
2
Environmental Exposure and Risk Assessment Group,
Collective Health Post-graduation Program,
Catholic University of Santos
3
Internal Medicine Post-graduation Program,
Federal University of São Paulo Medical School,
4
Pulmonology Division, Internal Medicine Department,
Araraquara University Center Medical School, Araraquara
Brazil
1. Introduction
Epidemiological studies have shown consistent acute adverse health effects of ambient air
pollution and in particular, traffic related pollution on the respiratory health system
Outcomes with different degrees of severity, from sub-clinical lung function changes to
respiratory and cardiovascular symptoms, changes in the use of respiratory and
cardiovascular medication, impaired activities (e.g., school and work absenteeism),
exacerbation of pre-existing diseases such as asthma and chronic obstructive pulmonary
disease (COPD), primary care and/or emergency room visits, hospitalizations and mortality
have been investigated. Children, the elderly and those with previous cardiorespiratory
disease are the most susceptible groups (American Thoracic Society, 2000; Brunekreef &
Holgate, 2002; Berstein et al., 2004; Gouveia & Maisonet, 2006; Ko & Huy, 2010; Perez et al.,
2010).
In terms of adverse health effects caused by air pollutants, the more severe the clinical
manifestation, the less frequent its occurrence. Many people that have been exposed to air
pollutants can have sub-clinical effects such as temporary deficits in lung function or
pulmonary inflammation while the prevalence of mortality occurs only in a few (Gouveia &
Maisonet, 2006). Acute Respiratory Infections (ARIs) is the most frequent and
prominent among the respiratory illnesses that affect children and adults due to the
morbidity and mortality associated with this illness. ARIs may be classified into upper
(URTIs) and lower (LRTIs) respiratory infections, depending on the affected organs (noses,
sinuses, middle ear, larynx, and pharynx in the URTIs and trachea, bronchi, and lungs in the
LRTIs) (Bellos et al., 2010).
Advanced Topics in Environmental Health and Air Pollution Case Studies
238
URTIs are generally mild in severity and most often are caused by viruses and sometimes,
as in some cases of sinusitis and acute otitis media, with a secondary bacterial infection.
Usually more severe than URTis, LRTIs episodes occur in children under 5 , the elderly and
the immunocompromised individuals (e.g. HIV-infected). From the estimated 4.2 million of
LRTIs annual deaths around the world 1.8 million (43%) occur in children less than 5.
Furthermore, these two groups of ARIs are not mutually exclusive. These clinical conditions
frequently coexist during the same episode of respiratory infection and besides, URTIs
could precede and lead to LRTIs and exacerbation of pre-existing chronic respiratory
diseases. (Chauhan et al., 2005; Bellos et al., 2010; Shusterman, 2011)
The nose and the upper airway, play a sentinel role in the respiratory system. Inspired
particles of different aerodynamic sizes tend
to impact and interact with the upper airway
mucosa.
Studies have shown that PM
10
can induce alterations in cells of nasal mucosa
promoting inflammatory responses (Brunekreef & Forsberg, 2005). Once trapped in nasal
mucous, these particles are
transported to the nasopharynx via mucociliary system, being
later either swallowed or expectorated. Gaseous/vapor–phase air pollutants can also be
removed from inspired air, depending on their water solubility and chemical reactivity
(Shusterman, 2011).
Despite growing concerns of ambient air pollution and the burden of URTIs, particularly in
major urban centers, research on the effects of pollutants on upper respiratory conditions
are relatively sparse. Epidemological studies that have been conducted mainly in children
and adolescents, showed in general, effects of pollutants but without evaluating the real
impact on different age groups (Jaakkola et al., 1991; von Mutius et al., 1995; Martins et al.,
2001; Hajat et al., 2002; Peel et al., 2005; Wong et al., 2006; Larrieu et al., 2009).
In São Paulo, one of the world’s most densely populated cities (11.2 million inhabitants), the
main source of air pollution is lightweight cars that run on a petrol–ethanol mixture,
resulting in the emission of pollutants with a single toxic component. Emergency
department (ED) visits related to respiratory disease have been accepted as a sensitive
outcome of the short-term effects of air pollution (Peel et al., 2005)
The aim of this study was to estimate the impact of daily air pollution variability on URTIs
exacerbation rates, measured via records of daily ED visits, stratifying the analyses by age
groups.
2. Methods
We conducted an ecological time-series study. Daily records of UTRIs emergency
department (ED) visits for patients were obtained from São Paulo Hospital (SPH), an
affiliate of the São Paulo Federal University, from 1 February 2001 to 31 December 2003. The
UTRIs cases were defined based on criteria listed in the International Classification of
Diseases (ICD) 10th revision and took into consideration the primary diagnosis in each ED
visit record. Patients with acute nasopharingytis (common cold) (J00), acute sinusitis (J01),
acute pharyngitis (J02), acute tonsillitis (J03), acute laryngitis and tracheitis (J04), acute
obstructive laryngitis [croup] and epiglottitis (J05), acute upper respiratory infections of
multiple and unspecified sites (J06) were included in the study. The SPH is an accredited
teaching hospital and its ED treats approximately 50 000 patients per year. It has, therefore,
been used as a sentinel health service centre for epidemiological studies that aims to
evaluate the relationship between air pollution and respiratory morbidity.
Impact of Urban Air Pollution on Acute Upper Respiratory Tract Infections
239
Daily records of particulate matter with an aerodynamic profile ≤10 μm (PM
10
), carbon
monoxide (CO), sulphur dioxide (SO
2)
, ozone (O
3
) and nitrogen dioxide (NO
2
) were obtained
for the entire analysis period from the São Paulo State Environmental Agency. Thirteen
monitoring stations are distributed throughout the city. For each measured pollutant, the
average value among stations was adopted as an estimate of city-wide exposure rates. The
measurement adopted for CO (non-dispersive infrared) showed the highest 8 h moving
average at five stations. For NO
2
(chemiluminescence) and O
3
(ultraviolet), the highest hourly
average was measured at four stations. The highest hourly average over a 24 h period for PM
10
(beta radiation) was measured at 12 stations and at 13 stations for SO
2
(pulse fluorescence—
ultraviolet); 24 h averages were adopted. Small volumes of missing data were replaced by
centred moving averages. All pollutants were measured from 00:01 to 00:00. Daily minimum
temperatures and daily means of relative air humidity were obtained from the Institute of
Astronomy and Geophysics at the University of São Paulo.
The correlations between pollutants and weather variables were estimated using Pearson or
Spearman correlation coefficients. The daily number of URTI ER visits was the dependent
variable. The independent variables were the daily mean levels of each pollutant (PM
10
, SO
2
,
CO, NO
2
and O
3
). We also controlled for short-term (ie, days of week) and for long-term (ie,
seasonable) and daily climate conditions (minimum temperature and humidity). Counts of
daily URTIs ER visits were modeled, for the entire period, using generalized linear Poisson
regressions (McCullag & Nelder, 1989). Analysis was stratified by total UTRIs ED visits and
by age (younger than 13, between 13-19, 30-39, 40-65 and older than 65). A Poisson
regression model was adopted because ED visits are countable events that exhibit a Poisson
distribution. We used natural cubic splines (Green & Silverman, 1994) to control for season.
Splines were used to account for the non-linear dependence of ED visits on that covariate
and to subtract the basic seasonal patterns (and long-term trends) from the data. We used 12
degrees of freedom to smooth the time trend. The number of degrees of freedom for the
natural spline of the time trend was selected to minimize the autocorrelation between the
residuals and the Akaike Information Criterion (Akaike, 1973). After adjusting for the time
trend, no remaining serial correlation was found in the residuals, making the use of
autoregressive terms unnecessary.
Indicators for day of the week were included in order to control for short-term trends.
Respiratory diseases present a nearly linear relationship with weather. Linear terms for
temperature and relative humidity were therefore adopted. Effects of minimum
temperature were more relevant from lag 0 to lag 2. Hence, we adopted a 3-day moving
average for the minimum temperature. Relative humidity exhibited a short-duration and
small-magnitude effect on URTIs ED visits. We adopted a 2-day moving average for relative
humidity. To reduce sensitivity to outliers in the dependent variable, we used robust
regression (M-estimation).
The lag structures between air pollution and health were analysed using different
approaches and time lags. In this study, we tested the lag from the same day to 6 days
before the ED visit using a third-degree polynomial distributed lag model (Green &
Silverman, 1994). Although this imposes constraints, it also allows for sufficient flexibility to
estimate a biologically plausible lag structure that controls for better multicollinearity than
an unconstrained lag model. The standard errors of the estimates for each day were adjusted
for overdispersion.
Advanced Topics in Environmental Health and Air Pollution Case Studies
240
Effects of air pollutants were expressed as a percentage increase and as 95% confidence
intervals (95% CIs) in URTI ED visits. This was due to increases in pollutant concentrations
of a magnitude equal to that of the interquartile range (ie, the variation between the 75%
higher and the 25% lower daily concentrations). All analyses were performed using the S-
Plus 2000 statistical package for Windows.
3. Results
During the study period, 177,325 visits occurred in the emergency unit of São Paulo
Hospital and 137,530 (72%) were due to upper respiratory tract infections.
In terms of age groups, emergency visits of children and adolescents younger than 13 years
of age were the most frequent, followed by the groups 40 to 65 years, 30 to 39 years, older
than 64 years and adolescents from 13 to 19 years old.
Table 1 presents statistical analyses of the main variables adopted in the study.
Variables Mean SD* Minimum Maximum Percentage
25 50 75
Acute Upper Respiratory
Tract Infections
53.55 23.42 7.00 150.00 37.00 52.00 68.00
P
OLLUTANTS
PM
10
(μg/m
3
)
48.71 21.87 9.62 168.98 32.29 43.88 60.55
SO
2
(μg/m
3
)
14.00 6.15 2.14 42.87 9.56 13.18 17.37
NO
2
(μg/m
3
)
120.34 49.86 30.86 390.78 81.86 113.82 150.17
CO (ppm)
2.71 1.23 0.73 12.09 1.91 2.53 3.16
O
3
(μg/m
3
)
95.74 44.24 14.52 282.03 63.93 88.62 119.68
WEATHER
Temperature (°C)
†
15.50 3.37 3.70 21.80 13.10 15.80 18.20
Humidity (%) §
79.17 8.43 45.54 96.60 74.50 80.00 85.00
*standard deviation;
†
minimum temperature;
§
relative humidity.
Table 1. Descriptive analyses of daily acute upper respiratory tract infections emergency
room visits, air pollutants concentrations, and weather variables along study period.
Surpassing of daily air quality standards was rare among primary pollutants (one day for
PM
10
, two days for NO
2
, and three days for CO). However, for ozone, the one hour moving
average standard was surpassed 52 times along the period.
Low temperature is rare in São Paulo as observed in the studied period. In terms of relative
humidity, it was not observed any daily record below 40%.
We explored air pollutants effects on daily number of upper respiratory tract infections ER
visits using pollutant-specific models. Figure 1 presents the effects of increases in PM
10
daily
levels on the outcome for the entire group of patients.
Impact of Urban Air Pollution on Acute Upper Respiratory Tract Infections
241
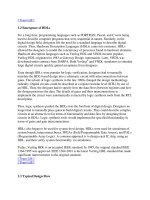
Fig. 1. Percentage increases and 95% confidence intervals on daily upper respiratory tract
infections ER visits due to interquartile range increases in PM10 daily concentrations (28.26
g/m3).
An interquartile range increase in PM
10
concentration (28.26 g/m3) led to increases in URTI
ER visits. The effect was acute, starting at the same day of exposure (lag0) and remaining for
two consecutive days. After that, there was a smooth decline of the effect magnitude until
the sixtieth day after the exposure. It was observed a three-day cumulative effect (from lag0
to lag2) of 8.9% (95% CI: 5.7-12.0). When this analysis was stratified by age group it was
observed two patterns of lag structure (Figure 2).
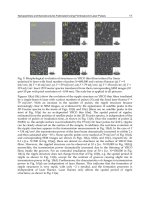
The youngest group presented a pattern of effect that was different from the others.
Interquartile range increase in PM
10
(28.26 g/m3) was associated to an acute effect, starting
at the same day of exposure and remaining for three consecutive days. As the most
prevalent age group, its effect pattern was determinant for the effect pattern observed for
the entire group. The other age groups presented similar lag structures, with acute effects
only at the same day of exposure without lagged effects. The four-day cumulative effect
observed for the youngest group reached 13.0% (95% CI: 8.3-17.8) increase in URTI ER visits.
In the group of people from 45 to 65 years old it was not observed statistically significant
effects, although the pattern of the lag structure seems to be similar to those observed for
adolescents, adults, and elderly.
Only CO presented a lagged effect (lag 2,3,4) on the outcome for the elderly group.
Remaining gaseous pollutants presented similar patterns of acute effects (in the same day of
exposure). When the analyses where stratified by age groups the pattern of effect remained
the same as observed for the entire group, differently from that observed for PM10 effects.
Also, in terms of age groups, it was impossible to define an age-dependent pattern of
susceptibility for gaseous pollutants.
Advanced Topics in Environmental Health and Air Pollution Case Studies
242
Fig. 2. Percentage increases and 95% confidence intervals on daily upper respiratory tract
infections ER visits due to interquartile range increases in PM
10
daily concentrations (28.26
g/m3) according to different age groups (younger than 13 years, from 13 to 19 years, from
30 to 39 years, and older than 65 years).
Table 2 presents the estimates of effects and lag structures for gaseous pollutants and URTI
ER visits.
Days
URTI ER Visits Percenta
g
e Increase
(
95% Confidence Intervals
)
CO
(1.25 ppm)
NO
2
(68.30
g
/m3)
O
3
(55.76
g
/m3)
SO
2
(7.81
g
/m3)
La
g
0 0.8
(
-0.6;2.2
)
4.3
(
2.2;6.4
)
3.4
(
1.2;5.6
)
0.5
(
0.2;0.7
)
La
g
1 0,2
(
-1.1;1.5
)
0.5
(
-1.6;2.6
)
-0.3
(
-2.3;1.7
)
-1.1
(
-3.1;1.0
)
La
g
2 1,5
(
0,2;2,8
)
0.2
(
-1.9;2.2
)
-0.2
(
-2.0;1.7
)
1.5
(
-0.4;3.3
)
La
g
3 0,6
(
-0.7;1.9
)
-0.2
(
-2.2;1.8
)
0.5
(
-1.3;2.3
)
-0.3
(
-2.2;1.6
)
La
g
4 -0.1
(
-1.4;1.3
)
-0.5
(
-2.5;1.5
)
0.6
(
-1.2;2.4
)
0.0
(
-1.8;1.8
)
La
g
5 -0.1
(
-1.4;1.2
)
0.3
(
-1.8;2.3
)
1.3
(
-0.5;3.0
)
0.1
(
-1.7;1.9
)
La
g
6 0.1
(
-1.2;1.4
)
0.7
(
-1.3;2.7
)
0.1
(
-1.7;1.8
)
0.7
(
-1.2;2.5
)
Table 2. Percentage increases and 95% confidence intervals on daily upper respiratory tract
infections ER visits due to interquartile range increases in daily concentrations of CO (1.25 ppm),
NO
2
(68.30 g/m3), O
3
(55.76 g/m3), and SO
2
(7.81 g/m3) for the entire patients group.
Impact of Urban Air Pollution on Acute Upper Respiratory Tract Infections
243
4. Discussion
We have shown that PM
10
presented a more consistent adverse effect on respiratory tract
evaluated in terms of upper respiratory tract infections ER visits than gaseous pollutants
and that this effect has both lag structure and age-dependent magnitude.
In this investigation we adopted the time-series design with the most used regression model
to investigate acute effects of air pollutants. Poisson regression and polynomial distributed
lag models have been largely tested and they have shown consistent results and less
susceptibility to bias.
We adopted upper respiratory tract infection as an endpoint because it is the most common
disease in humans that lead patients to medical services. Among them, the emergency
departments receive most of those cases (Fendrick et al.,2003; Footitt & Johnston, 2009). The
incidence of acute URTIs is inversely proportional to age. On average, the youngest children
have 6-8 and adults 2-4 per year (Heikkinen & Jarvinen, 2003).
The effect of air pollutants on health are more demonstrated on children and on the elderly
and the evidence of an effect among adults in the general population is more limited
(Cesarone et al., 2008). More refined assessment, including analysis of subgroup defined by
specific illness or ages, or of air pollutants not routinely monitored, has been limited by
study size and available air quality and health outcome data. (Peel et al., 2005). In this study
we took advantage of obtaining data at the Federal University Hospital that attends to a
considerable number of patients in the most populous city in Brazil with an official network
of air monitoring at 14 substations. This fact has allowed us to stratify our results by age
group and by air pollutants.
Viruses are the causal pathogens in most upper respiratory tract infection cases, with fewer
than 10% of the cases caused by bacteria. The viral pathogens primarily associated with
upper respiratory tract infections include picornaviruses (notably, rhinoviruses and
enteroviruses), coronaviruses, adenoviruses, parainfluenza viruses, influenza viruses, and
respiratory syncytial viruses. (Fendrick et al., 2003; Heikkinen & Jarvinen, 2003) Infections
caused by influenza (ICD 10th J10-J11) is not included in the current study and will be
presented elsewhere.
Non- influenza viral respiratory tract infection (VRTI) compromises the overall health status
of the individual and produce high morbidity. The average length of an episode is about 7
days and one quarter of the cases can reach 14 days. The magnitude of VRTIs impact on
public health can be scaled through the study of The National Centre for Health Statistics
(USA), which showed that in the United States of America around 500 million non-influenza
viral upper respiratory infections occur annually, resulting in a loss of 40 billion US dollar
costs and with 40-100 million school and work days lost to absenteeism. (Fendrick et
al.,2003; Footitt & Johnston, 2009 ). In the United Kingdom, treatment of cough, symptom
usually associated to viruses, in non-asthmatic pre-school children cost at over 30 million
pounds annually. (Hollinghurst et al., 2008).
The airway epithelium acts as the first defense against respiratory pathogens, as a physical
barrier, with the mucociliary system and its immunological functions. It initiates multiple
innate and adaptive immune mechanisms for efficient antiviral responses. The interaction
between respiratory pathogens and airway epithelial cells results in production of
substances, including type I and III interferons, lactoferrin, β-defensins, and nitric oxide, and
also in the production of cytokines and chemokines, which recruit inflammatory cells and
influence adaptive immunity. These defense mechanisms usually result in rapid pathogens
Advanced Topics in Environmental Health and Air Pollution Case Studies
244
clearance. (Becker et al., 2005; Vareilleet et al., 2011). In addition alveolar macrophages
(AMs) play a key role in the defense against respiratory infection. At least three properties
of AMs play key antimicrobial roles, i.e. the production of inflammatory cytokines, reactive
oxidant species (ROS) and interferon (Castranova et al., 2001). Besides macrophages can
inhibit viral replication and also limit viral infections by removing the debris of destroyed
cells and by presenting viral antigens to T lymphocytes (Mei et al., 2005).
Once installed in the airway epithelium, viral infections can damage the barrier function
leading to enhanced absorption of allergens and/or irritants across the airway wall
promoting inflammation. Conversely, experimental results have shown that intact
epithelium is more resistant to infection of human respiratory viruses. Consequently,
external agents such as allergens and pollutants that damage airway epithelium could
increase susceptibility to infection and/or lead to more-severe infections. (Gern, 2010)
The mucosa of the upper respiratory (URT) is exposed to almost all of the airborne irritating
agents. Depending on both, chemical composition and concentration, these pollutants could
alter the morphological patterns of this mucosa at subcellular level and lead to acute and
chronic adverse effects that include hypersecretory reaction of the mucous gland and globet
cells, decrease of the cilia number and size and loss of the normal pseudo-stratified pattern
of the epithelium (Gulisano et al., 1997). Furthermore, experimental evidence suggests that
exposures to ambient air pollution may adversely affect lung defense functions such as
aerodynamic filtration, mucociliary clearance, particle transport, and detoxification by
alveolar macrophages (Mei et al., 2005).
In terms of criteria air pollutants, studies have shown that both particulate and gaseous
pollutants can act all over the airways to initiate and exacerbate cellular inflammation.
Inflammatory cells have been seen in bronchoalveolar lavage or nasal washes of asthmatics
and not-asthmatic patients exposed to diesel exhausts, ozone, sulphur dioxide and nitrogen
dioxide in chambers studies or after nasal provocation challenges, respectively (Bernstein et
al., 2004).
Coarse particles deposit in the upper airways of the lungs and are associated with increased
cytotoxicity and proinflammatory cytokines interleukin-6 and interleukin-8 (Mei et al.,
2005). Upon contact with particles AMs are activated, and produce a large quantity of
reactive oxygen species (ROS) from various enzymatic sources (Huang et al., 2008).
Particulate matter (PM) exposure may also increase or decrease antioxidant defense
mechanisms in the lung, which further modulates oxidative stress and enhances pulmonary
and systemic inflammation (Huang et al, 2008). Furthemore, PM inhibit the pulmonary
production of interferon in response to viral exposure (Castranova et al, 2001). Experimental
study showed that exposure to coarse particles significantly exacerbated pulmonary
infection in mice (Mei et al., 2005). The suppressive effects of PM on production of
antimicrobial agents result in pulmonary susceptibility to both viral and bacterial infection,
as demonstrated in animal models. (Castanova et al, 2001).
Inhalation of ozone (O
3
) leads to disruption of epithelial barrier, affects the mucociliary
clearance and can induce production of proinflammatory factors. O
3
is cytotoxic to
macrophages and can modify the macrophage and neutrophil paghocytosis (Hollingsworth
et al., 2007). These effects can cause susceptibility to viral and bacterial infections. Two age
groups, the children and elderly, are particularly vulnerable to low levels of inhaled O
3
but
its effects can be also noted in the other age groups (Hollingsworth et al., 2007). In this study
we did not observe lagged effects of ozone or differentiation by age groups.
Impact of Urban Air Pollution on Acute Upper Respiratory Tract Infections
245
The health effects of nitrogen dioxide (NO
2
) exposure may result from both the direct
oxidant effects of the pollutant and from increasing airway susceptibility to other
challenges, including respiratory virus infection. NO
2
causes a cascade of events, beginning
with injury and inflammation of the distal airway epithelium, recruitment of T lymphocytes
from blood to the airways, and increased susceptibility of the injured epithelial cells to viral
infection (Frampton et al., 2002). Also, NO
2
cause reduction in ability to macrophage
fagocytose and ciliary diskenesis (Chauhan et al., 2005). In this study the NO
2
effects were
small and unlikely to be of clinical significance for healthy subjects. Also, effects were acute,
on the same day of exposure, without differentiation by age groups. Presence of
comorbidities may increase the susceptibility of some age groups to NO
2
effects.
Sulphur dioxide (SO
2
) is a respiratory tract irritant that has been shown to cause acute
respiratory health effects including cough, bronchoconstriccion and decreased lung function
in controlled human exposures. In high concentrations, SO
2
exposure can result in
significant airway injury (Chen et al., 2007). Experimental studies have shown that SO
2
causes edema, loss of cilia, epithelial thinning, and epithelial desquamation in the olfactory
epithelium in mice (Min et al., 1994), damage to the epithelium of the airways and slowing
of ciliary transport of mucus (Lippmann & Ito, 2005) and reduced resistance of female mice
to infection by aerosol inoculation with Klebsiella pneumoniae (Azoulay-Dupuis et al.,
1982). SO
2
levels have declined in São Paulo over the last decades. However, we have
observed adverse effects on health even under this situation (Arbex et al., 2009). In this
study, the smallest effect was observed for SO
2
exposure and no effect modification was
observed in age groups analyses.
In urban centers carbon monoxide (CO) emissions have declined significantly since the
introduction of catalytic converters for motor vehicles (Chen et al., 2007). However, the
health risks of exposure to these low levels even below to current standards could produce a
considerable public health burden particularly for persons with cardiovascular disease (Bell
et al., 2009). Investigators have linked short-and long-term CO exposure mainly with
cardiovascular events (Chen et al., 2007; Bell et al., 2009).
Our results have shown that the age group most affected by exposure to particles, NO
2
and
O
3
was children.
Three repeated cross-sectional studies of a total of 7,611 East German children aged 5–14 yrs
during 1992–1993, 1995–1996, and 1998–1999 found a statistical significant age-adjusted
decrease for bronchitis (54.2 versus 38.0%), otitis media (30.7 versus 26.7%), sinusitis (4.6
versus 2.3%), frequent colds (36.7 versus 28.5%) and morning cough (13.4 versus 12.2%) in
parallel to an improvement of annual means of SO
2
(60 versus 8 µg·m−3) and TSP (56 versus
29%) (Heinrich et al., 2002).
Joaakkola et al. (1991) reported an increased prevalence of URTIs in infants and children
living in city polluted by moderate levels of PM
10
, NO
2
and SO
2
as compared to children of a
clean air region and von Mutius et al. (1995) have shown that high concentrations of SO2
and moderate levels of particulate matters and NO
2
are associated with an increase risk of
developing upper respiratory symptoms in childhood.
Peel et al. (2005) in a time-series study have shown that URTIs visits, mainly in infants and
children, were positively associated with levels of PM
10
, O
3
, NO
2
and CO. Despite our study
not showing relationship between CO and URTIs in children the lag structure of studies are
very similar.
Advanced Topics in Environmental Health and Air Pollution Case Studies
246
Study conducted in Finland have demonstrated that higher levels of SO2 and NO2 were
associated with an increase number of URTIs (Ponka, 1990) and study conducted in Hong
Kong significant association between first visit for URTI and an increase in the
concentration of NO
2
, O
3
, PM
10
, PM
2,5
was observed , but not SO
2
(Wong et al., 2006).
However the models of the studies have different design from ours since they do not
explore lag and age groups.
Our findings are consistent with Hajat et al (2002), who carried out a study in London, UK.
They found a stronger association for PM
10
for upper respiratory diseases on general
practitioner: 5.7% for a 31 µg·m−3 change in PM
10
in adults aged 15–64 yrs, and 10.2% in
adults aged ≥65 yrs. However, they estimated that a 18 µg·m−3 increase in SO
2
resulted in a
3.5% increase in childhood consultations at family practices while in our study the age
group more affected by SO
2
exposure was the adults aged between 30 and 65 years.
Similar to our study lag structure, Laurie et al. (2009) have demonstrated the risk of medical
home visits in Bordeax, France and upper respiratory diseases was significantly increased
by 1.5% (CI 0.3,2.7) during 3 days following a 10-µg/m3 increase in PM
10
levels.
Cesarone et al. (2008) have shown that indices of exposure to traffic-related air pollution
were consistently associated with an increased risk of rhinitis in adults in Rome, Italy.
However, different from our study, the authors suggest that the main mechanism was due
to allergic process.
Different from previous study, we found an association between increase in CO levels and
emergency room visits for URTIs in elderly people at lag 2,3,4. Whereas the main effect of
carbon monoxide is on the cardiovascular system, our hypothesis is if the IRTIs could lead
to cardiovascular injury in sensitive people.
Despite certain minor differences between our study and those mentioned above, all agree
on one major point: urban air pollutants are hazardous and could lead to URTIs. The minor
disagreements between age groups and pollutant-specific effects can most likely be
attributed to study-specific design characteristics.
5. Conclusion
This study showed that air pollutants exposure in general, and PM
10
in special, can increase
ED visits due to upper respiratory tract infections and that this effect can be modified by age
group. Upper respiratory tract infections cannot be considered severe health outcomes.
However, it is one of the most frequent groups of respiratory diseases and affects different
age groups, increasing cost of medical treatments. Despite the well known susceptibility of
the extreme age groups to air pollutants exposure there are other age groups that seem to
present pollutant-specific susceptibility, enlarging the burden of air pollutants on health.
Despite the observed differences on effects estimates by pollutants, in the outdoor
environment people are exposed to a mixture of pollutants and pollutant-specific effects that
is really difficult to estimate in the outdoor environment.
We believe that this study may support efforts to limit air pollution emissions to stricter
standards than those currently adopted in Brazil. In addition, despite the improvement in car
engines and the consequent reduction in emissions, the number of cars has increased over the
last decade, bringing more vehicles to the streets every day. Monitoring this scenario will
require new studies that evaluate frail population groups and analyzing effect modifiers.
Impact of Urban Air Pollution on Acute Upper Respiratory Tract Infections
247
Finally, we identified a clear association between air pollution and daily URTIs-related
emergency department visits for individuals with different age groups in the city of Sao
Paulo, Brazil. Air pollution remains an under-evaluated cause of URTIs exacerbation.
Primary pollutants, which in São Paulo are generated mainly by cars, are among those
factors that must be addressed in order to minimize the risks to public health.
5. References
American Thoracic Society. (2000). What constitutes an adverse health effect of air
pollution? American Journal of Respiratory and Critical Care Medicine, Vol. 165, No.
2, pp. 665-673, ISSN1073-449X
Akaike, H. (1973). Information theory and an extension of the maximum likelihood
principal. In: 2nd International Symposium on Information Theory, Petrov BN, Csaki F,
pp. 267-281, Akademiai Kiado, Budapest
Arbex M.A.; de Souza Conceição, G.M.; Cendon, S.P.; Arbex, F.F.; Lopes, A.C.; Moysés, E.P.;
Santiago, S.L.; Saldiva, P.H.; Pereira, L.A. & Braga, A.L.F. (2009). Urban air
pollution and chronic obstructive pulmonary disease. Jounal of Epidemiology and
Community Health, Vol. 63, No. 10, pp. 777-783, ISSN 0143-0005X
Azoulay-Depuis, E.; Bouley, G. & Blayo, M.C. (1982) Effects of sulfur dioxide on resistance
to bacterial infection in mice. Environmental Research, Vol. 29, No. 2, pp. 312-319,
ISSN 0013-9351
Becker, S.; Mundandhara, S.; Devlin, R.B. & Madden, M. (2005). Regulation of cytokine prod
uction in human alveolar macrophages and airway epithelial in response to
ambient air pollution particles: Further mechanists studies. Toxicology and Applied
Pharmacology, Vol. 207, suppl. 2, pp. S269-S273, ISSN 0041-008X.
Bell, M.L.; Peng, R.D.; Dominici, F. & Samet, J.M. (2009). Emergency hospital admissions for
cardiovascular diseases and ambient levels of carbon monoxide. Circulation, Vol.
120, No. 11, pp. 949-955, ISNN 0009-7322
Bellos, A.; Mulholland, K.; O´Brien, K.L.; Qasi, S.A.; Gayer, M. & Checci, F. (2010). The
burden of acute respiratory infections in crisis-affected populations: a systematic
review. Conflict and Health, Vol. 4, No. 3, pp. 1-12, ISNN 1752-1505
Bernstein, J.A.; Alexis, N.; Barnes, C.; Bernstein, I.L.; Bernstein, J.A.; Nel, A.; Peden, D.; Diaz-
Sanchez, D.; Tarlo, S.M. & Williams, P.B. (2004). Health effects of air pollution.
Jounal of Allergy and Clinical Immunology, Vol. 114, No. 5, pp. 1116–1123, ISSN 0091-
6749
Brunekreef, B. & Holgate, S.T. (2002). Air pollution and health. Lancet Vol. 360, No. 9341, pp.
1233–1242, ISSN 0140-6736
Castranova, V.; Ma, J.Y.V.; Yang, H.M.; Antonini, J.M.; Butterworth, L.; Barger, M.W.;
Roberts, J. & Ma, J.K.H. (2001). Effect of exposure to diesel exhaust particles on the
susceptibility of the lung to infection. Environmental Health Perspective, Vol. 109,
suppl. 4, pp. 609-612, ISSN 0091-6765
Cesarone, G.; Badaloni, D.P.; Forastieri, F. & Perucci, C.A. (2008). Comparison between
various indices of exposure to traffic-related air pollution and their impact on
respiratory health in adults. Occupational and Environmental Medicine, Vol. 65, No.
10, pp. 683-690, ISSN 1470-7926
Advanced Topics in Environmental Health and Air Pollution Case Studies
248
Chauhan, A.; Chatterjee, A. & Johnston, S. (2005). Acute respiratory infections. In: Effects of
air pollution on children health and development. A review of the evidence, European
Center of Environmental and Health, pp. 44-69, World Health Organization, Bonn.
Chen, T.M.; Gokhale, J.; Schofer, S. & Kuschner, W.G. (2007). Outdoor air pollution:
Nitrogen dioxide, sulfur dioxide, and carbon monoxide health effects. The American
Journal of the Medical Sciences, Vol. 333, No. 4, pp. 249-256, ISSN 0002-9629
Fendrick, A.M.; Monto, A.S.; Nightengale, B. & Sarnes, M. (2003). The economic burden of
non-influenza-related viral respiratory tract infection in the United States. Archives
of Internal Medicine, Vol. 163, No. 4, pp. 487-494, ISSN 0003-9926
Footitt, J. & Johnston, S.L. (2009). Cough and viruses in airways disease: mechanisms.
Pulmonary Pharmacology and Therapeutics, Vol. 22, No. 2, pp. 108-113, ISSN 1094-5539
Frampton, M.W.; Boscia, J.; Roberts Jr, N.J.; Azadniv, M.; Torres, A.; Cox, C.; Morrow, P.E.;
Nichols, J.; Chalupa, D.; Frasier, L.M.; Gibb, F.R.; Speers, D.M.; Tsai, Y. & Utell, M.J.
(2002). Nitrogen dioxide: effects on airways and blood cells. American Journal of
Physiology - Lung Cellular and Molecular Physiology, Vol. 282, No. 1, pp. L155-L165,
ISSN 1040-0605
Gern, J.E. (2010). The ABCs of rhinoviruses, wheezing, and asthma. Journal of Virology, Vol.
84, No. 15, pp. 7418-7426, ISSN 0022-538X
Gouveia, N.C. & Maisonet, M. (2005). Health effects of air pollution: an overview. In: Air
quality guidelines. Global Update 2005, World Health Organization, pp. 87-103, WHO
Office for Europe, ISBN 92-890-2192-6, Copenhagen
Green, P.J. & Silverman, B.J. (1994). Non parametric regression and generalized linear
models: a roughness penalty approach, Chapman & Hall, London
Gulisano, M.; Marceddu, S.; Barbaro, A.; Pacini, A.; Buiatti, E.A.; Martini, A.P. & Pacini P.
(1997). Damage to the nasopharyngeal mucosa induced by current levels of urban
air pollution: a field study in lambs. European Respiratory Journal, Vol. 10, No. 3, pp.
567-572, ISSN 0903-1936
Hajat, S.; Anderson, H.R.; Atkinson, R.W. & Haines, A. (2002). Effects of air pollution on
general practitioner consultations for upper respiratory diseases in London.
Occupational and Environmental Medicine, Vol. 59, No. 5, pp. 294-299, ISSN 1470-
7926
Heikkinen, T. & Jarvigen, A. (2003). The common cold. Lancet, Vol. 361, No. 9351, pp. 51-59,
ISSN 0140-6736
Heinrich, J.; Hoelscher, B.; Frye, C.; Meyer, I.; Pitz, M.; Cyrys, J.; Wjst, M.; Neas, L. &
Wichmann, H.E. (2002). Improved air quality in reunified Germany and decreases
in respiratory symptoms. Epidemiology, Vol. 13, No. 4, pp. 394–401, ISSN 1044-3983
Hollingwhorst, J.W.; Kleeberger, S.R. & Forster, M.W. (2007). Ozone and pulmonary innate
immunity. Proceedings of the American Thoracic Society, Vol. 4, No. 3, pp. 240-246,
ISSN 1546-3222
Hollinghurst, S.; Gorst, C.; Fahey, T. & Hay, A.D. (2008). Measuring the financial burden of
acute cough in pre-school children: a cost of illness study. BMC Family Practice, 9:10.
ISSN 1471-2296, Available from
Huang, Y.T.; Li, Z.; Carter, J.D.; Soukup, J.M.; Schwartz, D. & Yang, I.V. (2008) Fine ambient
particles; induce oxidative stress and metal binding genes in human alveolar
Impact of Urban Air Pollution on Acute Upper Respiratory Tract Infections
249
macrophages. American Journal of Respiratory Cell and Molecular Biology, Vol. 41, No.
5, pp. 544-552, ISSN 1044-1549
Jaakkola, J.J.K.; Paunio, M.; Virtanen, M. & Heinonen, O.P. (1991). Low-level air pollution
and upper respiratory infections in children. American Journal of Public Health, Vol.
81, No. 8, pp. 1060-1063, ISSN 0090-0036
Ko, F.W.S. & Hui, D.S.C. (2010). Effects of air pollution on lung health. Clinical Pulmonary
Medicine, Vol. 17, No. 6, pp. 300-304, ISSN 1068-0640
Larrieu, S.; Lefranc, A.; Gault, G.; Chatignoux, C.F.; Jouves, B. & Filleul, L. (2009). Are the
short-term effects of air pollution restricted to cardiorespiratory diseases. American
Journal of Epidemiology, Vol. 169, No. 10, pp. 1201-1208, ISSN 0002-9262
Lippmann, M. & Ito, K. (2005). Sulfur dioxide: In: Air quality guidelines. Global Update 2005,
World Health Organization, pp. 395-420, WHO Office for Europe, ISBN 92-890-
2192-6, Copenhagen
Martins, L.C.; Latorre, M.R.D.O.; Saldiva, P.H.N. & Braga, A.L.F. (2001). Air pollution and
emergency room visits for upper airway respiratory infection in São Paulo city:
evaluation of vehicle restriction. Revista Brasileira de Epidemiologia, Vol. 4, No. 3, pp.
220-229, ISSN 1415-790X
McCullag, P. & Nelder, J.A. (1989). Generalized linear models (2nd edition), Chapman & Hall,
ISBN 0-412-31760-5, London
Mei, L.; Stieb, D.M. & Chen, Y. (2005). Coarse particulate matter and hospitalization for
respiratory infections in children younger than 15 years in Toronto: a case-
crossover analysis. Pediatrics, Vol. 116, No. 2, pp. 235-240, ISSN 0031-4005
Min, Y.G.; Rhee, C.S.; Choo, M.J.; Song, H.K. & Hong, S.C. (1994). Histopathologic changes
in the olfactory epithelium in mice after exposures to sulfur dioxide. Acta Oto-
laryngologica, Vol. 114, No. 3, pp. 447-452, ISSN 0001-6489
Olivieri, D. & Scoditti, E. (2005). Impact of environmental factors on lung defenses. Eur
Respir Rev, Vol. 14, No. 4, pp. 51-56, ISSN 0905-9180
Peel, J.; Tolbert, P.E.; Klein, M.; Metzger, K.B.; Flanders, D.; Todd, K.; Mulholland, J.A.;
Ryan, P.B. & Frumkin, H. (2005). Ambient air pollution and respiratory emergency
department visits. Epidemiology, Vol. 16, No. 2, pp. 164-174, ISSN 1044-3983
Perez, L.; Rapp, R. & Kunzli, N. (2010). The year of the lung: outdoor air pollution and lung
health. Swiss Medical Weekly, Vol. 140, pp. E1-E7, ISSN 1424-3997
Ponka, A. (1990). Absenteeism and respiratory disease among children and adults in
Helsinki in relation to low-level air pollution and temperature. Environmental
Research, Vol. 52, No. 1, pp 34-46, ISSN 0013-9351
Shusterman, D. (2011). The effects of air pollutants and irritants on the upper airways.
Proceedings of the American Thoracic Society, Vol. 8, No. 1, pp. 101-105, ISSN 1546-
3222
Vareille, M.; Kieninger, E.; Edwards, M.R. & Regamey, N. (2011). The airway epithelium:
soldier in the fight against respiratory viruses. Clinical Microbiology Reviews, Vol.
24, No. 1, pp. 210-229, ISSN 0893-8512
von Mutius, E.; Sherril, D.L.; Fritzsch, G.; Martinez, F.D. & Lebowitz, M.D. (1995). European
Respiratory Journal, Vol. 6, pp. 723-728, ISSN 0903-1936
Advanced Topics in Environmental Health and Air Pollution Case Studies
250
Wong, T.W.; Tam, W.; Yu, I.T.S.; Wun, Y.T.; Wong, A.H.S. & Wong, C.M. (2006). Association
between air pollution and general practitioner visits for respiratory diseases in
Hong Kong. Thorax, Vol. 61, No. 7, pp. 585-591, ISSN 0040-6376
13
Air Pollutants and Its Effects on Human
Healthy: The Case of the City of Trabzon
Yelda Aydın Türk and Mustafa Kavraz
Karadeniz Technical University
Turkey
1. Introduction
Air pollution, both indoors and outdoors, is a major environmental health problem affecting
everyone in developed and developing countries alike. Any agent that spoils air quality is
called air pollutant. Air pollution can be defined as the presence of pollutants,such as
sulphur dioxide (SO2), particle substances (PM), nitrogen oxides (NOX) and ozone (O3) in
the air that we inhale at levels which can create some negative effects on the environment
and human health (Bayram, 2006). Air pollutants have sources that are both natural and
human-based. Now, humans contribute substantially more to the air pollution problem.
Though some pollution comes from natural sources, most pollution is the result of human
activity. Air pollution is a problem of growing importance. This pollution damages the
natural processes in the atmosphere, and affects public health negatively. Currently, several
cities stand out as worst cases of air pollution (Kilburn,1992). It was found that until the
1980s, 1.3 billion people lived in cities where pollution was above the air quality standards
(Bayram, 2006). Besides, air pollution is a main threat to the vegetation.
Pollutants such as dust, soot, fog, steam, ash, smoke, etc. are introduced into air naturally
and as a result of human activities. The athmosphere can neutralize toxic solid, liquid and
gaseous substances by melting them; however, due to the production of excessive amounts
of such substances and depending on the meteorological and topographic conditions, the
atmosphere is in a continuous process of pollution. (Kaypak and Özdilek,2008). There are
several main types of pollution. Among the main pollutants in the urban atmosphere are
primarily the particle substances (PM), sulphur dioxide (SO
2
), nitrogen oxides (NO
x
),
volatile organic compounds (VOCs), and secondarily ozone (O
3
) that is created as a result of
photochemical reactions. (Özden et all.,2008).
Particles are introduced into the air by burning fuel for energy. The gases produced as a
result of burning fuels in automobiles, homes, and industries are a major source of pollution
in the air. The exhaust from burning fuels in automobiles, homes, and industries is a major
source of pollution in the air. Some believe that even the burning of wood and charcoal in
fireplaces and barbeques can release significant quanitites of soot into the air. Another type
of pollution is the release of noxious gases, such as sulfur dioxide, carbon monoxide,
nitrogen oxides, and chemical vapors. These can take part in further chemical reactions once
they are in the atmosphere, forming smog and acid rain (URL4).
Air pollution was first seen in Turkey as a serious problem in the early 1970s, and in the
following years it spread into other cities mainly Istanbul. The reason for this is that lignite
Advanced Topics in Environmental Health and Air Pollution Case Studies
252
coal which has a high pollution rate was started to be used as a source of energy (Evyapan,
2008). 41% of the energy sources that are consumed in Turkey is used for heating purposes
in houses, and in winters air pollution in the residential areas with intense population
reaches levels that threaten human and environmental health.
An air pollutant is any substance which may harm humans, animals, vegetation or material
(Kampa and Castanas, 2008). Air pollutants cause adverse effects on human health and the
environment. A constant finding is that air pollutants contribute to increased mortality and
hospital admissions. Human health effects can range from nausea and difficulty in
breathing or skin irritation, to cancer (Kampa and Castanas,2008).
There are studies in literature which report the relationship between respiratory tract
diseases and the level of air pollution concentrations (SO
2
and PM). Few scientists found
that air pollution is associated with respiratory tract diseases of many sorts, including lung
cancer and emphysema.A number of studies have established a qualitative link between air
pollution and ill health(Lester and Eugene,1970). In their study, Sardar et al. (2006)
investigated the health records and found that there are statistically significant relationships
between respiratory tract diseases and rough particles, and that rough particles constitute an
important threat for human health. In addition, epidemiological and toxicological research
have focused on the role of particles (PM2.5) on the observed health effects (Anderson, 2000,
Brown, Stone, Findlay, Macnee, Donaldson, 2000, 1990). In their study, Lipfert et al. (1995)
report that there is a statistically significant relationship between atmospheric particle
matter size and admissions to hospitals for respiratory tract infections and mortalities. On
average, 5% of daily mortality is associated with air pollution.
As is the case of all environmental problems, the two primary causes of air pollution in
Turkey are urbanization which has been rapid since the 1950s, and industrialization. Before
industrialization, more than 80% of the population lived in rural areas, but now more than
60% live in cities and industrial complexes. Among the developments contributing to air
pollution in the cities are incorrect urbanization, low quality fuel, the high content of
sulphur and ash in the fuel used for heating and improper combustion techniques, the
shortage of green areas, the increase in the number of motor vehicles, inadequate disposal of
wastes and meteorological factors (Özer et al,1997).
Combustion of coal and various kinds of oil cause excessive air pollution in Istanbul,
Ankara, Bursa, Erzurum and Trabzon. In the Marmara Region, after the introduction of
natural gas for heating, the levels of pollution caused by heating was reduced in the cities in
this region. However, it has been observed that air pollution is increasing in cities like
Gaziantep, Erzurum, Bayburt, Trabzon, Niğde, Kütahya, Isparta and Çanakkale where there
is no intense industrialization.
Although air pollution is a serious problem in Turkey, the number of studies on the effects
of air pollution on health is rather limited. . In a study that investigated the relationship
between air pollution and mortality, Şahin (2000) found a statistically significant correlation
between the total suspended particulate matter and daily mortality in Istanbul. In a thesis
study, Olgun (1996) concluded that in Istanbul there was an 8% increase in the mortality
caused by respiratory system diseases in the children of 0-2 age group during the winters
when air pollution is the highest. Another study by Olgun (1996) which again focused on
the 0-2 age group investigated the 5-year SO
2
and total suspended particulate matter (PM)
values and the admissions to hospitals due to respiratory system diseases. The study found
that parallel to the increase in the air pollution, there was an increase in the bronchitis,
Air Pollutants and Its Effects on Human Healthy: The Case of the City of Trabzon
253
sinusitis, laryngitis and pneumonia cases and that there was an increase in the average
length of stay in hospitals.
In a study, Keleş et al. (1999) investigated the prevalence of allergic rhinitis and atopy in two
quarters of Istanbul, where in one air pollution was intense and where in the other low.
They found that allergic rhinitis sympoms were significantly higher in the quarter where
there was an intense air pollution.
Ünsal et al. (1999) investigated the admissions to the emergency service of the Eskişehir
Public Hospital for symptoms of certain diseases, and they found that parallel to the
increase in daily SO
2
levels, there was also an increase in the number of admissions due to
lower respiratory tract infections, Chronic Obstructive Pulmonary Disease (COPD) and Cor
Pulmonale (Ünsal et al., 1999). Another study carried out in Ankara investigated the
relationship between the concentrations of particulate matter (PM), one of the air pollution
parameters, and asthma. A correlation was found between emergency asthma admissions
and SO
2
and PM concentrations (Evyapan, 2008).
Another study investigated the relationship between air pollution and admissions to
hospitals for acute respiratory tract diseases between June 1994 and June 1995 in Istanbul. A
positive relationship was found between the PM levels and admissions to hospitals (Dağlı et
all, 1996). Similarly, a thesis study that was carried out in Izmit and that covered the years of
1996 and 1997 investigated the relationship between admissions to hospitals due to asthma
and air pollution and meteorological parameters. The study found that there is a positive
correlation between year-long weekly average smoke concentrations and admissions to
hospitals due to asthma (r=0,26; p=0,000001). On the other hand, a weak correlation was
found between the SO
2
levels and admissions to hospitals due to asthma in summer times
(r=0,22; p=0,002)(Çelikoğlu,1999). Another study that was carried out in Gaziantep
investigated the life quality of asthma patients. The study found an increase in the asthma
symptoms in times of intense air pollution (Fişekçi et al,2000).
In addition, studies that investigated the relationships between air pollution parameters
(SO
2
and PM) and such respiratory tract diseases as COPD and asthma were also carried out
in such cities as Gaziantep, Denizli and Diyarbakır. The findings of these studies showed an
increase in the admissions to emargency services of hospitals especially in times of intense
air pollution.
In the framework of the study, the effects of air pollution on human health were
investigated in the city of Trabzon that was chosen as the study area. The time interval of
the study was determined to be between 2000-2009, and the possible effects of the air
pollution on human health during this time interval were recorded and displayed.
This study aims to investigate the relationship between morbidity (number diseases
reported /total population)of the diseases and the air pollution parameters (SO2 and PM
concentrations). To this end, the data for diseases caused by air pollutants and air pollution
concentrations in the winter months in the city of Trabzon between 2000 and 2009, have
been recorded and statistically analyzed.
2. Effects of air pollutants on health
Given the fact that an average person inhales about 13,000-16,000 litres of air daily and 400-
500 million litres in his lifetime, then the importance of air quality for human health
becomes clearer (Öztürk, 2005). The direct effects of air pollution on human health vary
depending on the period of exposure to air pollution, intensity of air pollution, and the
Advanced Topics in Environmental Health and Air Pollution Case Studies
254
general health condition of the population. Although the negative effects of air pollution can
also be seen on healthy people, its effects create more serious problems in groups with
higher vulnerability. Children and the elderly, those with respiratory tract diseases and
cardiocascular diseases, those who are allergic, and those who do exercises are at more risk
(URL 9). It has been reported in such studies that air pollution increases the risk of acute
respiratory tract diseases in children and leads to an increase in cardiorespiratory morbidity
and mortality (Bayram et al., 2006).
As a result of the negative effects of air pollution on health, the following have been
observed:
An increase in lung cancer cases
An increase in the frequency of chronic asthma crisis
An increase in the frequency of asthma cases
An increase in the frequency of coughing/phlegm
An increase in the acute disorders of upper repiratory system
An increase in eye, nose and throat irritation cases
Reduction in respiratory capacity
An increase in mortality
A reduction in productivity and production
An increase in medical treatment expenses
The relationship between air pollution and lung cancer has also been addressed in several
case-control. Studies focusing on morbidity endpoints of long-term exposure have been
published as well (Cohen,2000, Katsouyannı et al.,1997). Notably, work from Southern
California has shown that lung function growth in children is reduced in areas with high PM
concentrations (Gauderman et al.,2000 and Guaderman et al.,2002) and that the lung function
growth rate changes in step with relocation of children to areas with higher or lower PM
concentrations that before (Avol, E.L. et al. 2001).Pollutants in the air cause health defects
ranging from unnoticeable chemical and biological changes to trouble breathing and coughing.
The ill effects of air pollution primarily attack the cardiovascular and respiratory systems. The
severity of a person's reaction to pollution depends on a number of factors, including the
composition of the pollution, degree and length of exposure and genetics(URL3).
Health effects of concern are asthma, bronchitis and similar lung diseases, and there is good
evidence relating an increased risk of symptoms of these diseases with increasing
concentration of sulphur dioxide (SO
2
), ozone(O
3
) and other pollutants. Moreover, there is
increasing evidence to suggest that pollution from particulate matter (PM10 and black
smoke) at levels hitherto considered "safe" is associated with an increased risk of morbidity
and mortality (disease and death) from heart disease as well as lung disease. This is likely
especially in people with other risk factors (such as old age, or pre-existing heart and lung
disease). These concerns are the subject of current research throughout the world(URL-1).
The 2005 WHO Air quality guidelines (AQGs) are designed to offer global guidance on
reducing the health impacts of air pollution.According to WHO; Air pollution is a major
environmental risk to health and is estimated to cause approximately 2 million premature
deaths worldwide per year. The WHO Air quality guidelines represent the most widely
agreed-upon and up-to-date assessment of health effects of air pollution, recommending
targets for air quality at which the health risks are significantly reduced. By reducing
particulate matter (PM
10
) pollution from 70 to 20 micrograms per cubic metre can cut air
quality-related deaths by around 15% and help countries reduce the global burden of
disease from respiratory infections, heart disease, and lung cancer (URL2).
Air Pollutants and Its Effects on Human Healthy: The Case of the City of Trabzon
255
Sulphur dioxide (SO
2
) and Particulate Matter (PM) are among the most important air
pollutants that affect human health negatively. Sulphur dioxide (SO
2
) reacts with the
moisture content in the nose, nasal cavity and throat and, in this way, it destroys the nerves
in the respiratory system and harms human health. (Öztürk, 2005). When the SO
2
concentration is higher than the World Health Organization (WHO) standards, it negatively
affects especially those with asthma, bronchitis, cardiac and lung problems (Öztürk, 2005).
The studies have shown that air pollution has an important role on the development and
progression of lung cancer (URL 10). It was also found that air pollution increases the risk of
acute respiratory tract diseases especially in children and that it causes an increase in
cardiorespiratory morbidity and mortality (Bayram et al., 2006). The aim of the “Regulations
for the Protection of Air Quality” dated 2 November 1986 (published in the official gazette no
19269) is to take under control the soot, smoke, dust, gas, steam and aerosol emissions created
by any kind of human activity; to protect human beings and their environment from the
dangers caused by air pollution; to prevent and eradicate the negative effects that occur in the
environment and that harm the community and neighborhood relations, and itemize the
mandatory short- and long-term limit values for various air pollutants (Table1). (Öztürk, 2005).
The negative effects of particulate matter on human health increase as the size of the matter
gets smaller. Due to the fact that those who do sports especially in areas with high PM
concentrations take deeper breaths and more frequently during the activity than those who do
not do sports, such matters reaches the lungs more easily and accumulate there (Öztürk, 2005).
SO
2
(ppm)
Duration of
Exposure
Effects
0,037-
0,092
Annual Average
With 185 μg m-3 smoke concentration, increase in
respiratory track diseases and lung diseases
0,007 Annual Average
With high particulate matter concentration, progression
in the respiratory track diseases in children
0,11-0,19 24 hours
In low particle concentration, increase in the respiratory
track diseases in the elderly .
0,19 24 hours
Progression in chronic respiratory track diseases in the
grown-ups
0,19 24 hours
In low particle concentrations, an increase can be
observed in mortality
0,25 24 hours
With 750 μg m-3 smoke concentration, an increase in
daily mortality rates may be observed (UK). Sudden
increase in morbidity.
0,5 10 minutes
In asthma patients, increase in breathing resistance
during exercise (mobility)
5 24 hours In healthy people, increase in breathing resistance
10 10 minutes Bronchospasm
20 Eye irritation, coughing
Table 1. Effects of sulphur dioxide (SO
2
) on human health (Öztürk, 2005)
Advanced Topics in Environmental Health and Air Pollution Case Studies
256
SO
2
can affect the respiratory system and the functions of the lungs, and causes irritation of
the eyes. Inflammation of the respiratory tract causes coughing, mucus secretion,
aggravation of asthma and chronic bronchitis and makes people more prone to infections of
the respiratory tract. Hospital admissions for cardiac disease and mortality increase on days
with higher SO
2
levels. When SO
2
combines with water, it forms sulfuric acid; this is the
main component of acid rain which is a cause of deforestation.
Particulate air pollution is a mixture of solid, liquid or solid and liquid particles suspended
in the air. These suspended particles vary in size, composition and origin. It is convenient to
classify particles by their aerodynamic properties because: (a) these properties govern the
transport and removal of particles from the air; (b) they also govern their deposition within
the respiratory system and (c) they are associated with the chemical composition and
sources of particles. These properties are conveniently summarized by the aerodynamic
diameter, that is the size of a unitEUR/density sphere with the same aerodynamic
characteristics. Particles are sampled and described on the basis of their aerodynamic
diameter, usually called simply the particle size (URL 11).
The effects of PM on health occur at levels of exposure currently being experienced by most
urban and rural populations in both developed and developing countries. Chronic exposure
to particles contributes to the risk of developing cardiovascular and respiratory diseases, as
well as of lung cancer. In developing countries, exposure to pollutants from indoor
combustion of solid fuels on open fires or traditional stoves increases the risk of acute lower
respiratory infections and associated mortality among young children; indoor air pollution
from solid fuel use is also a major risk factor for chronic obstructive pulmonary disease and
lung cancer among adults. The mortality in cities with high levels of pollution exceeds the
mortality observed in relatively cleaner cities by 15–20%. Even in the EU, average life
expectancy is 8.6 months lower due to exposure to PM
2.5
produced by human activities.
Specifically, the database on long-term effects of PM on mortality has been expanded by
three new cohort studies, an extension of the American Cancer Society (ACS) cohort study,
and a thorough re-analysis of the original Six Cities and ACS cohort study papers by the
Health Effects Institute (HEI) (URL 11).
In view of the extensive scrutiny that was applied in the HEI reanalysis to the Harvard Six
Cities Study and the ACS study, it is reasonable to attach most weight to these two. The HEI
re-analysis has largely corroborated the findings of the original two US cohort studies, which
both showed an increase in mortality with an increase in fine PM and sulfate. The increase in
mortality was mostly related to increased cardiovascular mortality. A major concern
remaining was that spatial clustering of air pollution and health data in the ACS study made it
difficult to disentangle air pollution effects from those of spatial auto-correlation of health data
per se. The extension of the ACS study found for all causes, cardiopulmonary and lung cancer
deaths statistically significant increases of relative risks for PM2.5. TSP and coarse particles
(PM15 – PM2.5) were not significantly associated with mortality (13). The effect estimates
remained largely unchanged even after taking spatial auto-correlation into account (URL 11).
Particulate matters can proceed up to the alveoli in the lungs and therefore causes such
important problems as asthma and bronchitis (Sloss and Smith,2000).
3. Study area
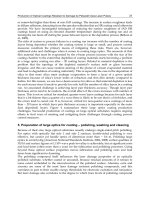
The City of Trabzon is situated in northeast of Turkey (Figure1), lies on the north sides of
the Eastern Black Sea Mountains, between longitudes 38° 30' - 40° 30' E and latitudes 40° 30'
Air Pollutants and Its Effects on Human Healthy: The Case of the City of Trabzon
257
- 41° 30' N (URL 5). The area of Trabzon is about 4.664 km2 and total population of the city
is about 293.000. The population density is about 5.000 people per km
2
.Trabzon has a typical
Black Sea climate, with rainfall throughout the year. Sea climate, with a lot of rainfall
throughout the year. Summers are cool and winters are mild and damp. Towards the south,
the climate becomes colder. Trabzon has a thick vegetation and receives ample rain [URL 7].
Though, in general, Trabzon has a rainy climate, and rain reaches its peak between
September-late June . The average annual rainfall is 800-850 kg/m2, and about 152 days of
the year are rainy. Starting from the sea level, the elevation reaches up to 3000 m in the
south. The annual average temperature in Trabzon is 14.57 °C [URL 5], and the dominant
wind directions are south-southwest in December, southwest in April, south in June, and
west-north in the other months. April and especially May are rather foggy, and relative
humidity reaches its peaks in May (79%) and June (76%), respectively. The humidity starts
to decrease in summer months and reaches 67% in December, which is the minimum level.
Sometimes, the humidity reaches 99% (URL-6).
As a result of fast urbanization, there has been quite a dense housing in the city. Residential
areas are concentrated on the coastal areas of the city especially in the west of the city
(Figure 1). In recent years, the number of high-rise buildings is increasing day by day in the
valleys stretching towards the south of the city.
B L A C K S E A
AÝRPORT
SEAPORT
N
Measuring station
Main Roads
Secondary roads
Indastrial area
Fıg. 1. Trabzon city map.
4. Air pollution in trabzon
Air pollution is an important problem during the winters in Trabzon. The level of SO
2
and
PM increases during the winter especially between November and April in Trabzon as it
does in the other cities in Turkey. There is a dense air pollution in the residential areas along
the coast line in the west of the city. These parts of the city are characterized with high
buildings. This prevents the removal of the pollution by the dominant winds in the city
(URL 7). Because the pollution is not transported out of the city by the air, a cloud of
pollutant particles can easily be seen in winter months (Figure 2).
Advanced Topics in Environmental Health and Air Pollution Case Studies
258