Matematik simulation and monte carlo with applications in finance and mcmc phần 4 pptx
Bạn đang xem bản rút gọn của tài liệu. Xem và tải ngay bản đầy đủ của tài liệu tại đây (355.32 KB, 35 trang )
b 19 2006 il /S 91 05
Stratified sampling 91
=
1
N
M
i=1
p
i
2
i
+
2
i
−
2
=
1
N
M
i=1
p
i
2
i
+
1
N
M
i=1
p
i
i
−
2
(5.21)
Comparing Equations (5.18) and (5.21) gives
Var
−Var
PS
=
1
N
M
i=1
p
i
i
−
2
which is the amount of variance that has been removed through proportional stratified
sampling.
In theory we can do better than this. If Equation (5.17) is minimized subject to
M
i=1
n
i
= N , it is found that the optimum number to select from the ith stratum is
n
∗
i
=
Np
i
i
M
i=1
p
i
i
in which case the variance becomes
Var
OPT
=
1
N
M
i=1
p
i
i
2
=
2
N
(5.22)
say. However,
M
i=1
p
i
i
−
2
=
M
i=1
p
i
2
i
−
2
(5.23)
Therefore, from Equations (5.18) and (5.22),
Var
PS
−Var
OPT
=
1
N
M
i=1
p
i
i
−
2
Now the various components of the variance of the naive estimator can be shown:
Var
=
1
N
M
i=1
p
i
i
−
2
+
M
i=1
p
i
i
−
2
+
2
(5.24)
The right-hand side of Equation (5.24) contains the variance removed due to use of the
proportional n
i
rather than the naive estimator, the variance removed due to use of
the optimal n
i
rather than the proportional
n
i
, and the residual variance respectively.
Now imagine that very fine stratification is employed (i.e. M →). Then the outcome,
X ∈S
i
, is replaced by the actual value of X and so from Equation (5.21)
Var
=
1
N
Var
X
EY
X
+E
X
2
Y
X
(5.25)
b 19 2006 il /S 92 05
92 Variance reduction
1
2
3
4
5
6
Y
0 0.8
0.6
0.40.2
X
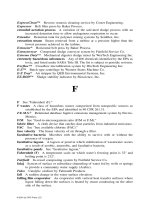
Figure 5.2 An example where X is a good stratification but poor control variable
The first term on the right-hand side of Equation (5.25) is the amount of variance removed
from the naive estimator using proportional sampling. The second term is the residual
variance after doing so. If proportional sampling is used (it is often more convenient than
optimum sampling which requires estimation of the stratum variances
2
i
through some
pilot runs), then we choose a stratification variable that tends to minimize the residual
variance or equivalently one that tends to maximize Var
X
EY
X
.
Equation (5.25) shows that with a fine enough proportional stratification, all the
variation in Y that is due to the variation in EY
X can be removed, leaving only the
residual variation E
X
2
Y
X
. This is shown in Figure 5.2 where a scatter plot of
500 realizations of X Y demonstrates that most of the variability in Y will be removed
through fine stratification. It is important to note that it is not just variation in the linear
part of EY
X
that is removed, but all of it.
5.3.1 A stratification example
Suppose we wish to estimate
= E W
1
+W
2
5/4
where W
1
and W
2
are independently distributed Weibull variates with density
fx =
3
2
x
1/2
exp−x
3/2
on support
0
. Given two uniform random numbers R
1
and R
2
,
W
1
=
−ln R
1
2/3
W
2
=
−ln R
2
2/3
b 19 2006 il /S 93 05
Stratified sampling 93
and so a naive Monte Carlo estimate of is
Y =
−ln R
1
2/3
+
−ln R
2
2/3
5/4
A naive simulation procedure, ‘weibullnostrat’ in Appendix 5.3.1, was called to generate
20 000 independent realizations of Y (seed = 639 156) with the result
= 215843
and
ese
= 000913 (5.26)
For a stratified Monte Carlo, note that Y is monotonic in both R
1
and R
2
, so a reasonable
choice for a stratification variable is
X =R
1
R
2
This is confirmed by the scatter plot (Figure 5.2) of 500 random pairs of
X Y
. The
joint density of X and R
2
is
f
XR
2
x r
2
= f
R
1
R
2
x
r
2
r
2
r
1
x
=
1
r
2
on support 0 <x<r
2
< 1. Therefore
f
X
x
=
1
x
dr
2
r
2
=−ln x
and the cumulative distribution is
F
X
x
= x −x ln x (5.27)
on (0,1). The conditional density of R
2
given X is
f
R
2
X
r
2
x
=
f
XR
2
x r
2
f
X
x
=−
1
r
2
ln x
on support 0 <x<r
2
< 1, and the cumulative conditional distribution function is
F
R
2
X
r
2
x
=
r
2
x
du
−u ln x
= 1 −
ln r
2
ln x
(5.28)
N realizations of X Y will be generated with N strata where p
i
=1/N for i =1N.
With this design and under proportional stratified sampling there is exactly one pair
b 19 2006 il /S 94 05
94 Variance reduction
X Y
for which X ∈ S
i
for each i. Let U
i
V
i
be independently distributed as U
0 1
.
Using Equation (5.27) we generate X
i
from the ith stratum through
X
i
−X
i
ln X
i
=
i −1 +U
i
N
(5.29)
Using Equation (5.28),
ln R
i
2
ln X
i
= V
i
that is
R
i
2
= X
V
i
i
Therefore
R
i
1
=
X
i
R
i
2
Note that Equation (5.29) will need to be solved numerically, but this can be made more
efficient by observing that X
i
∈
X
i−1
1
. The ith response is
Y
i
=
−ln R
i
1
2/3
+
−ln R
i
2
2/3
5/4
and the estimate is
PS
=
N
i=1
p
i
Y
i
=
1
N
N
i=1
Y
i
To estimate Var
PS
we cannot simply use 1/N −1
N
i=1
Y
i
−
PS
2
N as the Y
i
are from different strata and are therefore not identically distributed. One approach is to
simulate K independent realizations of
as in the algorithm below:
For j = 1K do
For i = 1N do
generate u v ∼ U0 1
solve: x −ln x =
i −1 +u
N
r
2
= x
v
r
1
=
x
r
2
y
i
=
−ln r
1
2/3
+
−ln r
2
2/3
5/4
end do
y
j
=
1
N
N
i=1
y
i
end do
PS
=
1
K
K
j=1
y
j
Var
PS
=
1
K
K−1
K
j=1
y
j
−
PS
2
b 19 2006 il /S 95 05
Stratified sampling 95
Using procedure ‘weibullstrat’ in Appendix 5.3.2 with N = 100 and K = 200 (and with
the same seed as in the naive simulation), the results were
PS
= 216644
and
ese
PS
= 000132
Comparing this with Equation (5.26), stratification produces an estimated variance
reduction ratio,
vrr = 48 (5.30)
The efficiency must take account of both the variance reduction ratio and the relative
computer processing times. In this case stratified sampling took 110 seconds and naive
sampling 21 seconds, so
Efficiency =
21 ×4771
110
≈ 9
Three points from this example are worthy of comment:
(i) The efficiency would be higher were it not for the time consuming numerical solution
of Equation (5.29). Problem 5 addresses this.
(ii) A more obvious design is to employ two stratification variables, R
1
and R
2
.
Accordingly, the procedure ‘grid’ in Appendix 5.3.3 uses 100 equiprobable strata
ona10×10 grid on
0 1
2
, with exactly one observation in each stratum. Using
N = 200 replications (total sample size = 20 000 as before) and the same random
number stream as before, this gave
= 216710
ese
= 000251
vrr = 13
and
Efficiency ≈ 13
Compared with the improved stratification method suggested in point (i), this would
not be competitive. Moreover, this approach is very limited, as the number of strata
increases exponentially with the dimension of an integral.
(iii) In the example it was fortuitous that it was easy to sample from both the distribution
of the stratification variable X and from the conditional distribution of Y given X.
In fact, this is rarely the case. However, the following method of post stratification
avoids these problems.
b 19 2006 il /S 96 05
96 Variance reduction
5.3.2 Post stratification
This refers to a design in which the number of observations in each stratum is counted
after naive sampling has been performed. In this case n
i
will be replaced by
N
i
to
emphasize that N
i
are now random variables (with expectation
Np
i
). A naive estimator is
=
M
i=1
N
i
N
Y
i
but this takes no account of the useful information available in the
p
i
. Post (after)
stratification uses
AS
=
M
i=1
p
i
Y
i
conditional on no empty strata. The latter is easy to arrange with sufficiently large
Np
i
.
The naive estimator assigns equal weight 1/N to each realization of the response Y ,
whereas
AS
assigns more weight p
i
/N
i
to those observations in strata that have been
undersampled N
i
<Np
i
and less to those that have been oversampled N
i
>Np
i
.
Cochran (1977, p. 134) suggests that if E N
i
> 20 or so for all i, then the variance of
AS
differs little from that of
PS
obtained through proportional stratification with fixed
n
i
=Np
i
. Of course, the advantage of post stratification is that there is no need to sample
from the conditional distribution of Y given X, nor indeed from the marginal distribution
of X. Implementing post stratification requires only that cumulative probabilities for X
can be calculated. Given there are M equiprobable strata, this is needed to calculate
j =
MF
X
x
+1
, which is the stratum number in which a pair
x y
falls.
This will now be illustrated by estimating
= E
W
1
+W
2
+W
3
+W
4
3/2
where W
1
W
4
are independent Weibull random variables with cumulative distribution
functions 1 −exp−x
2
1 −exp−x
3
1 −exp−x
4
, and 1 −exp−x
5
respectively on
support 0 . Bearing in mind that a stratification variable is a function of other
random variables, that it should have a high degree of dependence upon the response
Y =
W
1
+W
2
+W
3
+W
4
3/2
and should have easily computed cumulative probabilities,
it will be made a linear combination of standard normal random variables. Accordingly,
define z
i
by
F
W
i
w
i
=
z
i
for i = 14 where is the cumulative normal distribution function. Then
=
0
4
4
i=1
w
i
3/2
4
i=1
f
W
i
w
i
dw
i
=
−
4
4
i=1
F
−1
W
i
z
i
3/2
4
i=1
z
i
dz
i
= E
Z∼N
0I
4
i=1
F
−1
W
i
Z
i
3/2
b 19 2006 il /S 9 05
Stratified sampling 97
where is the standard normal density. Note that an unbiased estimator is
4
i=1
F
−1
W
i
Z
i
3/2
where the
Z
i
are independently N0 1, that is the vector Z ∼ N
0 I
, where the
covariance matrix is the identity matrix I. Now
4
i=1
F
−1
W
i
Z
i
=
4
i=1
−ln
1 −
Z
i
1/
i
(5.31)
where
1
= 2
2
= 3
3
= 4
4
= 5. Using Maple a linear approximation to
Equation (5.31) is found by expanding as a Taylor series about z = 0.Itis
X
= a
0
+
4
i=1
a
i
z
i
where a
0
= 35593, a
1
= 04792, a
2
= 03396, a
3
= 02626, and a
4
= 02140. Let
X =
X
−a
0
4
i=1
a
2
i
∼ N
0 1
Since X is monotonic in X
the same variance reduction will be achieved with X as with
X
. An algorithm simulating K independent realizations, each comprising N samples of
4
i=1
F
−1
W
i
Z
i
3/2
on M equiprobable strata, is shown below:
For k = 1K do
For j = 1M do s
j
= 0 and n
j
= 0 end do
For n = 1N
generate z
1
z
2
z
3
z
4
∼ N0 1
x=
4
i=1
a
i
z
i
4
i=1
a
2
i
y=
4
i=1
F
−1
W
i
z
i
3/2
j=
M
x
+1
n
j
= n
j
+1
s
j
= s
j
+y
end do
y
k
=
1
M
M
j=1
s
j
n
j
end do
=
1
K
K
k=1
y
k
Var
=
1
K
K−1
K
k=1
y
k
−
2
b 19 2006 il /S 98 05
98 Variance reduction
4
6
8
10
12
Y
–
3– 2– 1
02
X
1
Y
Figure 5.3 An example where X is both a good stratification and control variable
Using K =50, N =400, M = 20 seed =566309 it is found that
AS
= 693055 (5.32)
and
ese
AS
= 000223
Using naive Monte Carlo with the same random number stream,
ese
= 001093
and so the estimated variance reduction ratio is
vrr = 24 (5.33)
A scatter plot of 500 random pairs of
X Y
shown in Figure 5.3 illustrates the small
variation about the regression curve EY
X
. This explains the effectiveness of the
method.
5.4 Control variates
Whereas stratified sampling exploits the dependence between a response Y and a
stratification variable X, the method of control variates exploits the correlation between
a response and one or more control variables. As before, there is a response Y from a
b 19 2006 il /S 99 05
Control variates 99
simulation and we wish to estimate = EY where
2
= VarY. Now suppose that in
the same simulation we collect additional statistics X
=
X
1
X
d
having known
mean
X
=
1
d
and that the covariance matrix for (X,Y)
is
XX
XY
XY
2
The variables X
1
X
d
are control variables. A control variate estimator
b
= Y −b
X −
X
is considered for any known vector b
=
b
1
b
d
. Now,
b
is unbiased and
Var
b
=
2
+b
XX
b −2b
XY
This is minimized when
b = b
∗
=
−1
XX
XY
(5.34)
leading to a variance of
Var
b
∗
=
2
−
XY
−1
XX
XY
=
1 −R
2
2
where R
2
is the proportion of variance removed from the naive estimator
= Y .In
practice the information will not be available to calculate Equation (5.34) so it may be
estimated as follows. Typically, there will be a sample of independent realizations of
X
k
Y
k
k= 1 N . Then
Y =
Y =
1
N
N
k=1
Y
k
X =
X =
1
N
N
k=1
X
k
Let X
ik
denote the ith element of column vector X
k
. Then an unbiased estimator of b
∗
is
b
∗
= S
−1
XX
S
XY
where the ijth element of S
XX
is
N
k=1
X
ik
−X
i
X
jk
−X
j
N −1
and the ith element of S
XY
is
N
k=1
X
ik
−X
i
Y
k
−Y
N −1
Now the estimator
b
∗
= Y −
b
∗
X −
X
(5.35)
b 19 2006 il /S 100 05
100 Variance reduction
can be used. Since
b
∗
is a function of the data, E
b
∗
X −
X
=0, and so the estimator
is biased. Fortunately, the bias is O
1/N
. Given that the standard error is O
1/
√
N
,
the bias can be neglected providing N is large enough. If this method is not suitable,
another approach is to obtain
b
∗
from a shorter pilot run (it is not critical that it deviates
slightly from the unknown b
∗
) and then to use this in a longer independent simulation
run to obtain
b
∗
. This is unbiased for all N . It is worth noting that if E
Y
X
is linear
then there is no question of any bias when there is no separate pilot run, even for small
sample sizes.
A nice feature of the control variate method is its connection with linear regression. A
regression of Y upon X takes the form
Y
k
=
0
+
X
k
+
k
where
k
are identically and independently distributed with zero mean. The predicted
value (in regression terminology) at X
∗
is the (unbiased) estimate of E
Y
X
∗
and is
given by
Y
∗
= Y +
X
∗
−X
(5.36)
where
= S
−1
XX
S
XY
However, this is just
b
∗
. This means that variance reduction can be implemented using
multiple controls with standard regression packages. Given X
k
Y
k
k=1N, the
control variate estimator is obtained by comparing Equations (5.35) and (5.36). It follows
that
b
∗
is the predicted value Y
∗
at X
∗
=
X
.
Let us investigate how the theory may be applied to the simple case where there is just
one control variable Xd=1. In this case
b
∗
=
N
k=1
x
k
−x
y
k
−y
N
k=1
x
k
−x
2
X
∗
=
X
, and
b
∗
= Y +
b
∗
X
−X
An obvious instance where d = 1 is when a stratification variable X is used as a control
variable. In the example considered in Section 5.3.1 a response was defined as
Y =
−ln R
1
2/3
+
−ln R
2
2/3
5/4
and a stratification variable as
X =R
1
R
2
b 19 2006 il /S 101 05
Conditional Monte Carlo 101
Accordingly, a control variate estimator is
b
∗
= Y +
b
∗
1
4
−
X
The effectiveness of this is given by R
2
, which is simply the squared correlation between
X and Y . A sample of 500 pairs X Y produced the scatter plot in Figure 5.2 and gave
a sample correlation of −08369. So
R
2
=
−08369
2
=0700. Therefore, the proportion
of variance that is removed through the use of this control variable is approximately
0.7 and the variance reduction ratio is approximately 1 −07
−1
= 33. Although this
is a useful reduction in variance, it does not compare well with the estimated variance
reduction ratio of 48 given in result (5.30), obtained through fine stratification of X.
The reason for this lies in the scatter plot (Figure 5.2), which shows that the regression
E Y
X is highly nonlinear. A control variable removes only the linear part of the
variation in Y .
In contrast, using the stratification variable X as a control variate in the post
stratification example considered in Section 5.3.2 will produce a variance reduction ratio
of approximately
1 −09872
2
−1
=40, 0.9872 being the sample correlation of 500 pairs
of X Y . Now compare this with the estimated variance reduction ratio of 24 given in
result (5.33) using stratification. The control variate method is expected to perform well
in view of the near linear dependence of Y upon X (Figure 5.3). However, the apparently
superior performance of the control variate seems anomalous, given that fine stratification
of X will always be better than using it as a control variate. Possible reasons for this are
that M =20 may not equate to fine stratification. Another is that K =50 is a small sample
as far as estimating the standard error is concerned, which induces a large estimated
standard error on the variance reduction ratio. This does not detract from the main point
emerging from this example. It is that if there is strong linear dependence between Y
and X, little efficiency is likely to be lost in using a control variate in preference to
stratification.
5.5 Conditional Monte Carlo
Conditional Monte Carlo works by performing as much as possible of a multivariate
integration by analytical means, before resorting to actual sampling. Suppose we wish to
estimate where
= E
g
xy
f
x y
where g is a multivariate probability density function for a random vector that can be
partioned as the row vector
X
Y
. Suppose, in addition, that by analytical means the
value of
E
r
xy
f
x y
is known where r is the conditional density of X given that Y = y. Then if h
y
is the
marginal density of Y,
= E
h
y
E
r
xy
f
x y
b 19 2006 il /S 102 05
102 Variance reduction
Accordingly, a conditional Monte Carlo estimate of is given by sampling n variates y
from h in the algorithm below:
For i = 1n
Sample y
i
∼ h
y
i
= E
r
xy
i
f
x y
i
end do
=
1
n
n
i=1
i
e.s.e.
=
n
i=1
i
−
2
n
n −1
For example, suppose a construction project has duration X where X ∼ N
2
and where the distribution of the parameters and are independently N (100,16) and
exponential, mean 4, respectively. The company undertaking the project must pay £1000
for each day (and pro rata for part days) that the project duration exceeds K days. What
is the expected cost C of delay? A naive simulation would follow the algorithm (note
that X −K
+
= max0X−K):
For i = 1ndo
Sample R ∼ U 0 1 and Z ∼N 0 1
=−4lnR
=100 +4Z
1
Sample X ∼N
2
C
i
= 1000
X −K
+
end do
C=
1
n
n
i=1
C
i
e.s.e.
C
=
n
i=1
C
i
−
C
2
n
n −1
Alternatively, using conditional Monte Carlo gives
= E
∼Exp
1/4
∼N
10016
E
X∼N
2
1000
X −K
+
Let
C
2
= E
X∼N
2
1000
X −K
+
= 1000
K
x −K
1
√
2
exp
−
1
2
x −
2
dx
= 1000
K−/
v + −K
1
√
2
exp
−
1
2
v
2
dv
b 19 2006 il /S 103 05
Problems 103
= 1000
−e
−v
2
/2
√
2
K−/
+1000
−K
−K
= 1000
K −
+ −K
−K
Accordingly, an algorithm for conditional Monte Carlo is
For i = 1n
Sample R ∼ U 0 1 and Z ∼N 0 1
=−4lnR
=100 +4Z
1
C
i
= 1000
K−
−
K−
−K
end do
C=
1
n
n
i=1
C
i
e.s.e.
C
=
n
i=1
C
i
−
C
2
n
n −1
This should give a good variance reduction. The reader is directed to Problem 8.
5.6 Problems
1. Consider the following single server queue. The interarrival times for customers are
independently distributed as U0 1. On arrival, a customer either commences service
if the server is free or waits in the queue until the server is free and then commences
service. Service times are independently distributed as U0 1. Let A
i
, S
i
denote the
interarrival times between the i −1th and ith customers and the service time of the
ith customer respectively. Let W
i
denote the waiting time (excluding service time) in
the queue for the ith customer. The initial condition is that the first customer in the
system has just arrived at time zero. Then
W
i
= max0W
i−1
+S
i−1
−A
i
for i = 25 where W
1
= 0. Write a procedure to simulate 5000 realizations of
the total waiting time in the queue for the first five customers, together with 5000
antithetic realizations.
(a) Using a combined estimator from the primary and antithetic realizations, estimate
the expectation of the waiting time of the five customers and its estimated standard
error. Estimate the variance reduction ratio.
(b) Now repeat the experiment when the service duration is U0 2. Why is the
variance reduction achieved here much better than that in (a)?
b 19 2006 il /S 104 05
104 Variance reduction
2. In order to estimate =
b
x
−1
e
−x
dx where ≤1 and b>0, an importance sampling
density gx =e
−x−b
1
x>b
is used. (The case >1 is considered in Section 5.2). Given
R ∼U0 1, show that an unbiased estimator is
=X
−1
e
−b
where X = b −ln R and
that Var
<
b
−1
e
−b
−
.
3. (This is a more difficult problem.) If X ∼N
2
then Y =expX is lognormally
distributed with mean exp +
2
/2 and variance exp
2 +
2
exp
2
−1
.
It is required to estimate the probability that the sum of n such identically and
independently lognormal distributed random variables exceeds a. A similar type
of problem arises when considering Asian financial options (see Chapter 6). Use
an importance sampling density that shifts the lognormal such that X ∼ N
2
where >. (Refer to Section 5.2.1 which describes the i.i.d. beta distributed
case.)
(a) Show that when a>nexp the upper bound on variance developed in result
(5.13) is minimized when = ln a/n.
(b) Now suppose the problem is to estimate
= E
f
n
i=1
e
X
i
−a
+
where f is the multivariate normal density N
2
I
and x
+
=max
0x
. Show
that the corresponding value of
≥ +
2
/n
satisfies
= ln
a
n
−ln
1 −
2
n
−
Run some simulations using this value of (solve numerically using Maple).
Does the suboptimal use of = ln
a/n
decrease the variance reduction ratio
appreciably?
4. (This is a more difficult problem.) Where it exists, the moment generating function
of a random variable having probability density function fx is given by
M
t
=
support
f
e
tx
fx dx
In such cases a tilted density
g x =
e
tx
fx
M
t
can be constructed. For t>0 g may be used as an importance sampling distribution
that samples more frequently from larger values of X than f .
(a) Consider the estimation of = P
n
i=1
exp
X
i
>a
where the
X
i
are
independently N
2
. Show that the tilted distribution is N
+
2
t
2
.
b 19 2006 il /S 105 05
Problems 105
Show that when a>nexp
the value of t that minimizes the bound on variance
given in result (5.13) is
t =
ln
a/n
−
2
and that therefore the method is identical to that described in Problem 3(a).
(b) Consider the estimation of = P
n
i=1
X
i
>a
where the
X
i
are independent
and follow a beta distribution with shape parameters > 1 and > 1 on
support
0 1
. Show that the corresponding value of t here is the one that
minimizes
e
−at/n
Mt
(i) Use symbolic integration and differentiation within Maple to find this value
of t when n = 12, a = 62, = 15, and = 25.
(ii) Write a Maple procedure that estimates for any > 1, > 1, n, and
a > 0. Run your simulation for the parameter values shown in Table 5.1 of
Section 5.2.1 and verify that the variance reduction achieved is of the same
order as shown there.
5. In Section 5.3.1, Equation (5.29) shows how to generate, from a cumulative
distribution function, x −x lnx on support 0 1, subject to x lying in the ith of N
equiprobable strata. This equation has to be solved numerically, which accounts for
the stratified version taking approximately four times longer than the naive Monte
Carlo version. Derive an efficient envelope rejection method that is faster than this
inversion of the distribution function. Use this to modify the procedure ‘weibullstrat’
in Appendix 5.3.2. Run the program to determine the improvement in efficiency.
6. Write a Maple procedure for the post stratification algorithm in Section 5.3.2.
Compare your estimate with the one obtained in result (5.32).
7. Suggest a suitable stratification variable for the queue simulation in Problem 1.
Write a Maple program and investigate the variance reduction achieved for different
parameter values.
8. Write procedures for naive and conditional Monte Carlo simulations to estimate the
expected cost for the example in Section 5.5. How good is the variance reduction?
9. Revisit Problem 4(b). Suggest and implement a variance reduction scheme that
combines the tilted importance sampling with post stratification.
10. Use Monte Carlo to estimate
···
D
m
j=1
m −j +1
2
x
j
dx where m is a positive
integer and
D =
x
j
j= 1m0 <x
1
< <x
m
< 1
For the case m = 10, simulate 10 000 points lying in D, and hence find a 95%
confidence interval for the integral.
b 19 2006 il /S 106 05
6
Simulation and finance
A derivative is a tradeable asset whose price depends upon other underlying variables. The
variables include the prices of other assets. Monte Carlo methods are now used routinely
in the pricing of financial derivatives. The reason for this is that apart from a few ‘vanilla’
options, most calculations involve the evaluation of high-dimensional definite integrals.
To see why Monte Carlo may be better than standard numerical methods, suppose we
wish to evaluate
I =
01
f
x
dx
where f
x
is integrable. Using the composite trapezium rule a subinterval length of h
is chosen such that
m −1
h = 1 and then f is evaluated at m equally spaced points
in
0 1
. The error in this method is O
h
2
= O
1/m
2
. Now compare this with Monte
Carlo where f is evaluated at m values of X where X ∼ U
0 1
. Here, the standard
error is a measure of the accuracy, so if
2
=Var
X∼U
01
f
X
, the error in the estimate
of I is /
√
m = O
1/
√
m
. Therefore, for large sample sizes, it is better to use the
trapezium rule. Now suppose that the integration is over the unit cube in d dimensions.
The trapezium rule will require m function evaluations to be made over a regular lattice
covering the cube. If h is again the subinterval length along any of the d axes, then
mh
d
1. The resulting error is O
h
2
= O
1/m
2/d
. However, using Monte Carlo, the
error is still O
1/
√
m
. Therefore, for d>4 and for sufficiently large m, Monte Carlo will
be better than the trapezium rule. This advantage increases exponentially with increasing
dimension. As will be seen, in financial applications a value of d = 100 is not unusual,
so Monte Carlo is the obvious choice.
This chapter provides an introduction to the use of Monte Carlo in financial applications.
For more details on the financial aspects there are many books that can be consulted,
including those by Hull (2006) and Wilmott (1998). For a state-of-the-art description of
Monte Carlo applications Glasserman (2004) is recommended.
The basic mathematical models that have been developed in finance assume an
underlying geometric Brownian motion. First the main features of a Brownian motion,
also known as a Wiener process, will be described.
Simulation and Monte Carlo: With applications in finance and MCMC J. S. Dagpunar
© 2007 John Wiley & Sons, Ltd
108 Simulation and finance
6.1 Brownian motion
Consider a continuous state, continuous time stochastic process
B
t
t≥0
where
dB =B
dt
= B
t +dt
−B
t
∼ N
0 dt
= Z
tt+dt
√
dt (6.1)
for all t. Here Z
tt+dt
∼ N
0 1
. Suppose further that the process has independent
increments. This means that if
u v
and
t s
are nonoverlapping intervals then B
v
−
B
u
and B
t
−B
s
are independently distributed. Further assume that B
0
=0. Then
the solution to Equation (6.1) is
B
t
∼ N
0t
or
B
t
=
√
tW
t
where W
t
∼N
0 1
. The process
B
t
t≥0B
0
= 0
is called a standard Brownian
motion.
Since the process has independent increments, for any t ≥s ≥ 0
B
t
=
√
sW
1
+
√
t −sW
2
(6.2)
where W
1
and W
2
are independently N
0 1
. Therefore, such a process may be simulated
in the interval
0T
by dividing it into a large number, n, of subintervals, each of length
h so that T = nh. Then according to Equation (6.2),
B
jh
= B
j −1
h
+Z
j
√
h
for j =1nwhere Z
1
Z
n
are independently distributed as N
0 1
. This provides
a realization that is a discrete approximation to the continuous time process. It is exact
at times j =0hnh. If a choice is made to interpolate at intermediate times it is an
approximation. By choosing n large enough the resulting error can be made arbitrarily
small. Now refer to Appendix 6.1. There is a procedure ‘STDNORM’ for a Box–Müller
standard normal generator (it is used in preference to ‘STATS[random,normald](1)’ as it
is somewhat faster), together with a Maple procedure, ‘Brownian’. These are used to plot
three such discrete approximations n = 10 000 to
B
t
100 ≥ t ≥0B
0
= 0
.
Now suppose that
dX
t
= dt + dB
t
(6.3)
The parameter gives the Brownian motion a drift and the parameter
> 0
scales
B
t
. Given that X
0
= x
0
the solution to this is obviously
X
t
= x
0
+t +B
t
Asset price movements 109
The process
X
t
t≥0
is called a Brownian motion (or Wiener process) with drift
and variance parameter
2
. It also has independent increments. For any t ≥s,
X
t
−X
s
∼ N
t −s
2
t −s
and the probability density of X
t
t>0, given that X
0
= x
0
is
u
x t
=
1
√
2
2
t
exp
−
1
2
x −x
0
−t
√
t
2
which is a solution to a diffusion equation
u
t
=−
u
x
+
1
2
2
2
u
x
2
6.2 Asset price movements
Suppose we wish to model the price movements over time of an asset such as a share,
interest rate, or commodity. If X
t
represents the price at time t, the most frequently
used model in finance is
dX
X
= dt + dB (6.4)
where ≥ 0. Note that the left-hand side represents the proportional change in the price
in the interval
t t +dt
.If = 0 then the solution to this is X
t
= x
s
exp
t −s
,
for t ≥ s, where x
s
is the known asset price at time s. In that case it is said that the
return in
t s
is
t −s
and that the growth rate is .
Equation (6.4) is an example of an Itô stochastic differential equation of the form
dX = a
X t
dt +b
X t
dB (6.5)
For t ≥0,
X
t
−X
0
=
t
0
a
X
u
u
du +
t
0
b
X
u
u
dB
u
(6.6)
where the second integral is known as an Itô stochastic integral. For more details on
this, see, for example, Allen (2003, Chapter 8). Now suppose that G
X
t
t
is some
function of X
t
and t, where G/X G/t, and
2
G/X
2
all exist. Then Itô’s lemma
states that the change in G in
t t +dt
is given by
dG =
G
X
dX +
G
t
dt +
1
2
b
2
2
G
X
2
dt (6.7)
An easy way to remember this is to imagine a Taylor series expansion about
X
t
t
,
G =
G
X
X +
G
t
t +
1
2
2
G
X
2
X
2
+
1
2
2
G
t
2
t
2
+
2
G
tX
t X + (6.8)
110 Simulation and finance
From Equation (6.5),
X ≈at+bB≈at+bZ
tt+t
√
t
where Z
tt+t
∼ N
0 1
.SoE
X
2
= b
2
tE
Z
2
tt+t
+o
t
= b
2
t +o
t
, and
similarly Var
X
2
=o
t
. So, in the limit,
X
2
is nonstochastic and equals b
2
dt.
Similarly, the last two terms on the right-hand side of Equation (6.8) are o
t
. Putting
these together gives Equation (6.7).
To solve Equation (6.4), rewrite as (6.5) where a
X t
= X and b
X t
= X. Let
G = ln X. Then G/X =1/X
2
G/X
2
=−1/X
2
, and G/t =0. Using Itô’s lemma,
dG =
G
X
dX +
G
t
dt +
1
2
b
2
2
G
X
2
dt
=
dX
X
−
2
X
2
dt
2X
2
=
Xdt +XdB
X
−
2
dt
2
=
−
2
2
dt +dB
Comparing this with Equation (6.3), it can be seen that
G
t
t≥0
is a Wiener process
with drift −
2
/2 and variance parameter
2
. Therefore, because any Wiener process
has independent increments, then for t ≥s,
G
t
−G
s
= ln Xt −ln Xs
= ln
Xt
Xs
∼ N
−
1
2
2
t −s
2
t −s
(6.9)
Suppose now that the asset price is known to be xs at time s. Then at a later time t, the
price will be, from Equation (6.9),
X
t
= x
s
e
Y
(6.10)
where Y ∼N
−
1
2
2
t −s
2
t −s
. Y is the return during
s t
. Therefore, given
X
s
= x
s
X
t
is lognormally distributed. Using standard results for the expectation
of a lognormal random variable,
E
X
t
X
s
= x
s
= x
s
E
e
Y
= x
s
exp
−
1
2
2
t −s
+
1
2
2
t −s
= x
s
e
t−s
Pricing simple derivatives and options 111
Therefore can be interpreted as the expected growth rate, as in the deterministic model.
It is fortuitous that the model (6.4) can be solved analytically. Frequently, stochastic
differential equations cannot. In such cases, one remedy is to simulate a sample of
paths
X
i
t
T ≥t ≥ 0
i= 1n
for Equation (6.5) and make inferences about
the distribution of X
t
, or perhaps other functionals of
X
t
T ≥t ≥ 0
, from such a
sample. A discrete approximation to one such path is obtained using Euler’s method. The
resulting difference equation is
X
j +1
h
= X
jh
+ha
X
jh
jh
+b
X
jh
jh
Z
j+1
√
h (6.11)
for j = 0m−1, where mh = T, and
Z
j
are independently N
0 1
. In addition
to errors resulting from the Euler method, it is also an approximation in the sense that it
gives the behaviour of the path at discrete times only, whereas the model is in continuous
time.
For model (6.4), an Euler approximation is unnecessary, and if we wish to see the
entire path (rather than just the terminal value X
T
Equation (6.10) would be used,
giving the difference equation
X
j +1
h
= X
jh
exp
−
1
2
2
h +
√
hZ
j+1
The stochastic process (6.4) is called a geometric Brownian motion. In Appendix 6.2
there is a procedure, ‘GeometricBrownian’, which is used to plot three independent
realizations of
X
t
10 ≥ t ≥0
where m = 2000X
0
= 100=01, and = 03.
Each realization shows how the price of an asset subject to geometric Brownian motion,
and initially costing £100, changes over the next 10 years. The asset has an expected
growth rate of 10 % per annum and a volatility (i.e. the standard deviation of return in
a year) of 30 %. In the second part of Appendix 6.2 three further plots are shown for a
similar asset, but with volatilities of 2 %, 4 %, and 8 % respectively.
6.3 Pricing simple derivatives and options
A derivative is a contract that depends in some way on the price of one or more underlying
assets. For example, a forward contract is a derivative where one party promises to pay
the other a specified amount for underlying assets at some specified time. An option
is a derivative where the two parties have certain rights, which they are not obliged to
enforce. The simplest type of options are European call and put options.
A European call option gives the holder the right (but not the obligation) to buy an
asset at a specified time T (the expiration or exercise date) for a specified price K (the
exercise or strike price). Let X be the asset price at expiry. The payoff for a European call
is therefore max
0X−K
which is written as
X −K
+
. This follows, since if X>K
then it pays the holder of the call to enforce the right to buy the asset at K and immediately
sell it in the market for X, making a profit of X −K.IfX ≤K then exercising the option
would result in a loss of K −X. In that case the holder of the call option does nothing,
giving zero profit. A put option gives the holder the right to sell the asset at the exercise
price and the payoff is therefore
K −X
+
.
112 Simulation and finance
Let VX
t
t be the price at time t of a derivative (what type has not yet been
specified) on an underlying asset with price X
t
, where dX
t
/X
t
= dt + dB.
VX
t
t is derived by constructing a portfolio, whose composition will be changed
dynamically with time by the holder of the portfolio in such a way that its return is
equal to the return on a risk-free investment. Consider such a portfolio consisting of one
derivative and − units of the asset (i.e. ‘short’ in the asset). The value of the portfolio
is therefore where
X
t
t= VX
t
t−X
t
The change in portfolio value during
t t +dt
is
d = d
V −X
Using Equations (6.4) and (6.7),
d =
V −X
X
dX +
V −X
t
dt +
1
2
2
V −X
X
2
2
X
2
dt
=
V
X
−
dX +
V
t
dt +
1
2
2
V
X
2
2
X
2
dt
By setting = V/X the risky component of d can be removed! In that case
d =
V
t
dt +
1
2
2
V
X
2
2
X
2
dt (6.12)
However, this must equal the interest on a riskless asset otherwise investors could make
a risk-free profit (an arbitrage). One of the key assumptions in derivative pricing models
is that arbitrage is not possible. The argument is that if it were possible, then market
prices would immediately adapt to eliminate such possibilities. Let r denote the risk-free
growth rate. Then
d = r dt = r
V −X
dt (6.13)
Equating (6.12) and (6.13) gives the Black–Scholes differential equation
V
t
+
1
2
2
V
X
2
2
X
2
= r
V −
V
X
X
(6.14)
It is an understatement to say that a nice feature of this equation is that it does not
contain , the expected growth rate of the asset. This is excellent since is unknown.
The theory was developed by Black, Merton, and Scholes (Black and Scholes, 1973;
Merton, 1973), and earned Merton and Scholes a Nobel prize in 1997 (Black died in
1993). The equation has to be solved subject to the boundary conditions specific to the
derivative. Note that since the derivative price will change with t, in response to changes
in the asset price, the hedging parameter will have to be updated continuously. This
balances the portfolio to produce a riskless return.
The major assumptions in the Black–Scholes model are that no arbitrage is possible,
that the asset price follows a geometric Brownian motion, that there are no transaction
costs, that the portfolio can be continually rebalanced, that the risk-free interest rate is
known during the life of the option, and that the underlying asset does not generate an
income such as a dividend (this last one is easily relaxed).
Pricing simple derivatives and options 113
6.3.1 European call
Suppose we are dealing with a European call with exercise time T and exercise price K,
and that the price of the asset at time t is known to be x
t
. Then the terminal condition
is VX
T
T= X
T
−K
+
. The solution of Equation (6.14) subject to this boundary
condition turns out to be
Vx
t
t= e
−rT−t
−
x −K
+
f
X
r
T
X
t
=x
t
x x
t
dx (6.15)
where f
X
r
T
x
t
is the density of the asset price X at expiration time T , given that the
current price is known to be x
t
and taking the expected growth rate to be r, the
risk-free interest rate. This can be verified by direct substitution into Equation (6.14).
It is worth noting that f
X
r
T
X
T
=x
T
x x
T
=
x −x
T
, a delta function, and so
from Equation (6.15) VX
T
T = X
T
−K
+
, as expected (at time T the option
will be exercised if and only if X
T
>K, making the value of the option at that time
X
T
−K
+
). For t<T it is known that the density is lognormal (see result (6.10)).
Also, note the discount factor e
−rT−t
, which makes the right-hand side of Equation (6.15)
equal to the present value of the expected payoff at expiration, assuming the asset has an
expected growth rate of r. This can be referred to as the present value of the expected
value of the payoff in a risk-neutral world.
Fortunately, Equation (6.15) can be obtained in closed form as follows. From
Equation (6.10), given that X
t
= x
t
,
X
T
= x
t
e
r−
2
/2
T−t
+Z
√
T−t
Therefore,
Vx
t
t= e
−rT−t
E
x
t
e
r−
2
/2
T−t
+z
√
T−t
−K
+
(6.16)
where is the standard normal density. Let
z
0
=
ln
K/x
t
−
r −
2
/2
T −t
√
T −t
Then
Vx
t
t= e
−rT−t
z
0
x
t
e
r−
2
/2
T−t
+Z
√
T−t
−K
e
−z
2
/2
√
2
dz
=
z
0
x
t
e
−
z−
√
T−t
2
/2
√
2
dz −K e
−rT−t
−z
0
= x
t
√
T −t +z
0
−K e
−rT−t
−z
0
= x
t
d
−K e
−rT−t
d −
√
T −t
where
d =
r +
2
/2
T −t
+ln
x
t
/K
√
T −t
114 Simulation and finance
Vx
t
t (or just c
t
for short) is the price of a call option at time t when the
current price is known to be x
t
. Now refer to Appendix 6.3. The built-in ‘blackscholes’
procedure (part of the Maple finance package) is used to calculate the price of a European
call on a share that currently at time t = 23/252 years (there are 252 trading days in a
year) has a price of £100. The original life of the option is 6 months, so T = 126/252
years. The risk-free interest rate is 5 % per annum, the volatility is 20 % per annum, and
the strike price is £97. The solution is
V
100
23
252
= £784 (6.17)
In practice, no one uses simulation to price simple (vanilla) options such as a European
call. Nevertheless, it will be instructive to write a procedure that does this, as a prelude
to simulating more complex (exotic) options, where closed-form expressions are not
available. From Equation (6.16) it is clear that
c
i
= e
−rT−t
x
t
e
r−
2
/2
T−t
+Z
i
√
T−t
−K
+
(6.18)
is an unbiased estimator of the call price at time t c
t
. Given that
Z
i
i= 1m
are
independently N
0 1
, let
c and s denote the sample mean and sample standard deviation
of
c
i
i= 1m
. Then, for m sufficiently large, a 95 % confidence interval is
c −196 s/
√
m
c +196 s/
√
m
. In Appendix 6.4, the procedure ‘BS’ provides just such
an estimate, (7.75, 7.92), which happily includes the exact value from Equation (6.17).
Note how ‘BS’ uses antithetic variates as a variance reduction device. In this case
replacing Z
i
by −Z
i
in Equation (6.18) also gives an unbiased estimator of c
t
. How
effective is the use of antithetic variates here? The correlation with the primary estimate
will be large and negative if
x
t
e
r−
2
/2
T−t
+Z
i
√
T−t
−K
+
is well approximated by
a linear function of Z. This is the case if its value is usually positive (that is true when
x
t
e
r−
2
/2
T−t
−K is sufficiently large, in which case the option is said to be deep
in the money) and when
√
T −t, the standard deviation of return in
t T
is small. An
example is shown in Appendix 6.4.
6.3.2 European put
For a European put, let p
t
denote the price of the option at time t. Now consider a
portfolio consisting at time t of one put plus one unit of the underlying asset. The value
of this at time T is maxX
T
K. This is the same as the value at time T of a portfolio
that at time t consisted of one call option (value c
t
plus an amount of cash equal to
K exp
−rT−t
. Therefore, the values of the two portfolios at time t must be equal
otherwise arbitrage would be possible. It follows that
c
t
+K e
−r
T−t
= p
t
+X
t
This result is known as put-call parity.