Báo cáo khoa hoc:" Alternative models for QTL detection in livestock. I. General introduction" pps
Bạn đang xem bản rút gọn của tài liệu. Xem và tải ngay bản đầy đủ của tài liệu tại đây (677.9 KB, 12 trang )
Original
article
Alternative
models
for
QTL
detection
in
livestock.
I.
General
introduction
Jean-Michel
Elsen
a
Brigitte
Mangin
Bruno
Goffinet
b
Didier
Boichard
Pascale
Le
Roy
a
Station
d’amélioration
génétique
des
animaux,
Institut
national
de
la
recherche
agronomique,
BP27,
31326
Auzeville,
France
b
Laboratoire
de
biométrie
et
d’intelligence
artificielle,
Institut
national
de
la
recherche
agronomique,
BP27,
31326
Auzeville,
France
!
Station
de
génétique
quantitative
et
appliquée,
Institut
national
de
la
recherche
agronomique,
78352
Jouy-en-Josas,
France
(Received
20
November
1998;
accepted
26
March
1999)
Abstract -
In
a
series
of
papers,
alternative
models
for
QTL
detection
in
livestock
are
proposed
and
their
properties
evaluated
using
simulations.
This
first
paper
describes
the
basic
model
used,
applied
to
independent
half-sib
families,
with
marker
phenotypes
measured
for
a
two
or
three
generation
pedigree
and
quantitative
trait
phenotypes
measured
only
for
the
last
generation.
Hypotheses
are
given
and
the
formulae
for
calculating
the
likelihood
are
fully
described.
Different
alternatives
to
this
basic
model
were
studied,
including
variation
in
the
performance
modelling
and
consideration
of
full-sib
families.
Their
main
features
are
discussed
here
and
their
influence
on
the
result
illustrated
by
means
of
a
numerical
example. ©
Inra/Elsevier,
Paris
QTL
detection
/
maximum
likelihood
Résumé -
Modèles
alternatifs
pour
la
détection
de
QTL
dans
les
populations
animales.
I.
Introduction
générale.
Dans
une
série
d’articles
scientifiques,
des
modèles
alternatifs
pour
la
détection
de
(aTLs
chez
les
animaux
de
ferme
sont
proposés
et
leurs
propriétés
sont
évaluées
par
simulation.
Ce
premier
article
décrit
le
modèle
de
base
utilisé,
qui
concerne
des
familles
indépendantes
de
demi-germains
de
père,
avec
des
phénotypes
marqueurs
mesurés
sur
deux
ou
trois
générations
et
des
phénotypes
quantitatifs
mesurés
seulement
sur
la
dernière
génération.
Les
hypothèses
sont
données
et
l’expression
de
la
vraisemblance
décrite
en
détail.
À
partir
de
ce
modèle
de
base,
différentes
alternatives
ont
été
étudiées,
incluant
diverses
modélisations
des
performances
et
la
prise
en
compte
de
structures
familiales
avec
de
vrais
ger-
*
Correspondence
and
reprints
E-mail:
mains.
Leurs
principales
caractéristiques
sont
décrites
et
une
illustration
est
donnée.
©
Inra/Elsevier,
Paris
détection
de
QTL
/
maximum
de
vraisemblance
1.
INTRODUCTION
Over
the
last
15
years,
tremendous
progress
has
been
achieved
in
genome
analysis
techniques
leading
to
significant
development
of
gene
mapping
in
plant
and
animal
species.
These
maps
are
powerful
tools
for
QTL
detection.
The
general
principle
for
detecting
QTL
is
that,
within
family
(half-sibs,
full-sibs
or,
when
available,
F2
or
backcrosses
from
homozygous
parental
lines),
due
to
genetic
linkage,
an
association
is
expected
between
chromosomal
segments
received
by
progenies
from
a
common
parent
and
performance
trait
distribution,
if
a
QTL
influencing
the
trait
is
located
within
or
close
to
the
traced
segment
[24,
28!.
Experiments
were
designed
to
identify
QTL
in
major
livestock
species
and
the
first
(aTLs
have
now
been
published
for
cattle
[7]
and
pigs
[1].
Following
the
early
paper
by
Neimann-Sorensen
and
Robertson
[22],
the
first
statistical
methods
used
to
analyse
these
experiments
considered
only
one
marker
at
a
time
and
were
based
on
the
analysis
of
variance
of
data
including
a
fixed
effect
for
the
marker
nested
within
sire
(the
two
levels
of
this
effect
corresponding
to
the
two
alleles
at
a
given
locus
which
a
given
sire
could
transmit
to
its
progeny).
Efforts
were
made
to
better
exploit
available
information
in
order
to
increase
the
power
of
detecting
QTL
and
estimation
behaviour.
-
A
better
identification
of
grandparental
chromosome
segments
transmit-
ted
by
the
parent
was
achieved
using
interval
mapping
[17]
and
further,
for
inbred
and
outbred
populations,
accounting
for
all
marker
information
on
the
corresponding
chromosome
[10,
11,
13].
-
Because
the
within-sire
allele
trait
distribution
is
a
mixture
due
to
QTL
segregation
in
the
dam
population,
detection
tests
based
on
a
comparison
of
likelihoods,
were
proposed
to
use
data
more
thoroughly
[14,
18, 27].
Intermedi-
ate
approaches
combining
linear
analysis
of
variance
and
exact
maximum
like-
lihood
were
also
suggested
to
decrease
the
amount
of
computing
required
!15!.
-
While
the
first
models
considered
families
as
independent
sets
of
data,
recent
papers
have
shown
how
to
include
pedigree
structure
(9!.
-
The
problem
of
testing
for
more
than
one
QTL
segregating
on
a
chromo-
some
has
been
dealt
with
by
different
authors
in
the
simpler
plant
situation
[12]
but
no
final
conclusions
have
yet
been
reached,
in
particular
due
to
the
lack
of
theory
concerning
the
rejection
threshold
when
testing
in
this
multi-QTL
context,
as
compared
to
the
single
QTL
case
[17,
23!.
In
developing
software
for
analysing
data
from
QTL
detection
designs
in
livestock,
we
started
from
a
model
similar
to
the
one
proposed
by
Knott
et
al.
[15]
and
Elsen
et
al.
[4]
and
compared
alternative
solutions
for
the
estimation
of
phases
in
the
sires,
simplification
of
the
likelihood,
genetic
hypotheses
concerning
the
QTL
and
an
extension
of
the
methods
to
include
the
case
of
two
QTLs
and
a
mixture
of
full-
and
half-sib
families.
These
comparisons
and
extensions
will
be
published
in
related
papers
[8,
19,
20].
In
this
first
part,
common
hypotheses
and
notations
are
given,
as
well
as
the
argument
for
the
alternative
studied.
A
numerical
application
illustrates
how
different
conclusions
may
depend
on
the
solution
chosen.
2.
BASIC
MODEL
2.1.
Hypotheses,
notation
The
population
is
considered
as
a
set
of
independent
sire
families,
all
dams
being
themselves
unrelated
to
each
other
and
to
the
sires.
Let
i be
the
identification
of
a
family.
Thus,
the
global
likelihood
A
is
the
product
of within-
sire
likelihoods
Ai.
Let
ij
be
a
mate
(j
=
1, , n
2)
of
sire
i
(i
=
1, , n)
and
ijk
(k
=
1, ,
n2!)
the
progeny
of
dam
ij.
Available
information
consists
of
in-
dividual
phenotypes
YPijk
of
progeny
ijk
for
a
quantitative
trait
and
marker
phenotypes
of
progeny,
parents
and
grandparents
for
a
set
of
codominant
loci.
Marker
phenotypes
will
be
denoted
as
follows:
Each
pair
(e.g.
msp,
msi
2)
corresponds
to
the
two
alleles
observed
at
locus
l.
When
considering
strictly
half-sib
families,
only
one
progeny
is
measured
per
dam
(n2!
=
1),
and
the
k
index
can
be
omitted.
Marker
information
concerning
sire
i family
is
pooled
in
vector
Mi
which
includes
at
least
the
progeny
phenotypes
MPijk
-
Marker
information
concerning
sire
i progeny
and
sire
i mates
will
be
denoted
mp
i
and
md
i,
respectively.
The
vector
of
marker
information
concerning
progeny
of
dam ij
will
be noted
mpij
.
The
vector
of
information
concerning
parents
of
sire
i
will
be
denoted
masi
=
(mss
i,
mdsi)
L
marker
loci
belonging
to
a
previously
known
linkage
group
are
considered
simultaneously.
Recombination
rates
between
marker
loci
are
assumed
to
be
known
perfectly
from
previous
independent
analyses.
A
given
marker
locus
within
a
linkage
group
is
indexed
as
l.
In
the
multi-marker
phenotypes
ms
i
and
mdij
,
the
numbering
of
alleles
{1, 2}
for
each
locus
is
arbitrarily
defined.
These
multi-marker
phenotypes
may
have
different
corresponding
genotypes
hs
i
and
hdi!
with
a
given
distribution
of
alleles
on
the
two
chromosomes.
hs
i
is
an
L
x
2
matrix
{hs},
hs2},
with
the
first
column
hsi
corresponding
to
the
chromosome
transmitted
by
the
grandsire
to
the
sire,
and
the
second
column
hs?
corresponding
to
the
chromosome
transmitted
by
the
granddam
to
the
sire.
Equivalently,
hd2! _
hdi , hd? - 1.
When
available,
the
ancestry
information
concerning
the
markers
(mss
i
and
mds
i
for
the
sire
i)
may
help
determine
the
phase,
i.e.
determining
the
grandparental
origin
of
alleles
msi
l
and
msi
2.
Similarly,
msd2!
and
mddi!
may
provide
information
on
the
dam
ij
phase.
This
is
not
always
possible,
and
ancestry
information
is
not
always
available.
Under
these
circumstances,
the
hs
i
(and
hdij)
genotypes
are
only
given
as
a
probability,
using
information
from
the
progeny
and,
when
collected,
from
the
mates.
The
algebra
for
computing
this
probability
is
described
in
detail
in
the
next
section.
The
position
of
locus
l is
given
by
xi,
its
distance
in
cM
from
the
extremity
of
its
linkage
group.
At
any
position
x
within
this
group,
the
hypothesis
is
tested
that
sire
i
(in
half-sib
structure)
or
sire
i
and/or
dam
ij
(in
mixed
half/full-
sib
structure)
are
heterozygous
for
a
quantitative
gene,
QTL
X,
influencing
the
mean
of
the
trait
distribution.
In
the
case
of
half-sib
families,
this
mean
is
pil
1
or
!,i 2,
depending
on
the
grandparental
segment
1
or
2
received
from
the
sire
at
location
x.
In
the
case
of
full-sib
families,
this
mean
is ! ! 1,
pi}2, pill
or
pil2,
depending
on
the
grandparental
segments
1
or
2
received
from
the
sire
and
dam.
Given
the
sire
allele
received
at
location x
(d
i
xjk
=
1 or
2),
or
in
full-sib
families,
given
the
sire
and
dam
alleles
received
(d2!k
=
(1, 1),
(1, 2),
(2, 1)
or
(2, 2)),
the
quantitative
trait
for
progeny
ijk
is
normally
distributed
with
a
mean
p:df
jk
+
X
ijk
(3
and
a
variance
a e ,
!3
being
a
vector
of
fixed
effects
and
Xi!!
the
corresponding
incidence
vector.
In
the
following,
the
description
is
restricted
to
the
half-sib
family
structure
and
the 13
vector
is
omitted.
An
extension
to
include
a
mixed
structure
with
full-
and
half-sib
families
is
described
in
Le
Roy
et
al.
!19!.
2.2.
Likelihood
With
the
hypotheses
described
above,
and
omitting
the
k
indices,
the
likelihood
is
This
likelihood
depends
on
the
following
three
terms.
1)
The
penetrance
function
f (yp2j/d !
=
q)
which
is
conditional
on
the
q
chromosome
segment
transmitted
by
the
sire.
This
penetrance
will
be
assumed
to
be
normal.
Let
§(y;
p,
<r!)
= ,—
1
1
( ——— ) }.
This
gives
assumed
to
be
normal.
Let
ø(y;
P,
0’2)
=
rrL.
exp{
-
}.
ThIS
gIves
v 2
7
r0
’
2
B
0’
/
/(!/P!7!
=
q) =
!(ZJpijs l-!i q, !e)!
When
necessary,
the
following
alternative
parameterization
will
be
used
for
the
mean:
p
fl
1 =
Pi
+
a5 /2
and
pf2
2 =
P
i -
of /2,
a!
being
the
within
half-sib
average
effect
of
the
QTL
substitution,
denoted
as
the
QTL
substitution
effect
below.
In
the
particular
situation
where
the
QTL
has
two
isofrequent
alleles
with
an
additive
effect,
the
expected
effect
ai
at
the
exact
location
of
the
QTL
is
equal
to
half
the
genetic
difference
between
homozygous
carriers
[6].
It
must
be
emphasized
that
the
half-sib
correlation
is
accounted
for
by
estimating
within-sire
means
/t
’
or
P
i.
In
Knott
et
al.
(15!,
the
deviation
from
the
family
mean
yp2! -
2: YPij / ni
was
considered
rather
than
ypg
directly,
7
with
some
approximation
to
simplify
the
likelihood
computation
!4!.
All
these
approaches
assumed
no
relationship
between
parents
in
the
pedigree.
2)
The
transmission
probability
p(dfl
=
q/hs
i,
Mi
),
i.e.
probability
for
progeny
ij
that
it
received
from
its
sire
the
qth
chromosome
segment
including
location
x
(q
=
1
from
the
grandsire,
q
=
2
from
the
granddam).
Let y2! (hsi)
be
a
variable
indicating
the
grandparental
origin
of
marker
l for
progeny
ij
(0
unknown,
1
grand
sire,
2
grand
dam).
Let
A,
B and
C
be
three
possible
marker
alleles
for
locus
l.
!y2!
(hs
i)
is
computed
as
follows
For
progeny
ij,
let
h and l
r
be
the
closest
flanking
informative
marker
loci
to
x
E
(l,
l +
1]
(with
!y2! (hsi) !
0
and
!y2! (hsi) !
0):
II
:::;;
l <
x
<
I
+
1
!
lr.
The
recombination
rate
r(l
alb)
between
marker
loci l
a
and
16
may
be
computed
using
a
map
function.
Absence
of
interference
was
hypothesized,
allowing
use
of
the
Haldane
function.
In
this
case
r(l
a,
16)
=
2 (l -
exp{-2!x!6 -
xia !}).
p
(dfl
=
q/hsi, Mi)
is
then
computed
as
follows
The
first
case
corresponds
to
the
absence
of
recombination
between
flanking
markers,
the
second
and
third
to
one
recombination
(on
the
left
or
on
the
right
of
the
QTL)
and
the
forth
to
a
double
recombination
situation,
on
the
left
and
on
the
right
of
the
QTL.
3)
The
genotype
probability
conditional
on
the
marker
information
p(hs
il
Mi
).
In
the
case
of
half-sib
families,
marker
information
Mi
is
Mi
=
(mas
i,
msi,
md
i,
mp
i
).
Genotype
probabilities
were
computed
from
the
relation:
-
p(hs
i/
mas
i
, ms
i)
was
computed
considering
successively
each
marker
locus.
For
a
single
locus
1,
with
alleles
A,
B,
C
and
D
(or
0
when
not
measured),
possible
values
for
the
sire
genotype
were
deduced
from
phenotypic
information
as
described
in
table
L
p(hs
i/
mas
i,
ms
i)
=
0
or
1
in
the
first
five
cases
and
case
7,
0
or
1/2
for
cases
6
and
8,
0
or
1/4
for
case
9.
In
the
other
situations,
(10-13),
this
probability
depends
on
the
allele
frequencies
of
marker
I
(in
some
instances,
the
genotype
of
a
sire
without
individual
measurement
at
locus
l may
be
partially
rebuilt
from
the
progeny
information:
a
sire
with
at
least
one
progeny
AA
or
one
progeny
AC
from
a
dam
CD
is
known
to
carry
the
A
allele;
a
sire
known
to
carry
both
A
and
B
alleles
will
have,
with
a
probability
of
1/2,
either
A/B
or
B/A
genotypes
at
this
locus).
In
practice,
the
exploration
of
possible
genotypes
was
restricted
first
by
assuming
linkage
equilibrium
between
marker
loci,
second
by
not
using
marker
information
in
cases
where
the
probability
depends
on
allele
frequencies.
In
the
particular
case
where
no
information
is
available
on
the
ancestry,
p(/!.s!/?7tSt) =
(- 2 1 )Li, ’Vhsi
consistent
with
ms
i,
Li
being
the
number
of
het-
erozygous
marker
loci
for
sire
i
and
considering,
in
the
summation,
only
those
hs
i
which
are
consistent
with
ms
i.
-
P(T
npilhs
i
, md
i
).
Within
sire
genotype
and
dam
marker
phenotype,
progeny
marker
phenotypes
are
independent,
giving
The
probability
for
progeny
ij
may
be
computed
using
the
ti!
vectors
of
possible
transmission
from
its
sire
i:
t
ij
=
(!.,!.,
tt),
which
depends
on
the
!(/M,)
indicators
(tl
=
1
if !y2!(hsi)
=
l,
tl
=
2
if &dquo;
VI
(hso)
=
2,
tl.
=
1
or2if!.(!)=0).
The
following
recurrence
was
used
to
obtain
p(mpi!/hsZ,md2!):
Elements
of
this
recurrence
are
p(t2
j/ti
j 1)
which
is
simply
1 -
r(l -
1,
I)
if
ti
j
=
!7!
and
r(L - 1,
l)
if
tij !
t:jl,
and
P(!P!7!
hs
i,
mdij
)
which
is
0,
1/2
or
1
when
mdij
was
measured,
the
frequency,
in
the
dam
population,
of
the
allele
which
was
not
given
by
the
sire
in
mpi
j
when
mdZ
j
was
not
measured.
To
avoid
inaccurate
estimation
of
these
frequencies,
we
only
considered,
for
each
sire
family,
marker
loci
for
which
the
paternal
transmission
was
certain
(r
L =
I-
0).
With
this
restriction,
only
one
ti
j
is
possible
for
each
locus,
and
pl
mp
ij/
hs
i
,md
i7
) -
!plmpijltijntSi,mdi!)pltij/tij 1).
It
follows
that
the
i
dam
allele
frequencies
disappear
when
computing
the
ratio
3.
ALTERNATIVE
MODELS
The
preceding
model
was
close
to
the
models
proposed
by
Georges
et
al.
[7],
Knott
et
al.
[15]
and
Elsen
et
al.
[4]
when
searching
for
QTL
in
similar
populations.
In
related
papers
[8,
19,
21]
alternatives
to
this
model
will
be
explored,
dealing
with
the
computation
of
genotype
probabilities,
the
choice
of
the
genetic
model
and
the
study
of
mixed
half-
and
full-sib
families.
After
a
brief
description
of
these
extensions,
a
numerical
application
will
illustrate
their
properties.
3.1.
Rationale
for
the
alternatives
studied
3.1.1.
Sire
genotype
estimates
In
the
full
model
described
above,
all
possible
genotypes
for
the
sire
i were
successively
considered,
the
likelihood
Ai
being
a
weighted
sum
of
likelihoods
conditional
on
these
genotypes
hs
i.
This
may
be
very
time
consuming
for
large
linkage
groups,
since
a
maximum
of
2L
sire
genotypes
is
possible.
Another
option
could
be
to
limit
the
explored
sire
genotypes
to
the
most
probable
one
a
priori,
comparing
the
p(hs
i/
Mi
).
In
Knott
et
al.
!15!,
only
the
most
probable
sire
genotype
was
considered,
its
probability
being
estimated
in
a
simplified
way.
Alternatively,
the
sire
genotype
could
itself
be
considered
as
a
variable
to
be
optimized
as
are
the
means
and
variances.
In
our
application,
the
genotype
hs
i
should
be
attributed
to
sire
i if
This
is
the
way
mixtures
are
considered
in
the
classification
likelihood
approach
[20]:
no
credit
is
given
to
prior
information
on
sire
genotypes
(a
position
which
could
be
justified
by
a
lack
of
credibility
of
needed
hypotheses
concerning
for
instance
linkage
equilibrium
between
marker
loci).
Not
to
be
so
extreme,
we
suggest
considering
only
the
most
a
priori
probable
genotype
hs
i
in
this
optimization
of
Ai
in
hs
i
(practically,
to
restrict
the
domain
of
hs
i
to
genotypes
with
prob(hs
il
mi)
higher
than
a
minimum
value).
Finally,
an
intermediate
solution
could
be
the
maximization
of
the
joint
likelihood
of
sire
genotype
hs
i
and
observations
ypij
:
These
options
were
compared
by
Mangin
et
al.
!21!.
3.1.2.
Linear
approximation
of
the
likelihood
Within
sire
genotype,
the
offspring
trait
distribution
was
described
as
a
mixture
of
normal
distributions,
weighted
by
the
transmission
probabilities
p(dij
=
q/hsi,
Mi).
For
relatively
small
QTL
effect,
differences
in
the
means
of
these
normal
distributions
are
not
expected
to
be
high,
and
linearization
has
2
been
suggested.
It
is
supposed
that
2:p(dij
=
q/hsi, Mi)!(yp2!; !.i q, !e )
is
q=
l
2
close
to
0
(yp
ij
;
2:
p( dfj
=
q/hs
i,
Mi)pi 9,
U
2) .
The
efficiency
of
this
lineariza-
q=i
tion
has
been
studied
by
Mangin
et
al.
!21J.
3.1.3.
Modelling
QTL
allele
distribution
In
the
basic
model,
all
sires
are
assumed
to
be
heterozygous
for
a
QTL
at
location
x,
with
trait
means
in
the
daughter
lL
x
depending
on
the
d.3 -
allele
received
from
her
sire.
Twice
the
number
of
sire
means
thus
have
to
be
estimated.
Two
different
genetic
hypotheses
were
studied
by
Goffinet
et
al.
[8]
in
which
the
QTL
effect
was
considered
to be
random.
The
first
modelling
assumed
that
the
QTL
effect
is
normally
distributed
N(0,
Q
a),
with
only
one
parameter
(Q
a)
being
estimated,
potentially
increasing
the
QTL
detection
power.
This
global
approach
to
the
sire
population
is
probably
more
justified
when
the
number
of
sire
families
is
high,
since
the
sample
of
sire
families
is
representative
of
the
whole
population
of
sires.
The
second
modelling
assumed
that
two
alleles
only
are
segregating
at
the
QTL.
This
situation
is
often
hypothesized
when
testing
for
the
existence
of
a
major
gene
(e.g.
[5]).
The
most
important
feature
of
this
modelling
is
the
across-family
estimation
of
the
QTL
allele
effects,
which
makes
maximization
of
the
likelihood
more
complex
(A
i
are
no
longer
independent)
but
increases
the
power
of
the
test
in
some
cases.
3.1.4.
Heteroskedasticity
There
are
different
arguments
in
favour
of
non-equality
of
within
QTL
variance
(0
’;)
between
families.
The
most
important
is
probably
the
non-
identity
of
allele
distributions
at
other
QTLs
than
the
tested
one,
in
particular
if
some
of
them
have
major
effects
on
the
trait.
To
increase
the
robustness
of
the
method,
a
heteroskedastic
model
was
studied
by
Goffinet
et
al.
!8J,
considering
within-sire
family
variances
Qei.
3.1.5.
Full-sib
families
As
already
mentioned,
the
generalization
of
our
approach
to
populations
mixing
half-
and
full-sib
families
was
proposed
by
Le
Roy
et
al.
!19J.
In
their
modelling,
the
global
population
is
a
set
of
independent
sire
families,
each
sire
being
mated
to
independent
dams
having
more
than
one
progeny.
This
is
a
simple
representation
of
populations
used
for
QTL
detection
in
pigs
!1J.
3.2.
Example
QTLMAP,
a
program
written
in
FORTRAN,
considers
all
the
previous
alternatives.
It
is
available
on
request.
Inputs
for
this
program
include
pedigree
information,
marker
and
quantitative
genotypes
of
studied
half-
or
full-sib
families
of
the
population,
and
the
marker
map
assumed
to
be
perfectly
known
from
previous
analyses.
Outputs
are
basic
statistics
on
the
case
studied,
profile
likelihoods
along
the
explored
linkage
groups
for
different
options
concerning
the
hypotheses,
as
described
above.
As
an
illustration,
here
are
the
results
of
a
study
organized
within
the
framework
of
a
European
network
(CT940508)
and
discussed
during
two
international
seminars
on
QTL
detection
methods
(workshops
hold
in
Liege
and
Nouzilly
in
1996
and
the
1996
ISAG
meeting,
respectively).
A
summary
of
the
last
meeting
was
published
by
Bovenhuis
et
al.
!2!.
The
granddaughter
design
for
QTL
detection
in
dairy
cattle
consisted
of
20
sire
families.
The
linkage
group
comprised
nine
marker
loci
from
the
bovine
chromosome
6,
located
at
positions
0,
13,
20,
31, 41,
52,
54,
58
and
95
cM.
Ten
sets
of
quantitative
phenotypes
were
given,
five
being
simulated,
five
corresponding
to
real
data
collected
in
the
granddaughter
design.
A
detailed
description
of
the
data
is
given
by
Spelman
et
al.
!25!.
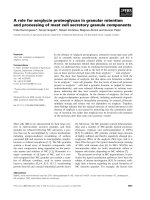
An
example
of
analysis
is
shown
in
figure
1 for
trait
4,
using
different
options
of
our
software.
In
all
these
options
the
only
sire
genotype
considered
is
the
most
probable
a
priori,
from
p(hs!/Mt).
Option
1
is
based
on
a
prior
normal
distribution
of
the
QTL
effect
while
in
other
options
within-sire
QTL
effects
(an
are
estimated
without
prior
information
on
their
distribution.
Option
2
is
based
on
the
full
within
hs
i
likelihood
but
other
options
considered
the
linear
approximation.
The
within
QTL
variance
is
unique
in
options
2
and
4,
and
depends
on
the
sire
in
options
1
and
3.
The
low
values
of
the
option
1
likelihood
ratio
test
are
linked
to
the
limited
number
of
QTL
effects
(1:
a§
versus
20:
an
estimated
in
this
case.
The
likelihood
profiles
suggest
a
QTL
between
markers
6
and
9
in
the
linear
versions,
with
flat,
non-informative,
tails.
The
non-linear
version
behaves
quite
differently
with
a
shift
of
the
maximum
towards
the
right
side
(between
markers
8
and
9)
of
the
linkage
group
and
bumps
at
the
extremities.
4.
CONCLUSION
The
main
features
of
the
models
and
test
statistics
we
compared
have
been
discussed
in
this
introduction.
The
companion
papers
[8,
19,
21!
relate
to
these
comparisons
in
detail.
Our
approach,
and
its
corresponding
software,
have
limitations
which
should
be
overcome
in
the
future.
Parents
(sires,
dams
and
possibly
grandparents)
were
assumed
to
be
unre-
lated.
This
may
not
be
essential
since
the
QTL
detection
is
mostly
based
on
within-family
analyses.
However,
this
could
cause
some
loss
of
power
for
the
test
and
of
precision
for
parameter
estimation,
in
particular
when
considering
a
distribution
for
the
QTL
effects.
Grignola
et
al.
[9]
for
instance
accounted
for
such
genetic
relationships
between
parents
in
their
modelling.
A
numerical
comparison
of
these
descriptions
is
necessary.
Our
model
is
parametric,
assuming
normality
of
the
penetrance
function.
This
is
probably
general,
but
could
be
invalid
when
a
major
QTL
is
segregating
independently
of
the
studied
linkage
group
or
when
the
trait
is
clearly
non-
normal
(discrete
or
all-or-none
trait).
A
non-parametric
approach
was
proposed
by
Kruglyak
and
Lander
[16]
and
was
generalized
by
Coppieters
et
al.
[3]
with
an
application
to
the
set
of
data
we
used
here.
It
might
be
helpful
to
merge
its
characteristics
with
the
genetic
part
of
our
model.
We
have
not
used
all
the
information
on
marker
allele
transmission:
only
unambiguous
segregation
information
was
included
in
our
likelihood.
A
more
exhaustive
use
of
this
information
has
been
proposed,
using
Monte
Carlo
Markov
chain
[26].
Such
an
approach
is
very
computationally
demanding
and,
again,
a
numerical
comparison
of
test
power
and
estimation
precision
should
be
made
to
assess
the
respective
usefulness
of
both
approaches.
ACKNOWLEDGEMENTS
The
authors
acknowledge
the
financial
support
from
the
European
Human
Capital
and
Mobility
fund
(CT940508)
and
thank
J.A.M.
van
Arendonk,
P.
Baret,
M.
Georges,
W.
Coppieters
and
W.G.
Hill
for
providing
the
data
for
our
numerical
illustration.
REFERENCES
[1]
Andersson
L.,
Haley
C.S.,
Ellegren
H.,
Knott
S.A.,
Johansson
M.
et
al.,
Genetic
mapping
of
quantitative
trait
loci
for
growth
and
fatness
in
pigs,
Science
263
(1994)
1771-1774.
[2]
Bovenhuis
H.,
Van
Arendonk
J.A.M.,
Davis
G.,
Elsen
J.M.,
Haley
C.S.,
Hill
W.G.,
Baret
P.V.,
Hetzel
J.,
Nicholas
F.W.,
Detection
and
mapping
of
quantitative
trait
loci
in
farm
animals,
Livest.
Prod.
Sci.
52
(1997)
135-144.
[3]
Coppieters
W.,
Kvasz
A.,
Farnir
F.,
Arranz
J.J.,
Grisart
B.,
Mackinnon
M.,
Georges
M.,
A
Rank-based
nonparametric
method
for
mapping
quantitative
trait
loci
in
outbred
half-sib
pedigrees:
application
to
milk
production
in
a
granddaughter
design,
Genetics
149
(1999)
1547-1555.
[4]
Elsen
J.M.,
Knott
S.A.,
Le
Roy
P.,
Haley
C.S.,
Comparison
between
some
approximate
maximum
likehood
methods
for
quantitative
trait
locus
detection
in
progeny
test
designs,
Theor.
Appl.
Genet.
95
(1997)
236-245.
[5]
Elston
R.C.,
Segregation
analysis,
in:
Mielke
J.H.,
Crawford
M.H.
(eds.),
Current
Developments
in
Anthropological
Genetics,
Plenum
Publishing
Corporation,
New
York,
1980,
pp.
327-354.
[6]
Falconer
D.S.,
Mackay
T.F.C,
Introduction
to
Quantitative
Genetics,
Long-
man,
New
York,
1996.
[7]
Georges
M.,
Nielsen
D.,
Mackinnon
M.,
Mishra
A,.
Okimoto
R.,
Pasquino
A.T.,
Sargeant
L.S.,
Sorensen
A.,
Steele
M.R.,
Zhao
X.,
Womack
J.E.,
Hoeschele
I.,
Mapping
quantitative
trait
loci
controlling
milk
production
in
dairy
cattle
by
exploiting
progeny
testing,
Genetics
139
(1995)
907-920.
[8]
Goffinet
B.,
Boichard
D.,
Le
Roy
P.,
Elsen
J.M.,
Mangin
B.,
Alternative
models
for
QTL
detection
in
livestock.
III.
Assumption
behind
the
model,
Genet.
Sel.
Evol.
31
(1999)
in
press.
[9]
Grignola
F.E.,
Hoeschele
I.,
Tier
B.,
Mapping
quantitative
trait
loci
in
outcross
populations
via
residual
maximum
likelihood.
I.
Methodology,
Genet.
Sel.
Evol.
28
(1996)
479-490.
[10]
Haley
C.S.,
Knott
S.A.,
A
simple
regression
model
for
interval
mapping
in
line
crosses,
Heredity
69
(1992)
315-324.
!11!
Haley
C.S.,
Knott
S.A.,
Elsen
J.M.,
Mapping
quantitative
trait
loci
in
crosses
between
outbred
lines
using
least
squares,
Genetics
136
(1994)
1195-1207.
[12]
Jansen
R.C.,
Interval
mapping
of
multiple
quantitative
trait
loci,
Genetics
135
(1993)
205-211.
[13]
Knapp
S.J.,
Bridges
W.C.,
Birkes
D.,
Mapping
quantitative
trait
loci
using
molecular
marker
linkage
maps,
Theor.
Appl.
Genet.
79
(1990)
583-592.
[14]
Knott
S.A.,
Haley
C.S.,
Maximum
likelihood
mapping
of
quantitative
trait
loci
using
full-sib
families,
Genetics
132
(1992)
1211-1222.
[15]
Knott
S.A.,
Elsen
J.M.,
Haley
C.S.,
Methods
for
multiple
marker
mapping
of
quantitative
trait
loci
in
half-sib
populations,
Theor.
Appl.
Genet.
93
(1996)
71-80.
[16]
Kruglyak
L.,
Lander
E.S.,
A
nonparametric
approach
for
mapping
Quantita-
tive
Trait
Loci,
Genetics
139
(1995)
1421-1428.
[17]
Lander
E.S.,
Botstein
D.,
Mapping
mendelian
factors
underlying
quantitative
traits
using
RFLP
linkage
maps,
Genetics
121
(1989)
185-199.
[18]
Le
Roy
P.,
Elsen
J.M.,
Numerical
comparison
between
powers
of
maximum
likelihood
and
analysis
of
variance
methods
for
QTL
detection
in
progeny
test
designs.
The
case
of
monogenic
inheritance,
Theor.
Appl.
Genet.
90
(1994)
65-72.
[19]
Le
Roy
P.,
Elsen
J.M.,
Boichard
D.,
Mangin
B.,
Bidanel
J.P.,
Goffinet
B.,
An
algorithm
for
QTL
detection
in
mixture
of
full
and
half-sib
families,
in:
6th
World
Congress
of
Genetic
Applied
to
Livestock
Production,
Armidale,
Australia,
11-16
January
1998,
vol.
26,
pp.
257-260.
[20]
MacLachlan
G.J.,
Basford
K.E.,
Mixture
Models.
Inference
and
Applications
to
Clustering,
Dekker
M.,
New
York,
1988.
[21]
Mangin
B.,
Goffinet
B.,
Boichard
D.,
Le
Roy
P.,
Elsen
J.M.,
Alternative
mod-
els
for
QTL
detection
in
livestock.
II.
Likelihood
approximations
and
sire
genotype
estimations,
Genet.
Sel.
Evol.
31
(1999)
225-237.
[22]
Niemann-Sorensen
A.,
Robertson
A.,
The
association
between
blood
groups
and
several
production
characteristics
in
three
Danish
cattle
breeds,
Acta
Agric.
Scand.
11
(1961)
163-196.
[23]
Rebai A.,
Goffinet
B.,
Mangin
B.,
Approximate
thresholds
of
interval
mapping
tests
for
QTL
detection,
Genetics
138
(1994)
235-240.
[24]
Soller
M.,
Genizi
A.,
The
efficiency
of
experimental
designs
for
the
detection
of
linkage
between
a
marker
locus
and
a
locus
affecting
a
quantitative
trait
in
segregating
populations,
Biometrics
34
(1978)
47-55.
[25]
Spelman
R.J.,
Coppieters
W.,
Karim
L.,
van
Arendonk
J.A.M.,
Bovenhuis
H.,
Quantitative
Trait
Loci
analysis
for
five
milk
production
traits
on
chromosome
six in
the
Dutch
Holstein-Friesian
population,
Genetics
144
(1996)
1799-1808.
[26]
Uimari
P.,
Thaller
G.,
Hoeschele
I.,
The
use
of
multiple
markers
in
a
Bayesian
method
for
mapping
Quantitative
Trait
Loci,
Genetics
143
(1996)
1831-1842.
[27]
Weller
J.L.,
Maximum
likelihood
techniques
for
the
mapping
and
analysis
of
quantitative
trait
loci
with
the
aid
of
genetic
markers,
Biometrics
42
(1986)
627-640.
[28]
Weller
J.L.,
Kashi
Y.,
Soller
M.,
Power
of
daughter
and
granddaughter
designs
for
determining
linkage
between
marker
loci
and
quantitative
trait
loci
in
dairy
cattle,
J.
Dairy
Sci.
73
(1990)
2525-2537.