Báo cáo khoa hoc:"Genetic improvement of laying hens viability using survival analysis" pps
Bạn đang xem bản rút gọn của tài liệu. Xem và tải ngay bản đầy đủ của tài liệu tại đây (363.67 KB, 18 trang )
Genet. Sel. Evol. 32 (2000) 23–40 23
c
INRA, EDP Sciences
Original article
Genetic improvement of laying hens
viability using survival analysis
Vincent DUCROCQ
a,∗
, Badi BESBES
b
, Michel PROTAIS
c
a
Institut national de la recherche agronomique, Station de g´en´etique quantitative
et appliqu´ee, 78352 Jouy-en-Josas Cedex, France
b
Hubbard-ISA Centre de S´election, BP 27, 35220 Chateaubourg, France
c
Hubbard-ISA, Le Foeil, 22800 Quintin, France
(Received 26 May 1999; accepted 22 November 1999)
Abstract – The survival of about eight generations of a large strain of laying hens was
analysed separating the rearing period (RP) from the production period (PP), after
hens were housed. For RP (respectively PP), 97.8% (resp., 94.1%) of the 109 160
(resp., 100 665) female records were censored after 106 days (resp., 313 days) on
the average. A Cox proportional hazards model stratified by flock (= season) and
including a hatch-within-flock (HWF) fixed effect seemed to reasonably fit the RP
data. For PP, this model could be further simplified to a non-stratified Weibull model.
The extension of these models to sire-dam frailty (mixed) models permitted the
estimation of the sire genetic variances at 0.261 ± 0.026 and 0.088 ± 0.010 for RP
and PP, respectively. Heritabilities on the log scale were equal to 0.48 and 0.19. Non-
additive genetic effects could not be detected. Selection was simulated by evaluating
all sires and dams, after excluding all records from the last generation. Then, actual
parents of this last generation were distributed into four groups according to their
own pedigree index. Raw survivor curves of the progeny of extreme parental groups
substantially differed (e.g., by 1.7% at 300 days for PP), suggesting that selection
based on solutions from the frailty models could be efficient, despite the very large
proportion of censored records.
survival analysis / viability / laying hens / selection
R´esum´e–Am´elioration g´en´etique de la viabilit´e des poules pondeuses `a partir
d’une analyse de survie. Les donn´ees de survie d’environ huit g´en´erations d’une
souche de grande taille de poules pondeuses ont ´et´e analys´ees en s´eparant la p´eriode
d’´elevage (PE) de la p´eriode de production (PP) apr`es la mise en cage des poules. Pour
PE (respectivement PP), 97,8 % (resp., 94,1 %) des 109 160 (resp., 100 665) perfor-
mances femelles ´etaient censur´ees, apr`es en moyenne 106 jours (resp., 313 jours). Un
mod`ele `a risques proportionnels de Cox stratifi´e par cheptel et incluant un effet fix´e
du lot de naissance intra cheptel semble d´ecrire raisonnablement bien les donn´ees de
la PE. Pour la PP, ce mod`ele peut ˆetre encore simplifi´eenunmod`ele de Weibull non
stratifi´e. En ´etendant ces mod`eles `a des mod`eles de fragilit´e (mod`eles mixtes) p`ere-
m`ere, les variances g´en´etiques
«p`eres » ont ´et´e estim´ees `a 0,261 ± 0,026 et 0,088 ±
∗
Correspondence and reprints
E-mail:
24 V. Ducrocq et al.
0,010 pour PE et PP respectivement (soit des h´eritabilit´es sur l’´echelle logarithmique
de 0,48 et 0,19). Il n’a pas ´et´e possible de d´etecter des effets g´en´etiques non additifs.
Une s´election a ´et´e simul´ee en ´evaluant tous les animaux parents, apr`es avoir exclu
les enregistrements de la derni`ere g´en´eration. Ensuite, les parents de cette derni`ere
g´en´eration ont ´et´er´epartis en quatre groupes suivant leur propre valeur g´en´etique
sur ascendance. Les courbes de survie brutes des descendants des groupes parentaux
extrˆemes diff`erent substantiellement (par exemple, de 1,7 % `a 300 jours pour PP).
Ceci sugg`ere clairement qu’une s´election bas´ee sur les solutions des mod`eles de
fragilit´e pourrait ˆetre efficace, malgr´e la proportion tr`es ´elev´ee de donn´ees censur´ees.
analyse de survie / viabilit´e / poules pondeuses / s´election
1. INTRODUCTION
For any domestic species, mortality rate is an important trait which must
be kept at a minimum. Mortality has obvious economic consequences: dead
animals are worthless, they increase replacement costs and decrease overall
performance, expressed per animal born or kept in production. From a welfare
point of view, even low mortality rates should be reduced further, as they may
reflect an inadequacy of the production system.
In poultry, mortality rates are generally low. Under controlled conditions,
average mortality is usually below 5.2% per year of egg production [21]. This
rate tends to increase [1]. Selection for lower mortality has been practised
directly or indirectly for many years, but it has not been very effective [21].
Heritability estimates for mortality of pure-line hens in single cages are typically
near zero, because the level of mortality is too low to express significant family
differences [13]. Improvement of such a trait with low incidence is a formidable
challenge to the geneticist.
The main characteristic of survival analysis is that it uses all the information
available, from dead animals as well as from animals still alive when the analysis
is performed (resulting in so-called censored records). It describes at what rate
animals are dying over time. This is in contrast with other techniques describing
survival at a given point in time, as a 0/1 trait. Survival analysis is becoming a
standard technique for the genetic analysis of length of productive life of some
species (e.g., in dairy cattle [7, 9–11]).
The aims of this study are to find a proper model for the genetic analysis of
survival data of a large strain of laying hens and to assess its potential use in
selection programs.
2. MATERIAL AND METHODS
2.1. Breeding structure
This study was based on survival information collected on a total of 130 442
birds from a commercial laying strain under selection at “Hubbard-ISA”. Only
female survival is considered here, representing 109 160 laying hens. These hens
were raised in 17 successive flocks, each one consisting of 4 to 8 hatches. Parents
of the first flocks were also added. Hence, in total, the pedigree file included
animals from 20 flocks, representing about eight generations.
Survival of laying hens 25
The total number of parents was 1 121 males and 6 479 females. On the
average, each male was mated to 6.8 females (range: 1 to 17) and had
97.4 female progeny (range: 1 to 193). Each female parent had an average
of 16.8 female progeny (range: 1 to 58).
The inbreeding coefficient of each individual in the initial data set was
computed with all the information available, that is assuming that animals of
the initial flocks (1 to 3) were unrelated. As a consequence, virtually no animal
born in flock 1 to 9 was inbred. Later, the inbreeding coefficient increased at
an approximately linear rate of +0.26% per flock (+0.61% per generation) and
reached 2.6 ± 0.8% in flock 20 for both sexes. Inbreeding was ignored in all
analyses, given its modest value and its homogeneity within a flock.
2.2. Material
For each hen, the initial data set included her date of birth, date when housed
and date of death or removal. Records of removed live animals were considered
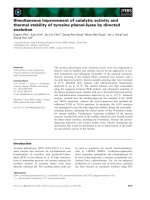
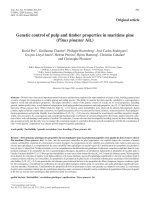
as censored. Figure 1 displays the Kaplan-Meier estimate of the (raw) survivor
curve [18] of all animals, considering birth as the initial point. The curve is
smooth but presents a change of slope at about 100 days, which coincides with
the time when the hens were housed in individual cages. A precise analysis
of the data clearly showed a different mortality rate during the two periods
separated by this event: the rearing period (RP) and the production period
(PP). Therefore, two new longevity measures were defined: length of rearing
life (LRL) where birth is considered as the initial point and animals still alive
when housed are considered as censored; and length of productive life (LPL)
starting when the hen was housed in an individual cage. LPL records of animals
removed before death were considered as censored. Figure 1 also shows that
Figure 1. Kaplan-Meier non-parametric estimate of the survival curve of the whole
population.
26 V. Ducrocq et al.
after about 500 days, the raw survivor curve was not as smooth as before. In
fact, most hatches had been terminated then and few animals (or hatches) were
still at risk. Therefore, it was decided to ignore the late period of LPL (after
400 days of production), by considering all records of animals still alive then
as censored at T = 400 days.
2.3. Models
Theory
A popular model for the analysis of survival data is the proportional hazards
model [3, 17, 20] for which the hazard function h(t; x
m
) at time t of a particular
animal m, characterised by a set of explanatory variables x
m
, is written as:
h(t; x
m
)=h
0
(t) exp{x
m
β} (1)
where h
0
(.) is called the baseline hazard function and β is a vector of regression
parameters. h
0
(.) is either completely arbitrary (in the so-called ‘Cox model’) or
may have a known parametric form. One of the most frequently used parametric
forms is the Weibull hazard function (h
0
(t)=λρ(λt)
ρ−1
, where ρ and λ are two
positive parameters). The Weibull survivor function (S(t) = exp{−(λt)
ρ
})is
a generalisation of the exponential survivor function, for which ρ = 1. The
resulting model (1) is a Weibull regression model. The term ‘proportional
hazards model’ comes from the fact that the ratio of the hazards of two animals
m and m
h(t; x
m
)
h(t; x
m
)
= exp{(x
m
− x
m
)
β} (2)
is constant over time.
If this initial model (1) is considered too restrictive for a good fit of the
data, it can be extended in several ways. The simplest one consists in defining
a different baseline hazard function h
0,n
(.) for each level (or stratum) n of a
particular factor. Again, these baseline hazard functions can be either arbitrary
(stratified Cox model) or Weibull (stratified Weibull regression model). A
careful examination of the baselines in a stratified Cox model is a way to check
the proportional hazards assumption or the validity of a Weibull model: from
each hazard function, it is possible to estimate a baseline survivor function
ˆ
S
0,n
and if a Weibull model is adequate, a plot of log(−log
ˆ
S
0,n
) vs. log t should give
a straight line. Furthermore, if these lines computed for different strata are
parallel, the proportional hazards assumption holds and a unique baseline can
be used over strata [17].
For completeness, it must be said that other generalisations of model (1)
exist. In particular, x
m
can be described as a function x
m
(t) of time t.If
x
m
(t) is piecewise constant, the proportional hazards assumption must hold
only within intervals for which x
m
(t) and x
m
(t) are constant, and no longer
on the whole time scale, from t = 0 to +∞. The inclusion of time dependent
covariates was not needed here.
A final extension of proportional hazards models is the addition of random
effects. The resulting mixed models are called ‘frailty models’ in statistics [22].
Survival of laying hens 27
We write:
h(t; x
m
, z
m
)=h
0
(t) exp{x
m
β + z
m
u}
where u is a vector of (possibly correlated) random variables with associated
incidence vector z
m
. A detailed description of mixed survival models can be
found in [8].
2.4. Model selection
A preliminary analysis was conducted to decide whether the proportional
hazards assumption was valid across flocks and hatches. Because a general
Cox model is computationally more demanding, it was also checked whether a
simplified parametric form could be retained for the baseline(s). Both for the
LRL and the LPL of an animal m, the following initial stratified Cox model
was used:
h(t; m)=h
0,n
(t) exp{b
k
} (4)
where b
k
represented the kth hatch within flock (HWF) fixed effect (k =1
to 130). The baseline h
0,n
(.) was initially stratified by hatch within a flock
(i.e., n = k). Values of log(−log
ˆ
S
0,n
(t)) were plotted against log t to decide
whether the baselines could be approximated with a Weibull baseline hazard
function. Furthermore, whenever the plot displayed parallel lines over strata,
these were grouped together by flock. Then, if parallel lines were obtained again,
stratification was ignored. All these tests are simple graphical tests. They were
preferred to formal tests because it was considered that the assumptions tested
remain approximations of the correct model (see p. 354 in [20]). The purpose
of these graphical tests is essentially to avoid substantial discrepancies which
could invalidate further inferences.
When a final model was chosen for the fixed effects part, the estimated
generalised residual [4] was computed for each animal m dying or censored at
time y
m
as:
ˆe
m
=
y
m
0
ˆ
h
0,n
(t) exp{
ˆ
b
k
}dt (5)
If the proportional hazards model is correct, the true values of these
generalised residuals should follow a (censored) unit exponential distribution
[5]. Hence, a plot of the sorted ˆe
m
’s against the expected order statistics of a
censored unit exponential distribution should display a straight line with slope
1 and going through the origin.
2.5. Genetic model
To account for genetic effects, the previously selected fixed effects models
for LRL and LPL were extended to mixed models as:
h(t; m)=h
0,n
(t) exp{b
k
+ s
i
+ d
j
} (6)
where i and j are the sire and the dam of animal m and s
i
and d
j
the
corresponding sire and dam effects. If these effects are grouped together into a
28 V. Ducrocq et al.
vector g of genetic effects, and if only additive genetic effects influence longevity,
then under polygenic inheritance g follows a multivariate normal distribution:
g ∼ MVN(0, Aσ
2
g
) (7)
where A is the additive genetic relationship between all male and female
parents.
However, non-additive effects may exist, biasing the estimation of σ
2
g
[23].
Such effects are likely to mainly influence covariances between full-sibs. To get
unbiased additive genetic effects and to assess the importance of non-additive
effects, the following model was used:
h(t; m)=h
0,n
(t) exp{b
k
+ s
i
+ d
j
+ c
ij
} (8)
where c
ij
represents a full-sib effect, characteristic of progeny of the mating
pair (i, j). For technical reasons, these full-sib effects were assumed to be
iid log-gamma distributed with a mean equal to 1, that is depending on a
unique parameter γ. The choice of a log-gamma distribution for random effects
in mixed survival models (or, equivalently, of a gamma distribution for the
frailty term exp{c
ij
}) is usual in frailty models, because of their flexibility and
mathematical convenience [2, 6, 10, 19, 20]. A normal distribution for c
ij
would
have been probably more intuitive in an animal breeding context, but it must
be noted that when γ becomes large, the log-gamma distribution tends to a
normal distribution [10, 17] and the two alternatives are then similar. The
variance of the full-sib effect is equal to Ψ
(1)
(γ), where Ψ
(1)
(.) is the trigamma
function. For large γ’s, this variance is approximately equal to γ
−1
.
The sire (or dam) variance σ
2
g
as well as the γ parameter of the log-gamma
distribution of c
ij
were estimated using the Bayesian approach described in [8].
Non-informative priors were used for the fixed effects and the dispersion
parameters σ
2
g
and γ. Multivariate normal (for g) and log-gamma (for c
ij
) priors
were combined with the likelihood function of the data to obtain an expression
proportional to the joint posterior density of all parameters. Whenever a Cox
model was used, the likelihood function was replaced by a partial likelihood
[3] which does not contain any information about the arbitrary baseline
hazard function. The marginal posterior density of σ
2
g
and γ was obtained
by integrating out all the other parameters. The integration was algebraic and
therefore exact in the case of the log-gamma effects c
ij
’s but was performed
using a Laplace approximation for all other parameters. In fact, only the mode
and the first three moments of σ
2
g
were computed. All technical details are
given in [8]. Computations were done using “The Survival Kit-V3.0”, a set of
Fortran programs written with animal breeding applications in mind [12].
Estimated genetic effects ˆs
i
and
ˆ
d
j
were computed assuming that the value
of σ
2
g
at the mode of the marginal posterior distribution was the correct value.
The mean values for each flock were used to estimate genetic trends.
2.6. Simulated selection
Given the relatively long period covered in the data set (about eight
generations), it was possible to retrospectively simulate selection on LRL or
Survival of laying hens 29
LPL estimated breeding values. Let P represent the set of parents of the last
(20th) flock and let GP be the set of parents of animals in P. The genetic
evaluation of all sires and dams in the GP group and their ancestors was based
on all (possibly censored) longevity records available when the mating pairs
were formed among P. This evaluation was performed using the appropriate
model and the genetic parameters obtained in the previous (global) analysis.
Pedigree values ˆs
i
for sires and
ˆ
d
j
for dams were calculated for each animal in
set P, averaging the estimated breeding values of their parents. The next step
in a selection program for longevity only would involve the choice of the best
males and the best females based on their pedigree values and the mating of the
selected animals. Here, males and females were already selected according to a
completely different criterion and they were mated irrespective of their (then
unknown) pedigree value for longevity. It was however possible to approximate
a selection step by sorting the animals in flock 20 according to the value of
0.5(ˆs
i
+
ˆ
d
j
), i.e., their pedigree value based on grand-parental breeding values
only. Using this approach, flock 20 was partitioned into 4 groups of equal size.
Each group consisted of 1 615 and 1 576 individuals, respectively, for LRL and
LPL. The Kaplan-Meier (raw) survivor curves were computed for each group
and then compared. A difference between these survivor curves would be an
indication on whether selection using the results of the survival analysis could
be efficient.
In order to check whether these observed survivor curves correspond to
the expected ones, the expected survivor curves for the extreme groups were
computed based on a development similar to Foulley [14, 15] for the prediction
of response to selection on discrete data analysed using nonlinear models. The
formula for these survivor curves is briefly outlined here (for details on the
derivation, see [14, 15]).
Consider model (3) with only one normally distributed random effect u. Let
G be a group of individuals selected based on their estimated breeding value
ˆu. For example, assume that the individuals with the largest 25% estimated
breeding values are retained, corresponding to a selection threshold τ on the
distribution of ˆu. The value of the expected survivor curve at time t of the
individuals in G raised in a particular environment characterized by the hatch
within flock effect b
k
is:
S(t |G,h
0
(.),b
k
)=
+∞
τ
S(t | h
0
(.),b
k
, ˆu) p(ˆu)dˆu
=
+∞
τ
+∞
−∞
S(t | h
0
(.),b
k
,u) p(u | ˆu)du
p(ˆu)dˆu (9)
where p(ˆu) and p(u | ˆu) are normal density functions with mean of 0 and ˆu
and variance of κ
2
σ
2
u
and (1 −κ
2
σ
2
u
), respectively, κ
2
being the accuracy of the
evaluation of u.
This formula was adapted to model (8), with an extra level of integration for
the full-sib effect c
ij
and replacing the effect u by s
i
+d
j
. It was then applied to
the extreme groups described above, using the estimated Weibull parameters
for the baseline and the average estimated hatch within flock effect in the last
flock for b
k
and replacing κ
2
by twice the average reliabilities of pedigree values
30 V. Ducrocq et al.
for the animals in P. The expected survivor curve for each group was finally
compared to the actual (Kaplan-Meier) estimate of the survivor curve.
3. RESULTS
3.1. General statistics
Mortality rate among female chicks during the rearing period was about
2.2%. In other words, 97.8% of LRL records were censored, at about 106 days
on the average. Some animals were discarded before being put into individual
cages. Among the 100 665 remaining hens, 94.1% of them were still alive when
their flock was terminated, 313 days on the average after being housed.
3.2. Choice of an adequate model
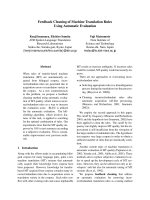
Figure 1 shows the Kaplan-Meier estimate
ˆ
S
KM
(t) of the survivor curve,
over the whole period (rearing + production). A plot of log(−log
ˆ
S
KM
(t))
against log t (Fig. 2) confirms that mortality rates were different before and
after the moment when hens were put into individual cages. Before 105 days
(i.e., log t ∼ 4.65), a linear approximation of the curve gave a slope of 1.59 (R
2
=
0.98) while after that date, the slope was 1.14 (R
2
= 0.99). Therefore, it seems
more adequate to analyse separately the rearing period and the production
period. Note that the plot appears as a step function, especially during the
rearing period, because mortalities were most often recorded on a weekly basis.
Figure 2. Graphical test of the assumption that the baseline hazard function for
the whole population is a Weibull hazard (t = time expressed in days since birth).
Figure 2 suggests that for each period, the assumption of a Weibull baseline
hazard function is plausible. To go further, the Kaplan-Meier estimates of
Survival of laying hens 31
the survivor curves for different strata were computed separately. Strata were
defined as flocks or hatches within flocks. For all strata, log(−log
ˆ
S
KM,n
(t)) was
plotted against log t, where n is the index for stratum. For LPL, t now refers to
time since housed. Straight parallel lines would simultaneously indicate that the
baseline hazard functions are Weibull hazards and that they are proportional,
for any pair of strata. This was roughly what was observed for LPL, whether
records were stratified by hatch within the flock (not shown) or simply by
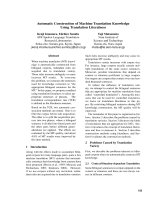
flocks (Fig. 3 – for clarity, only the last 12 flocks are represented). In contrast,
for LRL, stratification by flock (Fig. 4) suggests that the baseline survivor
functions vary across flocks and that for some flocks, the Weibull assumption
is violated. Within a flock, the log-log transformation ofthe baselines for each
hatch led to parallel lines. In other words, the appropriate models to analyse
the two longevity measures seem to be a flock-stratified Cox model for LRL
and a regular Weibull model for LPL.
Figure 3. Graphical test of the assumption that the baseline hazard functions
for survival during the production period and in different flocks are Weibull hazards
(t = time since housed, last 12 flocks represented).
The overall goodness-of-fit check using the estimated generalised residuals
ˆe
m
’s gave disappointing results: for example, a plot of the sorted residuals
for LPL against the expected order statistics of a unit (censored) exponential
distribution showed a straight line with slope 0.98 and intercept 0.0009 (when
1 and 0 were expected) and with an R
2
of 0.997 ! Such results are likely to
lead to the overoptimistic conclusion that the fit is perfect. The danger of such
an erroneous inference was already indicated by Cox and Oakes (see p. 109
in [5]) and observed in some (but not all) situations in [6]: replacing the true
generalised residuals e
m
by their computed values ˆe
m
ignores the fact that the
ˆe
m
’s are not independent, leading to a “spuriously good fit” [5]. The very large
fraction of censored records seems to make things even worse: virtually all ˆe
m
’s
are very small.
32 V. Ducrocq et al.
Figure 4. Graphical test of the assumption that the baseline hazard functions
for survival during the rearing period and in different hatches are Weibull hazards
(t = time since birth, 11 hatches from last 3 flocks represented).
3.3. Variance component estimation
The stratified Cox model for LRL and the Weibull model for LPL were
extended to frailty models including sire and dam effects. Estimates of the sire
(= dam) variance are reported in Table I. For both traits, the approximate pos-
terior densities of the sire variance were only slightly skewed. As a consequence,
the mode and the mean of these distributions were very close. A remarkable
result is that despite the very high censoring rate, the standard deviations of
the posterior densities were small: the size of the data set and the good pedigree
structure allowed a precise estimation of sire variance. Its estimate for LPL was
0.088, which corresponds to a heritability on the log scale equal to [8]:
h
2
=
4 σ
2
g
Var(log T)
=
4 σ
2
g
π
2
6
+2∗ σ
2
g
=0.193. (10)
For LRL, the sire variance was much larger. The residual variance on the
transformed scale is still
π
2
6
for the Cox model, leading to a heritability estimate
of 0.482.
These values should be interpreted with caution: they represent the her-
itability of the trait in the unrealistic ideal situation of no censoring. They
are useful to compute approximate reliabilities of estimated breeding values
using selection index theory, based on the actual number of uncensored obser-
vations [7].
As expected, the Weibull model was less computationally demanding than
the stratified Cox model (about 30 times faster with the software used).
Survival of laying hens 33
Table I. Estimates of genetic parameters.
Trait LRL
a
LPL
a
Model Cox
b
Weibull
c
+ full-sib
d
Weibull
c
+ full-sib
d
Sire (= dam) variance σ
2
g
:
Mode
e
0.260 0.261 0.216 0.088 0.077
Mean
e
0.261 0.262 0.218 0.089 0.078
Standard deviation
e
0.026 0.026 0.024 0.010 0.010
Skewness coefficient
e
0.219 0.248 0.252 0.225 0.266
Other parameters:
Heritability
f
0.482 0.482 0.390 0.194 0.167
Weibull – 1.47 ± 1.48 ± 1.64 ± 1.64 ±
parameter (ρ) 0.03 0.03 0.02 0.02
γ – – 7.7
g
– 23.1
g
CPU time
h
7 h 20 min 13 min 30 s 14 min 12 s 9 min 20 s 10 min 20 s
a
LRL (LPL): length of life during the rearing (productive) period;
b
stratified by
flock;
c
not stratified;
d
with a log-gamma full-sib effect;
e
mode and first three
moments of the approximate marginal posterior density of σ
2
g
;
f
on the log scale;
g
γ tends to +∞ (zero variance) if if is not fixed. Here, an arbitrary value (= 0.5 ˆσ
−2
g
)
was imposed;
h
indicative CPU time on an IBM Risc 595 AIX4.21.
This was mainly due to a much sparser Hessian matrix. To see whether the
refinement in the model consisting of defining a different arbitrary baseline
for each flock had an impact on the estimation of the sire variance, the same
Weibull model as for LPL was fitted to LRL data. All the characteristics of the
marginal posterior density of σ
2
g
were virtually unchanged. The heritability on
the log scale was again estimated at 0.482.
Model (6) assumes that the sire and dam effects are additive genetic effects.
Existence of non-additive effects may bias the estimation of the additive genetic
variance. Model (8) was fitted to account for any full-sib effect. This was done
for both traits assuming a Weibull baseline distribution. In such a case, when
a log-gamma distribution is chosen for the full-sib effects, these effects can be
algebraically integrated out. Unfortunately, all attempts to fit model (8) led to
estimates of γ tending towards +∞, for LPL as for LRL. This is tantamount
to a zero variance of the full-sib effect. Two interpretations are possible: either
the correct genetic model is truly additive (there is no full-sib effect) or the
amount of censoring was simply too large to allow a proper estimation of the
γ parameter. In order to roughly assess the influence of the full-sib effect on
the estimated amount of additive genetic variation, model (8) was fitted again,
arbitrarily assuming that the variance of the full-sib effect was equal to half
the additive genetic variance initially obtained with model (6). As a result, the
estimated additive genetic variances (Tab. I) were reduced by only 17% and
12% for LRL and LPL, respectively: not accounting for non-additive full-sib
variance (if such a variance exists) led to a relatively modest overestimation
of σ
2
g
.
34 V. Ducrocq et al.
3.4. Genetic evaluation, environmental effects and genetic trend
Using the modal estimates of the variance components, estimated sire and
dam effects were obtained with each model indicated in Table I.
Raw correlations between these breeding values are indicated in Table II: for
the same trait (LRL or LPL), correlations were very high (> 0.994) whatever
the pair of models considered. These correlations were even higher for males
(> 0.997) and within flock (> 0.998). On the other hand, correlations between
LRL and LPL sire and dam effects were close to 0.
Table II. Correlations between breeding values obtained with different models.
Trait LRL
a
LPL
a
Model Cox
b
Weibull
c
+ full-sib
d,g
Weibull
c
LRL Weibull 0.997
Weibull + full-sib 0.994 0.997
LPL Weibull 0.049 0.039 0.042
Weibull + full-sib
d,g
0.022 0.019 0.23 0.994
a,b,c,d,g
as in Table I.
Hatch within flock (HWF) solutions varied widely, but without any partic-
ular trend. For LRL, the standard deviation of these solutions was 0.53 with
extreme solutions at –1.73 and +1.68: the hazard ratio between extreme hatches
was equal to exp{1.68 −(−1.73)} =30.3. Some hatches had very low mortality
rates. The corresponding values for LPL were equal to 0.45 for the standard
deviation, –1.20 and +1.24 for the extreme solutions and 11.5 for the risk ratio
between extreme hatches. The correlation between LRL and LPL HWF effects
was equal to –0.095 and was not significantly different from 0.
Estimated sire and dam effects were transformed into breeding values
expressed in genetic standard deviations. Mean values per flock were very
similar for males and females. With the use of ‘correct’ models (stratified
Cox model for LRL, Weibull model for LPL), the genetic trend, obtained by
regressing these mean values on flock number, was estimated at –0.0106 and
–0.0036 additive genetic standard deviation per flock. These favourable trends
(negative values correspond to less mortality) were extremely modest. After
18 flocks, this represented a change of 0.14 ˆσ
g
and 0.06 ˆσ
g
, respectively.
3.5. Simulated selection
Parents of animals in flock 20 (that is, parents in set P) were evaluated
using only information available when mating pairs were formed. Asymptotic
standard errors were also computed. The reliabilities of the breeding values
of their own sires and dams (in GP) were on the average equal to 0.426 and
0.282 for LRL, 0.360 and 0.247 for LPL. Therefore, assuming independence of
parental breeding values, the reliabilities of pedigree values for the animals in
P were equal to 0.177 for LRL and 0.152 for LPL.
Survival of laying hens 35
Figure 5. Kaplan-Meier non-parametric estimate of the survival curve of two ex-
treme groups of animals, based on their pedigree value for survival during the rearing
period (bottom solid line: worst group; top solid line: best group; dotted lines: 95%
confidence interval for the best group).
Figure 6. Kaplan-Meier non-parametric estimate of the survival curve of two ex-
treme groups of animals, based on their pedigree value for survival during the pro-
duction period (bottom solid line: worst group; top solid line: best group; dotted lines:
95% confidence interval for the best group).
Separately for each trait, records of animals in flock 20 were distributed into
four groups, based on the sum of the pedigree values of their parents. Figures 5
and 6 represent the Kaplan-Meier estimate of the survivor curves of the top
and bottom groups. The other two groups gave intermediate results.
For LRL, the difference between the two curves was small but consistent
with the groups ranking: after about 100 days, 98.0% of the animals in the
best group were still alive. For the worst group, the survival rate was 0.3%
36 V. Ducrocq et al.
lower. However, this difference was much smaller than the confidence interval
for each curve. It was also much smaller than the expected one. Using a formula
similar to (9), a difference of 1.6% was anticipated. One interpretation is that
the average hatch with flock effect for flock 20 was somewhat inflated by an
abnormal mortality rate during the first week after birth. When the starting
point was at day 7, a difference of 0.6% in survival was predicted at 100 days of
age, closer to the observed 0.3%. The use of the actual estimate of the baseline
hazard function in (9) of the Cox model would certainly have given a better
agreement between observed and expected curves than the Weibull model used
as an approximation.
For LPL, the picture was much clearer: 300 days after being housed, 97.0%
of the hens were still alive in the best group. This percentage went down to
95.3% (–1.7%) for the worst group and the 95% confidence interval of each non-
parametric curve barely overlapped at that point. This gap between the two
extreme groups was in good agreement with the expectation (1.5% at 300 days;
Fig. 7).
Figure 7. Observed (Kaplan-Meier) and predicted survival curves of two extreme
groups of animals, during the production period (bottom solid line: worst group; top
solid line: best group; dotted lines: predicted survival curves assuming the model (8)
is correct).
4. DISCUSSION
4.1. Traits and model selection
This study clearly shows that LRL and LPL are completely different traits.
The correlations between fixed effects or between genetic effects for both
traits are virtually 0. This is not really surprising since production is not
interfering with maintenance and growth during the rearing period and there is
Survival of laying hens 37
no competition between animals when they stay in individual cages. Therefore,
it appears fully justified to analyse LRL and LPL separately.
The economic importance of each trait is of course different: a key economic
parameter for laying hens is the number of eggs laid per hen housed. Obviously,
when a significant proportion of hens die during the production period, i.e.,
when LPL is deficient, it impairs the overall performance of the flock. LRL is
probably not as essential: mortality during the rearing period only influences
the production cost of young hens. However, it can be regarded as a good
model for the study of survival in other production systems with many animals
raised together in similar conditions and with a high censoring rate, as it is
the case for broilers or turkeys. For most of the broiler breeders, liveability is
a concern due to the economic loss, especially if mortality occurs as the birds
approach market age. Presently, mortality is about 5%. This rate may however
increase due to the increasing incidence of ascites and sudden death syndrome,
as continued selection pressure is maintained for increasing rates of growth [16].
It was hoped that a careful examination of baseline survival functions and
of generalised residuals would permit a simple choice of a proper model of
analysis. Unfortunately (but perhaps not surprisingly) graphical tests and
the use of strongly correlated estimated residuals were clearly not powerful
enough to put forward a definite ‘best model’. Other techniques should be
used (crossvalidation, use of overall goodness-of-fit tests, etc) but in survival
analysis, censoring and random effects make their development more difficult.
Still, several partial conclusions may be drawn: here, our analyses did not show
any indication of a strong inadequacy of the proportional hazard model. For
LPL, a straightforward Weibull model seemed to be adequate. For LRL, the
baseline hazard functions of different flocks were not proportional and were
not perfectly approximated by the Weibull hazard function. A stratified Cox
model seemed more adequate but it was shown that genetic effects as well as
estimated genetic parameters were almost identical, whether a Cox or Weibull
model was used: once more, the Weibull frailty model appears very robust to
(small ?) departures of the baselines from the Weibull assumption. In practice,
this is important because the Weibull model is computationally much simpler:
the vector of first derivatives of the log-likelihood function is much easier to
compute and the Hessian matrix is usually very sparse.
4.2. Genetic parameters
One of the most promising features of this study is the fact that LRL
and LPL additive genetic variances could be estimated precisely, despite an
extremely high censoring rate. The two traits were heritable and the particular
pedigree structure – (almost) nested design, reasonably balanced family size,
large number of progeny per sire – permitted to reveal important genetic
differences. In contrast, non-additive genetic or non-genetic (e.g., maternal)
effects could not be evidenced. This may have been a direct consequence of
the high censoring rate and the limited full-sib group size. But even when a
substantial part of the variance was arbitrarily attributed to a full-sib effect,
the additive genetic variances for LRL and LPL remained large and genetic
trends and rankings were virtually unchanged.
38 V. Ducrocq et al.
4.3. Genetic evaluation and selection
Selection of this strain of laying hens did not include any viability trait
during the studied period. The absence of any clear genetic trend on LPL
may illustrate the independence of fitness from production traits. Another
interpretation is that only more fit animals were able to cope with more
demanding production levels and selection on production traits indirectly
prevented viability from deteriorating. The slight favourable trend for LRL
may have resulted from natural selection (animals dying during the rearing
period were obviously excluded from the breeding program) combined with
some culling before housing of apparently unhealthy young hens.
Genetic evaluation using a straightforward Weibull model was fast and
simple. If desired, a Weibull animal model can be implemented. Such an
evaluation of the 100 665 animals took about 17 min 30 s (with no calculation
of standard errors). However, compared to the sire-dam model (6), the animal
model did not have a real impact on ranking of candidates to selection.
Obviously, these candidates had censored records: their own record contained
very limited information and the correlation between their estimated breeding
values from the animal model and from their parental average using the sire-
dam model was equal to 0.996 ! In practice, the use of a simpler sire-dam model
is therefore sufficient.
Simulating selection using retrospective data gave a striking illustration of
the efficiency of the proposed model to detect genetically more viable animals
during the production period: despite a very low overall value, mortality rate
was still reduced by more than a third in the best selected group compared
with the worst one (3.0% vs. 4.7%). This reduction was in close agreement with
what was expected given the estimates of the parameters obtained. The results
for LRL were not as clear-cut, although the observed survival curve of the
animals in the best selected group was consistently higher than in the worst one.
Still, it is essential to remember that two features of this retrospective analysis
reduced the applied selection differential on both traits, compared to real life
situations: first, selection on survival was applied to animals already selected
on production traits. In practice, simultaneous selection on an aggregate value
combining breeding values for survival trait(s) and production traits would
be more efficient and would considerably enlarge the number of candidates to
selection. Second, mating pairs were already established when the simulated
selection was applied. Therefore, some of the best males for survival traits may
have been randomly mated to the worst females. Of course, selection of the
best parents before the matings would have been more efficient.
5. CONCLUSION
This study demonstrates that survival mixed models can be efficiently used
to genetically improve the viability of domestic animals, even in situations
where the overall mortality rate is very low. This seems to be particularly
the case in poultry, for which data collection is relatively easy, pedigree
structure is favourable, environmental factors are under strict control and
contemporary groups are large. Furthermore, the implementation of a routine
genetic evaluation based on survival models is clearly not computationally
Survival of laying hens 39
difficult, even on large populations. The inclusion of the results of such an
evaluation in breeding programs seems possible and is probably advisable, for
economic as well as for welfare reasons.
REFERENCES
[1] Bierdermann G., Petersen A., Lange K., Analysis of the results of random
sample tests for laying hens in Hessia during thirty years, Archiv f¨ur Gefl¨ugelkunde
61 (1997) 97–105.
[2] Clayton D.G., Cuzick J., Multivariate generalizations of the proportional haz-
ards model, J. Royal Stat. Soc., Series A 148 (1985) 82–117.
[3] Cox D.R., Regression models and life tables (with discussion), J. Royal Stat.
Soc., Series B 34 (1972) 187–220.
[4] Cox D.R., Snell E., A general definition of residuals (with discussion), J. Royal
Stat. Soc. Ser. B 30 (1968) 248–275.
[5] Cox D.R., Oakes D., Analysis of survival data, Chapman and Hall, London,
UK, 1984.
[6] Ducrocq V., An analysis of length of productive life in dairy cattle, Ph.D.
dissertation, Cornell University, Ithaca, NY, USA, 1987.
[7] Ducrocq V., Two years of experience with the French genetic evaluation of
dairy bulls on production adjusted longevity of their daughters, in: Proceedings of
the GIFT (E.U. Concerted Action on Genetic Improvement of Functional Traits)
workshop on Longevity, Jouy-en-Josas, France; Interbull Bulletin, Uppsala, Sweden,
21 (1999) 60–67.
[8] Ducrocq V., Casella G., A Bayesian analysis of mixed survival models, Genet.
Sel. Evol. 28 (1996) 505–529.
[9] Ducrocq V., Quaas R.L., Pollak E., Casella G., Length of productive life of
dairy cows. I. Justification of a Weibull model, J. Dairy Sci. 71 (1988) 3061–3070.
[10] Ducrocq V., Quaas R.L., Pollak E., Casella G., Length of productive life of
dairy cows. II. Variance component estimation and sire evaluation, J. Dairy Sci. 71
(1988) 3071–3079.
[11] Ducrocq V., S¨olkner J., Implementation of a routine breeding value evalu-
ation for longevity of dairy cows using survival analysis techniques, in: 6th World
Congress on Genetics Applied to Livestock Production, 23 (1998) 359–362; Anim.
Genetics and Breeding Unit, Univ. of New England, Armidale, Australia.
[12] Ducrocq V., S¨olkner J., “The Survival Kit – V3.0”, a package for large
analyses of survival data, in: 6th World Congress on Genetics Applied to Livestock
Production, 27 (1998) 447–448; Anim. Genetics and Breeding Unit, Univ. of New
England, Armidale, Australia.
[13] Flock D.K., Genetic and non-genetic factors determining the success of egg-
type breeding programs, in: Proceedings of 20th WPSA Congress, New Delhi, India,
1 (1996) 425–431.
[14] Foulley J.L., Prediction of selection response for threshold dichotomous traits,
Genetics 132 (1992) 1187–1194.
[15] Foulley J.L., Prediction of selection response for Poisson distributed traits,
Genet. Sel. Evol. 25 (1993) 297–303.
[16] Hunton P., Applied breeding and selection. Industrial breeding and selection,
in: Crawford R.D. (Eds.), Poultry Breeding and Genetics, Chap. 40, 1990, 1123 pp.
[17] Kalbfleisch J.D., Prentice R.L., The statistical analysis of failure time data,
John Wiley and sons, New-York, USA, 1980.
[18] Kaplan E.L., Meier P., Nonparametric estimation from incomplete observa-
tions, J. Amer. Stat. Ass. 53 (1958) 457–481.
40 V. Ducrocq et al.
[19] Klein J.P., Semiparametric estimation of random effects using the Cox model
based on the EM algorithm, Biometrics 48 (1992) 795–806.
[20] Klein J., Moeschberger M., Survival analysis, John Willey and sons, New-
York, USA, 1997.
[21] Preisinger R., Internationalisation of breeding programmes – breeding egg-
type chickens for a global market, in: 6th World Congress on Genetics Applied to
Livestock Production, 26 (1998) 135–142; Anim. Genetics and Breeding Unit, Univ.
of New England, Armidale, Australia.
[22] Vaupel J., Manton K.G., Stallard E., The impact of heterogeneity in indi-
vidual frailty and the dynamics of mortality, Demography 16 (1979) 439–454.
[23] Wei M., van der Werf J.H.J., Animal model estimation of additive and
dominance variances in egg production traits in Poultry, J. Anim. Sci. 71 (1993)
57–65.