Báo cáo khoa hoc:" Genetic diversity measures of local European beef cattle breeds for conservation purposes" pptx
Bạn đang xem bản rút gọn của tài liệu. Xem và tải ngay bản đầy đủ của tài liệu tại đây (522.56 KB, 22 trang )
Genet. Sel. Evol. 33 (2001) 311–332 311
© INRA, EDP Sciences, 2001
Original article
Genetic diversity measures of local
European beef cattle breeds
for conservation purposes
Javier C
AÑÓN
a, ∗
, Paolo A
LEXANDRINO
b
,
Isabel B
ESSA
b
, Carlos C
ARLEOS
c
, Yolanda C
ARRETERO
a
,
Susana D
UNNER
a
, Nuno F
ERRAN
b
, David G
ARCIA
a
,
Jordi J
ORDANA
d
, Denis L
ALOË
e
, Albano P
EREIRA
b
,
Armand S
ANCHEZ
d
, Katayoun M
OAZAMI
-G
OUDARZI
e
a
Laboratorio de Genética, Facultad de Veterinaria,
Universidad Complutense de Madrid, 28040 Madrid, Spain
b
Faculdade Ciencias Porto, 04021 Porto, Portugal
c
Facultad de Ciencias, Universidad de Oviedo, 33007 Oviedo, Spain
d
Facultad de Veterinaria, Universidad Autónoma de Barcelona,
08193 Bellaterra, Spain
e
Institut national de la recherche agronomique, Département de génétique animale,
78352 Jouy-en-Josas, France
(Received 4 August 2000; accepted 2 January 2001)
Abstract – This study was undertaken to determine the genetic structure, evolutionary relation-
ships, and the genetic diversity among 18 local cattle breeds from Spain, Portugal, and France
using 16 microsatellites. Heterozygosities, estimates of Fst, genetic distances, multivariate and
diversity analyses, and assignment tests were performed. Heterozygosities ranged from 0.54 in
the Pirenaica breed to 0.72 in the Barrosã breed. Seven percent of the total genetic variability
can be attributed to differences among breeds (mean F
st
= 0.07; P < 0.01). Five different
genetic distances were computed and compared with no correlation found to be significantly
different from 0 between distances based on the effective size of the population and those which
use the size of the alleles. The Weitzman recursive approach and a multivariate analysis were
used to measure the contribution of the breeds diversity. The Weitzman approach suggests
that the most important breeds to be preserved are those grouped into two clusters: the cluster
formed by the Mirandesa and Alistana breeds and that of the Sayaguesa and Tudanca breeds.
The hypothetical extinction of one of those clusters represents a 17% loss of diversity. A
correspondence analysis not only distinguished four breed groups but also confirmed results
of previous studies classifying the important breeds contributing to diversity. In addition, the
variation between breeds was sufficiently high so as to allow individuals to be assigned to their
breed of origin with a probability of 99% for simulated samples.
local beef cattle breeds / microsatellite / genetic diversity
∗
Correspondence and reprints
E-mail:
312 J. Cañón et al.
1. INTRODUCTION
During the last forty years, it has become clear that biochemical analyses
of genetic variation can provide valuable insight into the genetic structure and
evolutionary history of cattle populations. Studies have been undertaken on
a broad scale to encompass populations not only from different regions of
the globe but also at a local level among closely related populations within
particular regions [4,18,22,30,33,38]. Manwell and Baker [31] were the
first to present a phylogenetic tree for the ten major cattle breed-groups of
Europe, Western Asia, and Northern Africa. By reviewing the data on protein
polymorphism, they were able to demonstrate that it was in positive agreement
with morphological and geographical divisions of the major breed-groups.
They were not able, however, to study relationships between individual breeds.
More recently, molecular techniques have provided new markers for the
study of genetic variation [6,27,37]. Among these, microsatellites (repetitive
elements containing simple sequence motifs, usually dimers or trimers) have
quickly become the favourite agents for population genetic studies as they offer
advantages which are particularly appropriate in conservation projects. First,
they are widely available. Second, they exhibit a high degree of polymorphism.
Third, as genetic systems, they are comparatively easy to automate with the
possibility of multiplex amplification of up to five loci in a single PCR reaction
and of multiple loadings of up to fifteen loci per lane in some highly optimised
gel systems. In addition, it is assumed they are neutral to selection, the
observed genetic diversity being the consequence of two forces: genetic drift
and mutation.
In the last five years, different studies of genetic relationships between
cattle breeds using microsatellites have been published. MacHugh et al. [28]
analysed 20 microsatellites in different cattle populations from Africa, Europe,
and Asia highlighting a marked distinction between humpless (taurine) and
humped (zebu) cattle which provides strong support for the hypothesis of a
separate origin of domesticated zebu cattle. Studies aimed at characterising
relationships within the African group [45] or within the European group of
cattle breeds have focused on breeds from Italy [10], Spain [32], Belgium [36],
the British Isles [29], France [35], and Switzerland [42]. It is difficult, however,
to group the data from these studies together in order to clarify the genetic
relationships among the major types of cattle because they do not use a common
set of microsatellites. For this reason, the FAO has proposed a list of thirty
microsatellites for the analysis of genetic diversity in European cattle breeds.
The primary goal of this study is to assess the genetic variation within,
and between, breeds and groups of breeds. A secondary aim is to define
a diversity measure which will permit the ranking of breeds for conservation
purposes thus providing useful information concerning the relative contribution
Genetic diversity of local beef cattle breeds 313
to genetic diversity of 18 local cattle breeds from Spain, Portugal, and France
using 16 microsatellites (15 of which are from the FAO list).
2. MATERIALS AND METHODS
2.1. Cattle breeds
The breeds included in this study (Tab. I) are characterised by a widespread
regional distribution, small population size, and ties to traditional production
systems.
Regarding their morphological attributes, most of the breeds show pigment-
ation similar to their wild ancestor, from reddish-brown to brownish-black,
with black pigmentation restricted to the extremities (Alistana, Mirandesa,
Maronesa, Barrosã, Asturiana de los Valles, Asturiana de la Montaña, Aub-
rac). In some breeds (Tudanca, Gasconne and Bruna) red pigmentation tends
to lighten considerably as the animals age. The most commonly observed
variants are solid black (Morucha and Avileña) and red pigmentation (Retinta,
Alentejana, Pirenaica, Salers) although a colour-sided (Mertolenga) breed was
also found in this study. Most of the breeds included in the project have never
been exposed to reproductive technology or other breeding tools related to
artificial discriminative mating thus limiting the male and female gene flow
between breeds with individual dispersion only at local levels. Nevertheless,
the lack of organised studbooks, most of them created recently, for many of the
breeds has facilitated a certain degree of genetic introgression between them.
2.2. Sampling of populations
The sampling process is of great importance as it allows us to determine the
kind of inferences which can be made. In order to reflect the current genetic
composition, individuals can be considered to have been sampled at random
within-generation.
Fresh blood collected in a conservative buffer was taken from 50 individuals
(25 males and 25 females).
2.3. Genetic loci studied
The 16 microsatellite loci studied were: CSSM 66, ETH 10, ETH 152,
ETH 225, ETH 3, HEL 1, HEL 5, HEL 9, ILSTS 005, INRA 023, INRA 032,
INRA 035, INRA 037, INRA 005, INRA 063, and TGLA 44. References and
primer sequences are described in Table II. TGLA 44 is the only locus not
included in the European Concerted Action AIRE2066 list (FAO list).
314 J. Cañón et al.
Table I. Summary statisticsfor beefcattle breedsused inmicrosatellite markeranalysis
of population structure showing geographical location, sample size (N), observed (Ho)
and expected (He) heterozygosity and average number of alleles per locus (MNA).
Standard errors in parentheses.
Breed Origin N Ho He MNA
of the samples
Alistana Spain 50 0.629 (0.032) 0.681 (0.027) 6.9 (0.8)
Asturiana Montaña Spain 50 0.652 (0.037) 0.705 (0.034) 6.6 (0.7)
Asturiana Valles Spain 50 0.656 (0.045) 0.683 (0.042) 7.0 (0.7)
Sayaguesa Spain 50 0.654 (0.031) 0.707 (0.028) 6.4 (0.6)
Tudanca Spain 50 0.596 (0.040) 0.651 (0.036) 6.8 (0.8)
Avileña Negra-Ibérica Spain 50 0.589 (0.043) 0.692 (0.034) 6.9 (0.7)
Bruna del Pirineus Spain 50 0.619 (0.033) 0.672 (0.030) 7.1 (0.7)
Morucha Spain 50 0.640 (0.036) 0.709 (0.039) 6.9 (0.7)
Pirenaica Spain 50 0.543 (0.052) 0.628 (0.037) 5.8 (0.4)
Retinta Spain 50 0.614 (0.040) 0.693 (0.033) 6.8 (0.6)
Alentejana Portugal 50 0.622 (0.054) 0.655 (0.052) 5.8 (0.5)
Barrosã Portugal 50 0.716 (0.037) 0.708 (0.039) 6.7 (0.6)
Maronesa Portugal 49 0.635 (0.045) 0.664 (0.041) 6.1 (0.6)
Mertolenga Portugal 50 0.626 (0.039) 0.671 (0.035) 5.9 (0.5)
Mirandesa Portugal 50 0.625 (0.037) 0.635 (0.026) 5.5 (0.4)
Aubrac France 50 0.569 (0.043) 0.611 (0.036) 6.2 (0.6)
Gasconne France 50 0.630 (0.039) 0.708 (0.023) 7.2 (0.6)
Salers France 50 0.580 (0.046) 0.631 (0.036) 6.1 (0.6)
2.4. DNA extraction and PCR amplification
DNA was extracted using established procedures [20,41] that guarantee
long-term stability of DNA samples. Primers and Polymerase Chain Reaction
(PCR) conditions are described in Table II. The PCR analysis of microsatellites
was carried out by loading onto standard 7% polyacrilamide denaturing gel
using silver staining [2] or fluorescent-labelledPCR primer methods through an
automated DNA fragment analyser (Applied Biosystem 373 or 377). Inorder to
ensure the compatibility of results from different equipment and laboratories,
3 types of reference DNA were used: Type 1 = reference DNAs (n = 9)
from the AIRE 2006, Type 2 = reference DNA (n = 4) from this project,
Type 3 = reference DNA (n = 2) from individual laboratories. Moreover, the
accurate sizing of allele fragments of these 15 reference DNAs was checked
by each of the four laboratories involved in the study. In addition, to ensure
the compatibility of results within each laboratory, Type 3 DNAs were used as
standards for each loaded gel.
Genetic diversity of local beef cattle breeds 315
Table II. References, primer sequences, chromosomal location, mean (Hs) and total (Ht) heterozygosity and experimental parameters
for 16 microsatellite markers. (continued on the next page)
Locus Reference Primer sequences (5
–3
) Chrom. Tm MgCl
2
Cycles Detected Hs Ht
(deg) (mM) Size range (bp)
CSSM 66 Steffen et al. [46] P1: ACA CAA ATC CTT TCT GCC AGC TGA 14 55 1.5 30 209–177 0.826 0.859
P2: AAT TTA ATG CAC TGA GGA GCT TGG
ETH 10 Steffen et al. [46] P1: GTT CAG GAC TGG CCC TGC TAA CA 5 55 1.5 30 225–207 0.729 0.760
P2: CCT CCA GCC CAC TTT CTC TTC TC
ETH 152 Fries et al. [14] P1: TAC TCG TAG GGC AGG CTG CCT G 5 55 1.5 30 211–181 0.685 0.737
P2: GAG ACC TCA GGG TTG GTG ATC AG
ETH 225 Fries et al. [14] P1: GAT CAC CTT GCC ACT ATT TCC T 9 55 1.5 30 155–131 0.736 0.774
P2: ACA TGA CAG CCA GC6T GCT ACT
ETH 3 Fries et al. [14] P1: GAA CCT GCC TCT CCT GCA TTG G 19 55 1.5 30 133–109 0.723 0.772
P2: ACT CTG CCT GTG GCC AAG TAG G
HEL 1 Kaukinen P1: CAA CAG CTA TTT AAC AAG GA 15 55 1.5 30 117–103 0.641 0.681
and Varvio [23] P2: AGG CTA CAG TCC ATG GGA TT
HEL 5 Kaukinen P1: GCA GGA TCA CTT GTT AGG GA 21 55 1.5 30 171–147 0.736 0.790
and Varvio [23] P2: AGA CGT TAG TGT ACA TTA AC
HEL 9 Kaukinen P1: CCC ATT CAG TCT TCA GAG GT 8 55 1.5 30 169–143 0.750 0.818
and Varvio [23] P2: CAC ATC CAT GTT CTC ACC AC
316 J. Cañón et al.
Table II. Continued.
Locus Reference Primer sequences (5
–3
) Chrom. Tm MgCl
2
Cycles Detected Hs Ht
(deg) (mM) Size range (bp)
ILSTS 005 Brezinsky et al. [7] P1: GGA AGC AAT GAA ATC TAT AGC C 10 55 1.5 30 186–184 0.385 0.409
P2: TGT TCT GTG AGT TTG TAA GC
INRA 023 Vaiman et al. [51] P1: GAG TAG AGC TAC AAG ATA AAC TTC 3 55 1.5 30 221–197 0.776 0.865
P2: TAA CTA CAG GGT GTT AGA TGA ACT C
INRA 032 Vaiman et al. [51] P1: AAA CTG TAT TCT CTA ATA GCA C 11 55 1.5 30 190–166 0.703 0.755
P2: GCA AGA CAT ATC TCC ATT CCT TT
INRA 035 Vaiman et al. [51] P1: ATC CTT TGC AGC CTC CAC ATT G 16 55 1.5 30 114–102 0.442 0.488
P2: TTG TGC TTT ATG ACA CTA TCC G
INRA 037 Vaiman et al. [51] P1: GAT CCT GCT TAT ATT TAA CCA C 4 55 1.5 30 144–114 0.628 0.687
P2: AAA ATT CCA TGG AGA GAG AAA C
INRA 005 Vaiman et al. [50] P1: CAA TCT GCA TGA AGT ATA AAT AT 12 55 1.5 30 147–139 0.624 0.655
P2: CTT CAG GCA TAC CCT ACA CC
INRA 063 Vaiman et al. [51] P1: ATT TGC ACA AGC TAA ATC TAA CC 18 55 1.5 30 187–171 0.632 0.654
P2: AAA CCA CAG AAA TGC TTG GAA G
TGLA 44 George et al. [15] P1: AAC TGT ATA TTG AGA GCC TAC CAT G 2 55 1.5 30 178–144 0.750 0.811
P2: CAC ACC TTA GCG ACT AAA CCA CCA
Genetic diversity of local beef cattle breeds 317
2.5. Statistical analysis
The BIOSYS-1 package [47] was used to compute allele frequencies by
direct counting, as well as the number of alleles, and unbiased estimates for
expected (He) and observed (H
o
) heterozygosity.
Different genetic distances clustered into three groups were used: 1) genetic
distances considered appropriate under a pure drift model where genetic drift
was assumed to be the main factor in genetic differentiation among closely
related populations or forshort-term evolution[39,48,52] –using the traditional
differentiation-between-population estimator F
ST
[55] and the Reynolds genetic
distance estimator [39]; 2) genetic distances that assume a step-wise-mutation
model, i.e., average squared distance [16] and delta-mu squared distance [17];
3) a non-metric genetic distance based on the proportion of shared alleles [5].
All genetic distances were estimated using MICROSAT [34] except for the
Reynolds distance for which the PHYLIP package [13] was used. The product-
moment correlation (r) and Mantel test statistic were computed for pairwise
comparisons of distance matrices.
After defining groups of breeds by country or by trunk (a set of breeds with
a hypothetical common ancestor) using a priori information, a hierarchical
analysis of variance was carried out which permitted the partitioning of the
total genetic variance into components due to inter-individual differences on
the one hand and inter-breed differences on the other. Variance components
were then used to compute fixation indices [55] and their significance tested
using a non-parametric permutation approach described by Excoffier et al. [12].
Computation was carried out using the AMOVA (Analysis of Molecular Vari-
ance) programme implemented in the ARLEQUIN package [43].
2.5.1. Multivariate correspondence analysis
Phylogenetic reconstruction and the use of genetic distances do not take
into account the effects of admixtures between branches. Alternatively, the
representation of genetic relationships among a group of populations may be
obtained using multivariate techniques which can condense the information
from a large number of alleles and loci into a few synthetic variables.
Correspondence Analysis [3,26] is a multivariate method analogous to the
Principal Components analysis but which is appropriate for categorical vari-
ables and leads to a simultaneous representation of breeds and loci as a cloud
of points in a metric space. As with the Principal Components analysis, axes,
which are ranked according to their fraction of information, span this space
with each axis independent of the others. Inertia, or dispersion, measures this
information, i.e., the direction of maximum inertia is the direction in which
the cloud of points is the most scattered. The basic concept of inertia can
be related to the well-established population parameter F
ST
[19] as well as to
genetic diversity [24].
318 J. Cañón et al.
Allele frequencies of all loci were used as variables to spatially cluster the
breeds using a correspondence analysis based on Chi-square distances to judge
proximity between them.
2.5.2. Computing diversity
Following the Weitzman approach [53,54], the Reynolds genetic distances
were used to compute marginal losses of genetic diversity. After transforming
the genetic distance matrix into a distance matrix with ultrametric properties,
a maximum likelihood tree was drawn using NTSYS [40].
2.5.3. Breed assignment
The assignment of an anonymous animal i to a set of breeds, r
1
, . . . r
n
, was
based on the maximum likelihood discriminate rule, i.e., animal i was assigned
to the population which maximises the conditional probability (P[i|r]). Let
ˆ
P
r,l,a
be the frequency of allele a in the l locus and r breed, then P[i|r] =
l
h(i, l)
ˆ
P
r, l, a
il1
ˆ
P
r, l, a
il2
, where h(i, l) = 1 if a
il1
= a
il2
and h(i, l) = 2 if a
il1
=
a
il2
. When one allele was missing in a specific population, we assigned a small,
but positive, probability of the allele in this breed
1/(2n + 1)
where n was the
sample size of the breed [44]. A traditional way of expressing the significance
of a particular result is by using the log of likelihood ratio (LOD). If the interest
is to classify an anonymous sample in one of two possible populations, it is
necessary to determine the distribution of the appropriate statistic under the null
hypothesis (H
0
) by bootstrap or by simulating allele frequencies. Given that
it is not possible to directly determine the LOD distribution when many loci
are used, we simulated 100 000 genotypes per breed using allele frequencies
according to the assumptions of Hardy-Weinberg and linkage equilibrium. The
frequency at which each animal was correctly assigned to its breed provided
the probability of assignment, and the distribution of the LODs for pairs of
breeds, or populations, allowed for the construction of confidence thresholds.
3. RESULTS
3.1. Variation within, and among, populations
A total of 173 distinct alleles were detected across the 16 loci analysed. The
mean number of alleles (MNA) per locus per breed was 6.5 (Tab. I).
Observed and expected heterozygosities per breed ranged from 0.54
(Pirenaica) to 0.72 (Barrosã), and from 0.61 (Aubrac) to 0.71 (Asturiana de
Montaña, Barrosã, Morucha and Sayaguesa) respectively (Tab. I).
Genetic diversity of local beef cattle breeds 319
Levels of apparent breed differentiation were considerable with multilocus
F
ST
values indicating that around 7% of the total genetic variation correspon-
ded to differences between breeds while the remaining 93% corresponded to
differences among individuals.
Table III presents F
ST
values when breeds were considered in pairs. Genetic
differentiation values among breeds ranged from 3% for the Aubrac-Salers
pair to 15% for the Mirandesa-Tudanca pair. All values were different from 0
(P < 0.01). Values above the diagonal in Table III represent the number of
individuals between populations exchanged per generation (Nm, where N is
the total effective number of animals and m the migration rate) which balanced
the diversifying effect of the genetic drift.
The AMOVA analysis permitted the partitioning of the genetic variability
between different sources of variation – hypothetical trunks, or countries –
and breeds were the main factors in the analysis carried out in this study.
Results of the analysis of variance are shown in Table IV. Clearly, variability
(excluding individual variability) was taken into account when looking at the
breed factor leaving a low, yet significant, genetic variability (< 1.5%) at the
trunk (Tab. IVa), or country level (Tab. IVb). Less than 1.5 per cent of the total
genetic differences detected was due to the hypothetical trunk (1.43) or to the
country of origin (1.36) to which the breeds were assigned.
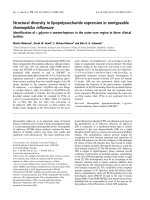
3.2. Correspondence Analysis
The first two axes contribute 14% and 13% of the total inertia respectively
(Fig. 1). The Sayaguesa breed was isolated from the others and represents
12% of the total inertia respective to the other 18 breeds. Axis 1 separates the
Mirandesa and Alistana breeds as well but shows no special proximity between
the two. Axis 2 separates two blocks: block I (Gasconne, Salers, Aubrac,
Bruna) and Block II (Mirandesa, Alistana, Sayaguesa).
The most important alleles are INRA 032 (170 bp) which contributes 17%
in Axis 1 and 9% in Axis 2, and ETH 3 (109 bp) which contributes 8% and
6% in Axis 1 and 2, respectively. Allele INRA 032 (170 bp) is a nearly unique
characteristic of the Sayaguesa breed with a frequency of 40% that was absent
in the other breeds except the Gasconne and Salers (4% and 1%, respectively).
Although this allele appeared in only 9% of the entire breed population studied,
allele ETH 3 (109 bp) can be closely associated with the Alistana and Mirandesa
breeds which demonstrated a 34% and 58% frequency, respectively.
Observing the importance of allele INRA 032 (170 bp), the analysis was
repeated excluding this microsatellite, enabling us to detect a change in the axes
– a 15% change in the first axis separating the Alistana and Mirandesa from the
other breeds and an 11% change in the second axis separating the Sayaguesa
from the others. It became clear at this point that inertia, explained by the
320 J. Cañón et al.
Table III. F
ST
estimates (below diagonal) as a measure of genetic distance between bovine breeds and the number of effective migrants
per generation (Nm) (above diagonal) in balance with genetic drift
F
ST
=
1
4Nm + 1
(Wright [55]).
Alistana
AsturMont
AsturVall
Sayaguesa
Tudanca
Alentejana
Barrosa
Maronesa
Mertolenga
Mirandesa
Aubrac
Gasconne
Salers
Avilena
Bruna
Morucha
Pirenaica
Retinta
Alistana 4.7 4.3 2.6 2.9 3.5 3.6 3.1 3.5 4.3 2.4 2.9 2.6 4.1 3.8 3.4 3.1 3.7
AsturMont 0.0502 7.5 3.8 4.0 5.1 6.1 5.7 5.4 2.6 3.5 5.7 4.0 4.5 4.7 6.7 4.1 8.6
AsturVall 0.0546 0.0321 3.2 3.4 5.0 4.1 3.8 4.7 2.4 3.2 4.9 4.1 5.1 5.7 6.6 5.1 5.5
Sayaguesa 0.0863 0.0621 0.0727 3.2 2.1 3.5 3.0 2.6 1.7 2.3 2.8 2.3 3.1 2.6 3.0 2.0 3.8
Tudanca 0.0803 0.0587 0.0680 0.0718 2.5 3.8 2.9 2.6 1.4 2.5 3.2 2.5 3.2 3.2 4.3 2.3 3.5
Alentejana 0.0659 0.0465 0.0481 0.1053 0.0909 4.1 3.6 6.2 2.3 2.4 3.0 2.4 4.2 3.3 5.0 3.1 4.9
Barrosa 0.0649 0.0394 0.0579 0.0668 0.0612 0.0575 5.3 5.6 2.2 2.3 3.5 2.3 3.7 3.4 5.3 2.6 4.6
Maronesa 0.0746 0.0421 0.0613 0.0778 0.0787 0.0652 0.0450 4.1 2.0 2.4 3.4 3.0 3.3 3.0 4.0 2.8 4.8
Mertolenga 0.0670 0.0442 0.0510 0.0862 0.0875 0.0385 0.0430 0.0570 2.5 3.0 3.7 3.2 4.1 3.8 4.9 4.2 6.2
Mirandesa 0.0548 0.0863 0.0959 0.1311 0.1478 0.0976 0.1035 0.1114 0.0901 1.8 2.1 1.8 2.8 1.9 2.1 1.9 2.5
Aubrac 0.0957 0.0673 0.0726 0.0990 0.0898 0.0930 0.0984 0.0962 0.0778 0.1207 5.7 8.5 4.6 3.2 3.6 3.9 2.9
Gasconne 0.0783 0.0421 0.0490 0.0822 0.0732 0.0778 0.0673 0.0680 0.0635 0.1062 0.0421 5.7 4.3 4.6 5.0 6.2 5.0
Salers 0.0868 0.0588 0.0572 0.0967 0.0912 0.0939 0.0986 0.0775 0.0715 0.1204 0.0286 0.0421 4.1 4.0 3.9 4.2 3.4
Avilena 0.0581 0.0528 0.0470 0.0758 0.0731 0.0563 0.0635 0.0697 0.0577 0.0829 0.0520 0.0549 0.0576 5.1 5.3 3.9 4.4
Bruna 0.0621 0.0502 0.0422 0.0889 0.0719 0.0708 0.0687 0.0781 0.0615 0.1159 0.0722 0.0515 0.0587 0.0466 5.7 6.0 4.2
Morucha 0.0694 0.0360 0.0367 0.0759 0.0550 0.0477 0.0449 0.0594 0.0490 0.1077 0.0656 0.0476 0.0608 0.0453 0.0417 3.8 5.0
Pirenaica 0.0741 0.0577 0.0468 0.1100 0.0991 0.0747 0.0875 0.0828 0.0564 0.1184 0.0596 0.0386 0.0558 0.0603 0.0398 0.0616 4.0
Retinta 0.0639 0.0434 0.0617 0.0663 0.0489 0.0516 0.0494 0.0386 0.0914 0.0797 0.0472 0.0692 0.0542 0.0565 0.0478 0.0593 0.0670
Genetic diversity of local beef cattle breeds 321
Table IV. Partitioning of genetic variability among the different sources of variation.
(a)
Source Degree Sum Variance Percentage Fixation
of variation of freedom of squares components of variation indices
Among trunks
(1)
5 311.13 0.083 1.43 F
SC
= 0.057
Among breeds 12 455.98 0.327 5.65 F
ST
= 0.071
within trunks
Within breeds 1 780 9 557.8 5.37 92.9 F
CT
= 0.014
Total 1797 10 325.8 5.78
(1)
The following 6 arbitrary trunks were defined: (Alistana AsturMont AsturVall
Tudanca Sayaguesa); (Mirandesa Barrosã Maronesa); (Aubrac Gasconne Salers);
(Bruna Pirenaica); (Retinta Alentejana Mertolenga); (Avilena Morucha).
(b)
Source Degree Sum Variance Percentage Fixation
of variation of freedom of squares components of variation indices
Among countries 2 163.3 0.079 1.36 F
SC
= 0.061
Among breeds 15 603.8 0.35 6.02 F
ST
= 0.074
within countries
Within breeds 1 780 9558.7 5.37 92.6 F
CT
= 0.014
Total 1 797 10 325.8 5.78
change from 12% to 7.2% in the Sayaguesa breed, no longer discriminated this
breed from the rest since, for example, the Mirandesa had an inertia of 9.4%.
In summary, the Sayaguesa is a breed which can be differentiated from the
others, however, this result was obviously amplified by the presence of allele
INRA 032 (170 bp) which was present in 40% of the breed and absent, or rare,
in the other breeds. Taking into account the position of the Sayaguesa breed,
we repeated the analysis excluding this breed. This caused a radical change in
the results, which created a zooming-in effect on the other 17 breeds and thus
facilitated our ability to interpret the findings.
In this case, Axis 1 explains 16% of the inertia and separates Block 1
(Gasconne, Salers, Aubrac, Pirenaica and Bruna) from Block 2 (Alistana and
Mirandesa). The alleles which contributed the most in this axis were INRA 032
(170 bp) (12% contribution) and INRA 037 (126 bp) (6% contribution), the
latter having a mean frequency of 17%. INRA 037 (126 bp) could also be
found in the Alistana and Mirandesa breeds with frequencies of 41 and 54%
respectively though these frequencies were much lower in the Gasconne (4%),
Salers (2%), Aubrac (3%), and Pirenaica (11%) breeds. Axis 2 explains 11%
322 J. Cañón et al.
·
·
·
·
·
·
·
·
·
·
·
·
·
·
·
·
·
·
1st factor (14%)
-0.5 0.0 0.5
-0
.2
0.
.0
0
.2
0
.4
Sayaguesa
Aubrac
Gasconne
Salers
Alistana
Avileña
Pirenaica
Mertolenga
Maronesa
Morucha
AsturVall
AsturMon
Alentejana
Retinta
Bruna
Tudanca
Mirandesa
Barrosã
B
3rd factor (9%)
·
·
·
·
·
-0.5 0.0 0.5
-0.6 -0.4 -0.2 0.0 0.2 0.4
Barrosã
Gasconne
Bruna
Salers
Aubrac
Morucha
Pirenaica
Tudanca
Retinta
AsturVall
AsturMon
Maronesa
Mertolenga
Avileña
Alentejana
Alistana
Mirandesa
Sayaguesa
A
2
n
d
fa
c
to
r
(1
3
%
)
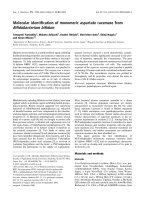
Figure 1. Correspondence analysis of allele frequencies from 16 microsatellite loci
typed in eighteen bovine breeds: A) Projection of breeds on axes 1 and 2, B) Projection
of breeds on axes 1 and 3.
of the inertia and separates the Morucha, Tudanca, and Bruna block from the
Gasconne, Salers, Aubrac and Pirenaica (excluding the Bruna) group. Axis 3
explains 10% of the inertia and singles out the Mertolenga, Barrosa, Maronesa
and Alentejana block.
Genetic diversity of local beef cattle breeds 323
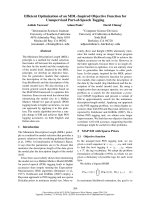
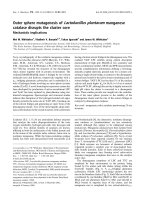
Figure 2. Tree of relationships among 18 local cattle breeds. Values in brackets
represent the loss of diversity caused by the extinction of a breed or a set of breeds.
3.3. Evaluation of diversity
In contrast to traditional hierarchical clustering methods, the use of the
concepts of link and representative elements (breeds) allows for a unique
topology [49]. The tree generated by the algorithm (Fig. 2) has the property
of a maximum evolutionary likelihood and the diversity function defined is
equal to the total branch length of the tree. The loss of diversity caused by
the extinction of a breed, or a set of breeds, can be approximately inferred
by looking at the tree or can be exactly quantified by recalculating the total
amount of diversity after eliminating the breed, or set of breeds, in question.
For instance, a value of 11 585 was found when computing the diversity of the
initial set of breeds, and it dropped down to 10 712, a 17% loss of diversity,
after the elimination of the Sayaguesa and Tudanca breeds.
3.4. Breed assignment
Results for the assignment of animals to populations using 16 microsatellites
are presented in Table V, wheretheassignment of 100 000 simulated individuals
to the breeds is shown. Misclassified individuals were distributed among all
breeds. The Sayaguesa and Mirandesa were the breeds most often correctly
classified, and the Retinta and Barrosã those most frequently misclassified.
Apart from the Salers breed in which 50% of the misclassified individuals were
assigned to the Aubrac breed, we did not observe any systematic assignment
of animals from one breed to another.
The set of markers used in this study provided a high discriminant power
between pairs of breeds: for two closely related populations as are both
324 J. Cañón et al.
Table V. Breed assignment using 16 microsatellites and the maximum likelihood classification rule for eighteen bovine breeds.
Genetic diversity of local beef cattle breeds 325
Asturiana breeds, only 1.2% of the individuals were misclassified. This can
be interpreted from a classical hypothesis testing point of view; if for a certain
anonymous sample the test “H
0
: the sample is Asturiana de Valles, H
1
: the
sample is Asturiana de Montaña” is carried out and we set a conservative
significance level (0.01), the power of the test
1 − Pr(type II error)
is 0.98.
4. DISCUSSION
Assuming that we are working with a neutral polymorphism, three forces
remain that can be used to explain the genetic diversity observed: mutation,
genetic drift, and migration. Since mutation is important only when studying
long periods of time, we accept that the forces to be considered in this sort of
study are genetic drift, the source which contributes to diversity, and migra-
tion, the opposite force which tends to homogenise the breeds. Reproductive
isolation, a consequence of the local use and management of a breed, reduces
the effective population size and contributes to a genetic subdivision that can
be detected through drift-based measures based on variations observed when
using the microsatellite loci.
The degree of genetic differentiation among the breeds studied and the
high levels of significance for the between-population F
ST
estimates indicate
a relatively low gene flow between these breeds and, equivalently, a relatively
high reproductive isolation. It is also clear that most of the genetic variation is
inter-individual and only less than seven percent of the total variation is due to
breed differences.
Migration values (Nm) can be interpreted in the context of the conservation
and maintenance of the genetic variability of an animal as the upper limit of
the number of migrants per generation which would allow for maintenance of
the genetic differentiation observed between the breeds.
Although ancestral trunks are evident in studies based on morphological
traits, e.g. Jordana et al. [21], they are not nearly as apparent when using neutral
information to assign breeds to clusters such as the Brown trunk (both Asturian
breeds, Alistana, Sayaguesa, Tudanca, etc.), Turdetanus trunk (Pirenaica and
Bruna), or Iberian trunk (Avileña and Morucha). Results of this study are
confusing since a similar magnitude of differentiation was found among breeds
within a trunk or country (5.7% and 6.1% respectively). F
SC
and F
ST
are
measures of the degree of resemblance between individuals within a breed.
This resemblance can be interpreted as the differences between individuals in
different breeds and expressed as the differences between breeds as a proportion
of the total genetic variance (F
ST
) or as a proportion of the trunk or country
variance (F
SC
). Conversely, the parameter F
CT
is a measure of the degree
of resemblance between individuals of a trunk, or country, expressed as a
proportion of the total variance. The degree of genetic differentiation among
326 J. Cañón et al.
Table VI. Randomized Mantel test statistic (Z) for distance matrix comparison.
F
ST
Allele sharing Deltamu Average
(a)
Reynolds 0.999
(b)
0.918
(b)
0.304 −0.215
F
ST
0.917
(b)
0.298 −0.223
Allele sharing 0.359 −0.142
Deltamu 0.547
(a)
Average squared distance.
(b)
Pr[random Z ≥ observed Z] < 0.01.
breeds of different trunks, or countries, was 7.1 and 7.4% respectively, values
which are very close to the global degree of genic differentiation among breeds
(F
ST
= 6.8) and which clearly show the small genetic contribution the trunk or
country factors make.
The lack of correlation between the group of genetic distance measurements
which apply under a classical random drift-mutation model and the group which
applies under the pure drift model (Tab. VI) is a consequence of the nature of
the populations included in this study which cannot be considered as separate,
closed populations. European cattle breeds must be considered to be closely
related and the main factor describing their genetic variability is random drift.
Under this assumption, genetic distances which reflect only the consequences
of the genetic drift such as the F
ST
and Reynolds distances can be considered
the most appropriate in measuring the degree of diversification [11], though
they could also be inferred comparing the heterozygosity values found with
the effective sizes of the breeds, which ranged from 21 (Sayaguesa) (Cañón,
personal communication) to over 1 400 (Aubrac, Gasconne) (Renand, personal
communication) [25].
Regarding the correspondence analysis, it should be noted that the most
significant result was the very strong separation of the Sayaguesa, though this
was dependent on the presence of a special allele. This result is obviously
not very robust. A very distinct clade is the Gasconne, Pirenaica, Salers and
Aubrac block. An Alistana and Mirandesa block was easily distinguished as
well even though these two breeds were not very close to one another. Finally,
there is the Mertolenga, Barrosa, Alentejana and Maronesa block, though it is
less homogeneous than the two cited above.
Looking at Figure 2, where the contribution of each breed to diversity and
clade is represented, it is clear that the reduction in diversity as a consequence
of the extinction of a clade equals the sum of the reductions caused by the
extinction of the breeds which composed the clade. This additive property
occurs only if breeds are independent, e.g., the loss of the Mirandesa and
Alistana has this property. However, the joint extinction of the Sayaguesa and
Genetic diversity of local beef cattle breeds 327
Tudanca breeds reduces the total diversity by a greater magnitude than the sum
of the two, so they cannot be considered as independent from each other. An
interesting question is to what extent both procedures, correspondence analysis
and the Weitzman approach, give similar results. It must be emphasised that
a correspondence analysis exploits within-breed variability while the Weitz-
man approach does not. The correlation between the contribution of breeds
to diversity, computed by the Weitzman procedure, and the correspondence
analysis (inertia) when the complete set of 16 markers and INRA 032 were
eliminated, was 0.54 and 0.64 ( p < 0.05), respectively. Moreover, if we
consider the four breeds which contributed the most to diversity, three of them
(Mirandesa, Sayaguesa and Alistana) were always present, independently of
the analysis procedure used.
Two additional considerations with respect to the Weitzman diversity func-
tion refer to the caution needed when interpreting the graphical representation
as a phylogenetic tree. Indeed it is only a representation of the diversity found
at the current time and the sensitivity of the graphical representation from
the model used to study the divergence among the breeds. The order of the
breeds appearing in the tree strongly depends on the force (random drift or
mutation) considered to be the determinant of the observed diversity. When
F
ST
and Reynolds genetic distances were used, breeds ranked in a similar order
(Spearman correlation = 1.0); however, no rank correlation was found to be
significantly different from 0 between the breed-order computed using former
distances based on effective population size and the breed-order calculated
using those genetic distances which are based on the size of the alleles. It should
be noted that, despite criticism of the Weitzman approach [49], it continues
to be a valid method of determining priorities for conservation investments,
if we know the relationships of breeds to each other, the survival probability
distribution functions and the costs of improving breed survival.
A different argument showing that hypervariable microsatellites with a high
level of heterozygosity and a large number of alleles, provide an efficient
way of evaluating genetic diversity between the bovine breeds considered,
can be demonstrated by observing their statistical power for breed-affiliation
estimation. The results presented in Table V demonstrate the possibility of
assigning breedidentities to anonymous bovine samples as has been previously
shown in equines [9], cattle [29], sheep [8] and humans [44]. These molecular
markers provide a powerful tool for measuring the genetic differentiation
between breeds of domestic species.
5. CONCLUSIONS
The main objective of conservation genetics is to preserve variability within
populations under the hypothesis of correlation between genetic variation and
328 J. Cañón et al.
population viability. Avoidance of inbreeding has often been considered as
synonymous with heterozygosity maintenance. Heterozygosity is retained
through the maximisation of the inbreeding effective size, which primarily
depends on the parental generation size. In populations with known pedigrees,
as is the case in this study, maximising effective size while ignoring the ancestry
of each individual may not be the most effective strategy for maintaining
genetic diversity. Instead, a strategy that utilises all pedigree information
would better serve to preserve genetic variation. Unfortunately, many of the
local breeds included in this study have incomplete pedigrees and one or both
parents of some individuals are unknown. In this context, the application of
molecular informationcansolve someof the uncertainties sinceit is usefulwhen
identifying pedigree relationships and the genetically most important animals in
order to maximise founder genome equivalents. Moreover, although additional
information on productive, morphological, and fitness-related traits should be
taken into account when ranking breeds for preservation purposes, strategies
based on neutral markers can be efficient in maximising the retention of the
highest number of neutral and non-neutral alleles in small populations [1].
This study contributes to the knowledge of the genetic diversity across
different countries and to the molecular characterisation of limited-size pop-
ulations, many of which are under threat of extinction. It also shows how
microsatellites can be used to construct an appropriate measure of diversity
function through the genetic relationships between populations. Additionally,
the present study provides reasonable statistical power for breed assignment
regardless of whether breeds are closely related or not. These issues allow for
future management of the breeds to be based on greater knowledge of their
genetic structuring and the relationships between their populations.
ACKNOWLEDGEMENTS
This study received the financial support of the EC DGVI FII.3 (contract
FAIR1 CT95 0702). Additional support was provided by CICYT (contract
AGF96–1950-CE/95). Blood samples from the Sayaguesa and Alistana breeds
were provided by E. Matorra and J.E. Yanes, and from the Tudanca breed
by R. Sainz. We would also like to thank ASEAVA, ASEAMO, UNION
AUBRAC, UPRA SALERS, UPRA GASCONNE and Alain Havy from the
Institut de l’Élevage for their help in blood sampling.
REFERENCES
[1] Bataillon T.M., David J.L., Schoen D.J., Neutral genetic markers and conserva-
tion genetics: simulated germplasm collections, Genetics 144 (1996) 409–417.
Genetic diversity of local beef cattle breeds 329
[2] Bassam B.J., Caetano-Anolles G., Gresshoff P.M., Fast and sensitive silver
staining of DNA in polyacrylamide gels, Anal. Biochem. 196 (1991) 80–83.
[3] Benzécri J.P., Analyse des données. Tome 2: Analyse des correspondances,
Dunod, Paris, 1973.
[4] Blott S.C., Williams J.L., Haley C.S., Genetic relationships among European
cattle breeds, Anim. Genet. 29 (1998) 273–282.
[5] Bowcock A.M., Ruiz-Linares A., Tomforhde J., Minch E., Kidd J.R., Cavalli-
Sforza L.L., High resolution of human evolutionary trees with polymorphic
microsatellites, Nature 368 (1994) 455–457.
[6] Bradley D.G., Machugh D.E., Loftus R.T., Sow R.S., Hoste C.H., Cunningham
E.P., Zebu-taurine variation in Y chromosomal DNA: a sensitive assay for genetic
introgression in west African trypanotolerant cattle populations, Anim. Genet.
25 (1994) 7–12.
[7] Brezinsky L., Kemp S.J., Womack J., Teale A.J., A panel of bovine microsatellite
genetic markers, in: Proceedings of the XXII Conference on Animal Genetics,
1992, Interlakin, Switzerland, International Society for Animal Genetics.
[8] Buchanan F.C., Adams L.J., Littlejohn R.P., Maddox J.F., Crawford A.M.,
Determination of evolutionary relationships among sheep breeds using
microsatellites, Genomics 22 (1994) 397–403.
[9] Cañon J., Checa M.L., Carleos C., Vega-Pla J.L., Vallejo M., Dunner S., The
genetic structure of Spanish Celtic horse breeds inferred from microsatellite data,
Anim. Genet. 31 (2000) 39–48.
[10] Ciampolini R., Moazami-Goudarzi K., Vaiman D., Dillman C., Mazzanti E.,
Foulley J.L., Leveziel H., Cianci D., Individual multilocus genotypes using
microsatellite polymorphisms to permit the analysis of the genetic variability
within and between Italian beef cattle breeds, J. Anim. Sci. 73 (1995) 3259–3268.
[11] Eding J.H., Laval G., Measuring genetic uniqueness in livestock, in: J.K. Olden-
broek (Ed.), Genebanks and the conservation of farm animal genetic resources,
DLO Inst. Anim. Sci. and Health, Leylstad, 1999.
[12] Excoffier L., Smouse P.E., Quattro J.M., Analysis of molecular variance inferred
from metric distances among DNA haplotypes: Application to human mitochon-
drial DNA restriction data, Genetics 131 (1992) 479–491.
[13] Felsenstein J., PHYLIP (Phylogeny Inference Package) Version 3.5c. Department
of Genetics, University of Eashington, Seattle, 1993.
[14] Fries R., Eggen A., Womack J.E., The bovine genome map, Mamm. Genome 4
(1993) 405–28.
[15] GeorgesM., MasseyJ., Polymorphic DNAmarkers in bovidae(WorldIntellectual
Property Org Geneva), Wo. Publi. N
◦
92/13102, 1992.
[16] Goldstein D.B., Ruiz-Linares A., Cavalli-Sforza L.L., Feldman M.W., An eval-
uation of genetic distances for use with microsatellite loci, Genetics 139 (1995)
463–471.
[17] Goldstein D.B., Ruiz-Linares A., Cavalli-Sforza L.L., Feldman M.W., Genetic
absolute dating based on microsatellites and the origin of modern humans, Proc.
Nat. Acad. Sci. USA. 92 (1995) 6723–6727.
[18] Grosclaude F., Aupetit R.Y., Lefebvre J., Mériaux J.C., Essai d’analyse des
relations génétiques entre les races bovines françaises à l’aide du polymorphisme
biochimique, Genet. Sel. Evol. 22 (1990) 317–338.
330 J. Cañón et al.
[19] Guinand B., Use of a multivariate model using allele frequency distributions to
analyse patterns of genetic differentiation among populations, Biol. J. Linn. Soc.
58 (1996) 173–195.
[20] Jeanpierre M., A rapid method for purification of DNA from blood, Nucleic
Acids Res. 15 (1987) 9611.
[21] Jordana J., Pelegrin M., Piedrafita J., Relaciones genéticas en bovinos españoles
obtenidas a partir del estudio de caracteres morfológicos, ITEA 87 (1991) 50–64.
[22] Kantanen J., Olsaker I., Adalsteinsson S., Sandberg K., Eythorsdottir E.,
Pirhonen K., HolmL.E., Temporal changes in geneticvatriation of North Europen
cattle breeds, Anim. Genet. 30 (1999) 16–27.
[23] Kaukinen J., Varvio S.L., Eight polymorphic bovine microsatellites, Anim.
Genet. 24 (1993) 148.
[24] Laloë D., Moazami-Goudarzi K., Souvenir Zafindrajaona P., Analyse des cor-
respondances et biodiversité dans les races domestiques, Société française de
biométrie, 20 mai 1999, Grenoble, 5 p.
[25] Laval G., Iannuccelli A., Legault Ch., Milan D., Groenen A.M., Giuffra E.,
Andersson L., Nissen P.H., Jorgensen C.B., Beeeckmann P., Geldermann H.,
Foulley J.L., Chevalet C., Ollivier L., Genetic diversity of eleven European pig
breeds, Genet. Sel. Evol. 32 (2000) 187–203.
[26] Lebart L., Morineau A., Warwick K, Multivariate Descriptive Statistical Ana-
lysis, J. Wiley, New York, 1984.
[27] Loftus R.T., MacHugh D.E., Ngere L.O., Balain D.S., Badi A.M., Bradley D.G.,
Cunningham E.P., Mitochondrial geneticvariationin European, Africanan Indian
cattle populations, Anim. Genet. 25 (1994) 265–271.
[28] MacHugh D.E., Shriver M.D., Loftus R.T., Cunningham P., Bradley D.G.,
Microsatellite DNA variation and the evolution, domestication and phylogeo-
graphy of taurine and zebu cattle (Bos taurus and Bos indicus), Genetics 146
(1997) 1071–86.
[29] MacHugh D.E., Loftus R.T., Cunningham P., Bradley D.G., Genetic structure of
seven European cattle breeds assessed using 20 microsatellite markers, Anim.
Genet. 29 (1998) 333–40.
[30] Mahé M.F., Miranda G., Queval R., Bado A., Souvenir Zafindrajaona P.,
Grosclaude F., Genetic polymorphism of milk proteins in African Bos taurus
and Bos indicus populations. Characterization of variants α
s1
-Cn H and β-Cn J,
Genet. Sel. Evol. 31 (1999) 239–253.
[31] Manwell C., Baker A.C.M., Biochemical classification of cattle. 2. Phylogenic
tree and specific status of the zebu, Anim. Blood. Groups. Bioechem. Genet. 11
(1980) 151–162.
[32] Martin-Burriel I., Garcia-Muro E., Zaragoza P., Genetic diversity analysis of
six Spanish native cattle breeds using microsatellites, Anim. Genet. 30 (1999)
177–182.
[33] Medjudorc I., Kustermann W., Lazar P., Russ I., Pirchner F., Marker-derived
phylogeny of European cattle supports demic expansion of agriculture, Anim.
Genet. 25 Suppl. 1 (1994) 19–27.
[34] Minch E., Ruiz-Linares A., Goldstein D.B., Feldman M.W., Cavalli-Sforza L.L.,
MICROSAT (version 1.4): a computer program for calculating various statistics
on microsatellite allele data, :microsat.html, 1995.
Genetic diversity of local beef cattle breeds 331
[35] Moazami-Goudarzi K., Laloë D., Furet J.P., Grosclaude F., Analysis of genetic
relationships between 10 cattle breeds with 17 microsatellites, Anim. Genet. 28
(1997) 338–345.
[36] Mommens G., Peelman L.J., Van zeveren A., D’Ieteren G., Wissocq N.,
Microsatellite variation between an African and five European taurine breeds
results in a geographical phylogenetic tree with a bison outgroup, J. Anim.
Breed. Genet. 116 (1999) 325–330.
[37] Nijman I.J., Bradley D.G., Hanotte O., Otsen M., Lenstra J.A., Satellite DNA
polymorphisms and AFLP correlate with Bos indicus-taurus hybridization,
Anim. Genet. 30 (1999) 265–273.
[38] Queval R., Moazami-Goudarzi K., Laloë D., Mériaux J.C., Grosclaude F., Rela-
tions génétiques entre populations de taurins ou zébus d’Afrique de l’Ouest et
taurins européens, Genet. Sel. Evol. 30 (1998) 367–383.
[39] Reynolds J., WeirB.S., Cockerham C.C.,Estimation of the coancestry coefficient:
Basis for a short-term genetic distance, Genetics 105 (1983) 767–79.
[40] Rohlf F.J., NTSYS-pc: Numercial Taxonomy and Multivariate Analysis System,
Exeter Software, Heritage Lane, Setauket, New York, 1988.
[41] Sambrook J., Fritsch E.F., Maniatis T., Molecular Cloning: a Laboratory Manual,
2nd ed., Cold Spring Harbor, Cold Spring Harbor Laboratory Press, NY, 1989.
[42] Schmid M., Saitbekova N., Gaillard C., Dolf G., Genetic diversity in Swiss cattle
breeds, J. Anim. Breed. Genet. 116 (1999) 1–8.
[43] Schneider S., Kueffer J.M, Roessli D., Excoffier L., Arlequin ver 1.1: A soft-
ware for population genetic data analysis, Genetics and Biometry Laboratory,
University of Geneva, 1997.
[44] Shriver M.D., Smith M.W., Jin L., Marcini A., Akey J.M., Deka R., Ferrell R.E.,
Ethnic-Affiliation Estimation by use of population-specific DNA markers, Am.
J. Hum. Genet. 60 (1997) 957–964.
[45] Souvenir Zafindrajaona P., Zeuh V., Moazami-Goudarzi K., Laloë D., Bourzat
D., Idriss A., Grosclaude F., Étude du statut phylogénétique du bovin Kouri du
lac Tchad à l’aide de marqueurs moléculaires, Rev. Elev. Méd. Vét. Pays Trop.
52 (1999) 155–162.
[46] Steffen P., Eggen A., Dietz A.B., Womack J.E., Stranzinger G., Fries R., Isolation
and mapping of polymorphic microsatellites in cattle, Anim. Genet. 24 (1993)
121–124.
[47] Swofford D.L., Selander R.B., BIOSYS-1. A computer program for the ana-
lysis of allelic variation in population genetics and biochemical systematics
(Release 1.7), University of Illinois, Urbana, Champaign, 1989.
[48] Takezaki N., Nei M., Genetic distances and reconstruction of phylogenetic trees
from microsatellite DNA, Genetics 144 (1996) 389–399.
[49] Thaon d’Arnoldi C., Foulley J.L., Ollivier L., An overview of the Weitzman
approach to diversity, Genet. Sel. Evol. 30 (1998) 149–161.
[50] Vaiman D., Osta R., Merci D., Grohs C., Leveziel H., Characterization of five
new bovine dinucleotide repeats, Anim. Genet. 23 (1992) 537–541.
[51] Vaiman D., Mercier D., Moazami-Goudarzi K., Eggen A., Ciampolini R.,
Lépingle A., Velmala R., Kaukinen J., Varvio S.L., Martin P., Levéziel H.,
Guérin G., A set of 99 cattle microsatellites: characterization, synteny mapping,
and polymorphism, Mamm. Genome 5 (1994) 288–297.
332 J. Cañón et al.
[52] Weir B.S., Genetic Data Analysis, Sinauer Associates, Sunderland, Massachu-
setts, 1990.
[53] Weitzman M., On diversity, Quart. J. Econ. 107 (1992) 363–405.
[54] Weitzman M., What to preserve? An application of diversity theory to crane
conservation, Quart. J. Econ. 108 (1993) 157–183.
[55] Wright S., The interpretation of population structure by F-statistics with special
regard to systems of mating, Evolution 19 (1965) 395–420.
To access this journal on line:
www.edpsciences.org