Báo cáo khoa hoc:" Selection for litter size in pigs. II. Efficiency of closed and open selection lines" ppt
Bạn đang xem bản rút gọn của tài liệu. Xem và tải ngay bản đầy đủ của tài liệu tại đây (261.74 KB, 14 trang )
Genet. Sel. Evol. 33 (2001) 515–528 515
© INRA, EDP Sciences, 2001
Original article
Selection for litter size in pigs.
II. Efficiency of closed
and open selection lines
∗
Gérard B
OLET
a, ∗∗
, Jean-Pierre B
IDANEL
b
,
Louis O
LLIVIER
b
a
Institut national de la recherche agronomique,
Station d’amélioration génétique des animaux,
31326 Castanet-Tolosan Cedex, France
b
Institut national de la recherche agronomique,
Station de génétique quantitative et appliquée,
78352 Jouy-en-Josas Cedex, France
(Received 17 July 2000; accepted 27 April 2001)
Abstract – A selection experiment on litter size in the pig was carried on for seventeen
generations in an Inra experimental herd. The founder population was made up of 10 males and
120 females from the Large White breed. Selection was first performed for ten generations in
a closed line, compared to a control line derived from the same founder population. Selection
was carried on within sire family on the total number of piglets born in the first two litters of
the dam (TB1 + TB2). After ten generations, the selection criterion became dam TB1 only.
The control line was then discontinued and a panel of frozen semen from the 11th generation
boars was created for later comparisons. The selected line was opened to gilt daughters of
hyperprolific boars and sows, at a rate of 1/8 per generation, and the same selection procedure
was applied irrespective of the origin of the gilt. During the whole experiment, the number
of ova shed (OS) and the number of live embryos (LE) at 30 days in the 3rd pregnancy
were recorded. These two parts of the experiment were analysed using REML estimation of
genetic parameters and a BLUP-Animal Model in order to estimate the responses to selection.
Significant heritabilities for TB1, TB2, OS and LE were obtained, i.e. 0.10, 0.05, 0.43 and 0.19,
respectively. Significant common environment variances and covariances were estimated for
nearly all traits. Significantly positive BLUP responses per generation were observed from G0 to
G17 for TB1 (+0.086), TB2 (+0.078), OS (+0.197) and LE (+0.157). However, the responses
were 3- to 4-fold higher in the G12–G17 interval compared to G0–G11, and they were also in
fair agreement with previous estimates based on standard least-squares procedures, using the
control line and the control frozen semen panel. Since G11, the selection intensity was increased
by nearly 80 p. cent compared to the previous generations, and the proportion of hyperprolific
ancestry increased up to 65 p. cent in the sows of the last generation. The total genetic gain of
∗
Second part of Bolet et al. [2]
∗∗
Correspondence and reprints
E-mail:
516 G. Bolet et al.
about 1.4 piglets at birth per litter could be shared between a gain due to immigration, of about
0.8 piglets per litter, and a within-line selection gain of about 0.6 piglets. Thus by combining
selection and immigration in the second part of the experiment, advantage could be taken from
both the genetic superiority of the immigrants and the higher internal selection intensity made
possible by immigration.
pigs / selection / litter size / open line / immigration
1. INTRODUCTION
Several selection experiments for litter size have been conducted in the pig,
references of which may be found in Bolet et al. [2] and in the review of
Rothschild and Bidanel [14]. One of the earliest such experiments was started
in 1965 [11] and carried on for seventeen generations in an Inra experimental
farm. Selection was first performed in a closed line in comparison with a control
line. After ten generations, the selected line was opened to gilts which were
daughters of hyperprolific boars and sows. These two parts of the experiment
were analysed separately [1,2,13] using standard least-squares methods for
evaluating the responses. The objective of this paper is to present a complete
analysis of the 17-generation experiment, using Restricted Maximum Like-
lihood (REML) estimation of genetic parameters, and Best Linear Unbiased
Prediction of breeding values under an Animal Model (BLUP-MA). These
methods, much more powerful and accurate, allow to combine the information
from the two parts of the experiment and to take into account the information
on the origin of the hyperprolific animals introduced into the open line. It is
then possible to compare the responses to selection in the closed and in the
open steps of this experiment.
2. MATERIALS AND METHODS
2.1. Animals
This experiment took place at the Inra experimental farm of Galle, in Avord
(Cher) from 1965 to 1987. From a Large White base population of 10 boars
and 120 sows (G0), two lines were derived, a selected line (SL) and a control
line (CL). The selected line was divided up into 8 families of 1 male (plus one
additional male) and 10 females.
From G0 to G11, the two lines were bred simultaneously using natural
mating. Oestrus of gilts was detected when they reached 80 kg live weight.
Gilts were mated at the first oestrus and, if still not pregnant, at the next
oestrus. Group-farrowing over a period of about 3 months was arranged during
the whole experiment and replacements were usually selected within first litters,
thus allowing a generation interval of about one year. In all generations with the
Selection for litter size in pigs 517
exception of G14, a random sample of about 30 sows per generation was mated
after weaning of the second litter (or the third in G16) and slaughtered 30 days
after mating. The number of corpora lutea on the ovaries (which represents
the number of ova shed) and the number of live embryos were counted. In
the second and subsequent gestations, boars of different breeds were used,
mainly Piétrain. The control line (CL), in which a random choice was made
within litter for females and within sire for males, was conducted at the same
rhythm as SL from G1 to G11.The control line was then discontinued and
semen from G11 control males was frozen. After their first two litters, females
of the G14 SL were inseminated with 10 of these boars and the daughters from
this CLxSL cross were compared to contemporary G16 SL females [2].
2.2. Selection criteria
From G1 to G9, males and females were selected within sire family, on
the total number of piglets born in the first two litters of the dam. From
G10 onwards, the experimental design was modified to take into account the
first results (i.e. the low heritability of the criterion of selection and the weak
selection intensity [13]) and to possibly apply higher selection intensities. The
selection criterion became the size of first litter only. Within-sire selection was
maintained for males, but it was changed to across-sire selection for females.
The line was opened to gilts which were daughters of hyperprolific sows. These
sows were detected in farms through the national recording programme and
were also used to constitute a hyperprolific line of boars [9]. The gilts purchased
were all inseminated by boars of this hyperprolific line before being introduced
into SL, in which they constituted, at each generation, a supplementary sire
family. They were subjected to the same selection and mating protocol as
the other candidates. This group of immigrant hyperprolific gilts mated to
hyperprolific boars was then considered as one of the 8 sire families in each SL
generation. Correspondingly, the theoretical immigration rate was about 0.125
(1/8) at each generation.
2.3. Statistical methods
The traits analysed were: total litter size at birth in first (TB1) and second
parity (TB2), number of ova shed (OS) and number of live embryos (LE) in
third parity. Genetic parameters were estimated using a derivative-free REML
procedure applied to a multiple trait individual animal model, with random
additive genetic (h
2
) and common litter environment (c
2
) effects. Generation
was fitted as a fixed effect for all traits. Age at mating was fitted as a
covariate within parity for litter size. In addition, two groups of ancestors,
one non-hyperprolific group and one hyperprolific group, were considered in
the model, following the procedure of Westell et al. [23]. The analyses were
518 G. Bolet et al.
performed using version 4.2 of the VCE computer package [10]. Standard
errors of variance components and genetic parameters were obtained from an
approximation of the Hessian matrix when convergence was reached.
Direct and correlated responses to selection were calculated from the estim-
ated breeding values (EBV) of females using a BLUP procedure applied to the
same animal model as above. The analyses were performed using the PEST
package of Groeneveld et al. [4]. The genetic parameters used to estimate the
EBVs were those obtained using the REML procedure described above. All
these analyses were performed simultaneously on TB1, TB2, OS and LE to
estimate the genetic correlations and to take into account the effect of selection
on TB1 and TB2 [16]. The average responses to selection were calculated
from the regression of individual EBVs of the breeding females on generation
number.
The selection differential was calculated as the difference between selected
dams and their contemporaries, following the procedure used in a mice selection
experiment by Joakimsen and Baker [6]. Dam deviations of generation n were
weighted, either by the number of their daughters farrowing in the n + 1 gen-
eration (dam-daughter path), or by their number of granddaughters (daughters
of their sons) farrowing in the n + 2 generation (dam-son path).
The inbreeding coefficients and the probability of origin of genes were
calculated as described by Vu Tien Khang [20], using the JVT package [21].
The proportion of hyperprolific ancestry was thus obtained, and it provided an
estimate of the immigration rate achieved at each generation.
3. RESULTS
3.1. Mean results and genetic parameters
Table I presents the number of breeding animals and parents per generation
in the selected line. It also presents, from G10 onwards, the number of
hyperprolific (immigrant) females which constituted one of the 8 families. The
number of females per generation varied from 50 to 100, around a theoretical
number of 80. The immigration rate also varied according to generation, from 0
to 17%, around a theoretical rate of 12.5%. Table II presents the average
values, the phenotypic standard deviations and the genetic parameters of the
traits analysed. All heritabilities were significantly different from zero, and
particularly high values of h
2
were obtained for the physiological components
of litter size (OS and LE). Table II also shows significantly positive common
litter environment variances (c
2
) and correlations for almost all traits.
3.2. Responses to selection
The whole selection experiment (G0–G17) was divided into two periods,
namely G0–G11, during which the selected (SL) and the control (CL) lines
Selection for litter size in pigs 519
Table I. Number of breeding animals, including hyperprolific immigrants, and origins
per generation in the selected line.
Generation Breeding animals Parents of breeding females
Males Females Hyperprolific Sires Dams
females
0 10 82
1 8 58 10 28
2 8 59 8 28
3 11 57 7 31
4 7 71 11 36
5 8 80 7 27
6 11 60 8 36
7 9 51 7 21
8 10 62 8 25
9 12 65 9 27
10 10 70 8 11 30
11 12 77 3 9 29
12 12 77 5 11 32
13 10 95 9 12 30
14 10 109 0 8 32
15 13 66 11 9 28
16 18 55 2 8 21
17 34 103 0 10 27
were bred simultaneously, and G12–G17, after the discontinuation of CL. It
should however be noted that at the end of the first period, namely at G10,
immigration had already begun and the selection criterion had been changed
to TB1.
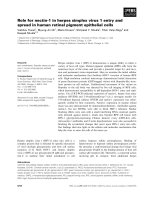
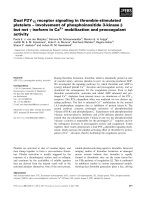
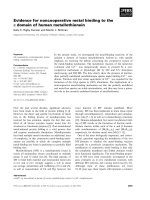
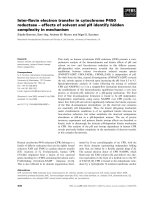
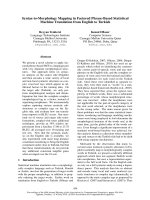
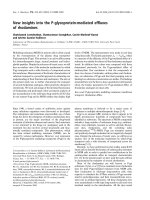
Figures 1 to 4 present the trends in breeding values of SL and CL and clearly
show an increase in the rates of genetic gain around G10, for the four traits
considered. Significantly positive responses per generation were observed for
the four traits, and the regressions in SL were 3- to 4-fold higher in G12 to
G17 compared to G0 to G11 (Tab. III). In the former period, there was also a
significantly positive response in the control line for TB1 and, to a lesser extent,
for TB2, whereas no responses were evidenced for the other traits. Fluctuations
of environmental effects across generations reaching 4 piglets per litter (not
shown in Figs. 1 to 4) could also be evidenced, though no significant trend over
generations appeared.
The genetic gains estimated in this paper were compared to those previously
published (see Tab. IV), and estimated separately in the two phases of the
experiment. Bolet et al. [2] used the standard least-squares method to compare
520 G. Bolet et al.
Table II. Number of records, means and standard deviations and genetic parameters.
TB1: 1st litter size
TB2: 2nd litter size
OS: number of ova shed
LE: number of embryos
Columns 4–7: heritabilities and common litter environment effect (± standard deviation) on the diagonal, genetic and common litter
environment correlations (± standard deviation) above the diagonal, residual correlations below the diagonal.
Number of records Mean Phenotypic SD TB1 TB2 OS LE
TB1 1 421 9.78 2.97 0.10(±0.03) 0.65(±0.21) 0.63(±0.13) 0.47(±0.21)
0.06(±0.02) 0.79(±0.28) 0.40(±0.22) 0.38(±0.26)
TB2 1 285 10.62 3.16 0.13 0.05(±0.02) 0.88(±0.15) 0.98(±0.06)
0.03(±0.02) 0.77(±0.31) 0.84(±0.26)
OS 656 16.82 3.23 0.02 0.08 0.42(±0.07) 0.84(±0.12)
0.10(±0.05) 0.63(±0.21)
LE 575 12.58 3.81 0.06 0.13 0.38 0.20(±0.06)
0.14(±0.06)
Selection for litter size in pigs 521
Figure 1. Size of first litter (TB1). Evolution of average generation breeding values,
expressed as deviation from G0.
Figure 2. Size of second litter (TB2). Evolution of average generation breeding
values, expressed as deviation from G0.
the selected and the control lines during the eleven first generations of selection.
In the second phase, Bolet et al. [1] estimated the genetic progress in G16
by comparing the selected line to the CLxG14SL cross described in 2.1.
and weighting the deviation by 16/9. Assuming a linear evolution of the
difference between SL and CL across generations and no heterosis in the
cross, the deviation was considered as representing the gain over the remaining
nine generations (from G7 to G16), i.e. 9/16 of the total gain. The present
estimates agree rather closely with the least-squares estimates over the G0–
G11 period. Direct responses were weak, though significant indirect responses
522 G. Bolet et al.
Figure 3. Number of ova shed during third pregnancy (OS). Evolution of average
generation breeding values, expressed as deviation from G0.
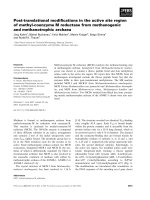
Figure 4. Number of live embryos at 30th day of third pregnancy (LE). Evolution of
average generation breeding values, expressed as deviation from G0.
were shown for both OS and LE. Over the whole experiment, the total least-
squares responses were considerably higher for TB2 than for TB1, though
the BLUP-AM estimates were about equal for the two traits, and similar total
responses (TB1+ TB2) were estimated by both methods. Significant responses
were also observed for OS and LE with both methods, though the least-squares
estimates were considerably lower.
3.3. Selection differentials
Table V compares the selection differentials achieved in both phases of the
experiment through the dam-son and dam-daughter pathways. When these
Selection for litter size in pigs 523
Table III. Response to selection: regression of estimated breeding values (EBVs) on
generation number.
TB1 TB2 OS LE
SL G0–G17 0.086 (0.002) 0.078 (0.002) 0.197 (0.006) 0.157 (0.005)
** ** ** **
SL G0–G11 0.044 (0.004) 0.039 (0.004) 0.121 (0.011) 0.078 (0.008)
** ** ** **
SL G12–G17 0.151 (0.010) 0.144 (0.011) 0.348 (0.031) 0.293 (0.024)
** ** ** **
CL G0–G11 0.058 (0.006) 0.010 (0.005) 0.029 (0.015) 0.001 (0.011)
** * ns ns
ns: not significant. * P < 0.05. ** P < 0.01.
Table IV. Comparison of estimations of genetic gain in this study and in previous
papers using least-squares methods.
G0–G11 Overall gain
(rate per generation)
SL–CL SL G0–G16 G0–G17
(1) (2) (3) (4)
TB1 −0.03 ns +0.044 ** +0.55 ns +1.50
TB2 +0.05 ns +0.039 ** +2.24 † +1.38
OS +0.12 * +0.121 ** +1.95 ns +3.58
LE +0.12 ** +0.078 ** +1.95 ns +2.79
(1) Bolet et al. (1989).
(2) EBVs in this study (see Tab. III).
(3) Least-squares estimates of Bolet et al. (1987).
(4) EBVs in this study (see Figs. 1–4).
ns: not significant. † P = 0.10. * P < 0.05. ** P < 0.01.
were converted into selection intensities, taking into account the change in
the selection criterion in G11, it appeared that selection intensity was more
than doubled in the dam-daughter pathway against an increase of 64% in the
dam-son pathway.
3.4. Probability of origin of genes and inbreeding
In the line selected since G11, hyperprolific genes entered via the regular
immigration of hyperprolific gilts and boars. Genes in the females of each
generation could then be traced either to a prolific or to a non-prolific origin.
524 G. Bolet et al.
Table V. Average selection differentials and selection intensities per generation.
Dam-daughter Dam-son
G0–G10
(1)
G11–G16
(2)
G0–G10
(1)
G11–G16
(2)
(SL) (SL)
Selection differential
SL 2.13 2.09 2.89 3.90
CL 0.72 – 0.68 –
SL-CL 1.41 – 3.49 –
Selection intensity (SL-CL) 0.33 0.71 0.81 1.33
Equivalent selection rate (%) 0.81 0.56 0.49 0.23
(1)
Selection differentials for TB1 + TB2.
(2)
Selection differential for TB1.
0
1 0
2 0
3 0
4 0
5 0
6 0
7 0
0 1 2 3 4 5 6 7 8 9 1 0 1 1 1 2 1 3 1 4 1 5 1 6 1 7
G e n e r a t i o n n u m b e r
P e r c e n t a g e
I n b r e e d i n g c o e f f i c i e n t
P e r c e n t a g e o f h y p e r p r o l i f i c a n c e s t r y
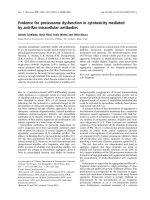
Figure 5. Percentage of hyperprolific ancestry and inbreeding coefficient of the SL
females in each generation.
Figure 5 shows that the proportion of hyperprolific ancestry increased up to an
average proportion of 65% prolific genes in the sows of the last generation.
In the control line, the inbreeding coefficient of sows increased to about 10
percent in G11, as also shown in Bolet et al. [2]. In SL, it reached a maximum
value of about 7% in G9–G10 (see also [2]) and decreased slightly thereafter,
as a consequence of immigration, as shown in Figure 5.
4. DISCUSSION
4.1. Genetic parameters
The parameters of Table II for litter size are in agreement with the values
found in the literature (see the review by [14]). However the h
2
values of OS and
Selection for litter size in pigs 525
LE were quite above the usual estimates. A significant common litter environ-
ment effect (c
2
) was found for all traits, except TB2. This is in agreement with
several other observations, including those of Strang and Smith [17], of much
larger full-sib heritabilities compared to half-sib or daughter-dam estimates,
though, in contrast, Haley et al. [5] concluded to remarkably similar estimates
for all methods. It is known that the variation covered by c
2
in a purely additive
genetic model includes various effects such as dominance and maternal genetic
effects, in addition to purely environmental effects. The evidence on maternal
heritability is controversial, as underlined by Rothschild and Bidanel [14], and
this may partly be a consequence of the difficulty in disentangling the effects
included in the common litter factor. When these results are compared to
those previously published [2], there is no evidence of a reduction of genetic
variability during the experiment. However, this is to be expected since the
parameters of Table II refer to the base population under the animal model used.
However, when G0–G10 and G11–G17 were analysed separately, a decrease in
genetic variance was observed, except for TB1. The reduction varied according
to the trait considered, much more for OS and LE than for TB2. No definite
conclusion can be reached because of the limited size and duration of the
experiment.
4.2. Selection responses
Significant responses were observed for all traits in the selected line. From
G0 to G11, the regression of estimated breeding values on generation number
were low, but significantly positive. Genetic progress from G12 to G17 was
much higher. There was a fair agreement between the response patterns
based on EBVs and those obtained by comparison with the control line cross
CLxSL, though some differences can be noted between the actual estimates
in Table IV. It can also be noted that the average accuracy of female EBVs
for TB1 was 0.45, which is about 42% above the accuracy of TB1 itself, the
actual selection criterion used in the experiment. This leads us to suspect that a
much higher selection response would have been obtained using BLUP, though
the a posteriori EBV includes information on TB1 and TB2 and is not quite
compatible with the selection procedure applied.
The use of EBVs and their prediction errors to derive estimates of selec-
tion responses has been a matter of debate for many years. Thompson [18]
pointed out that the responses derived from mixed models include information
components based on the selection pressure applied. As a consequence, such
responses are highly dependent on the genetic parameters assumed in the model,
as shown for some simple experimental designs by Thompson [19], Sorensen
and Johansson [16] and Ollivier [12]. The Bayesian approach advocated by
Sorensen et al. [15] obviates this difficulty, though it leaves open the question
of choosing appropriate priors and the incidence of this choice on the variance
526 G. Bolet et al.
of the estimates. The procedure applied in the present paper followed the
classical approach of Gianola et al. [3], which offers a good approximation to
the full Bayesian approach when the information on heritability provided by
the data is sufficient. This can be assumed to be the case here, though the data
on OS and LE are somewhat limited (Tab. II). A likely explanation for the
higher responses from EBVs of these two traits may therefore simply be the
result of the high values of h
2
assumed for them, as reported in 4.1.
Another issue is the genetic model assumed. It is well known that ignoring
dominance for traits known to exhibit such effects, like litter size in pigs, leads
to an overestimation of the responses, as shown for instance very clearly by the
simulations of Johansson et al. [7]. However, as these authors show, the bias
is reduced when the animal model includes a litter effect, both for estimating
heritability and EBVs, as was done here.
4.3. Role of immigration in the responses observed
An important point to be discussed is the origin of the genetic progress
observed in the second phase of the experiment and the respective roles of
selection and immigration in the improved efficiency of the experiment.
First, quite independently from the immigration protocol, the change of
selection criterion, from TB1 + TB2 to TB1, allowed a more intense selection
because there were more sows with only one litter than with two successive
litters. Second, the selection intensity was increased by changing the selection
method for females, from within-family selection to purely mass selection.
These two sources of increase are reflected in the comparisons of Table V. The
increase of 79 per cent in the overall selection intensity was made possible at
no extra inbreeding cost, as shown in Figure 5.
Selection with immigration has been shown by Webb [22] to be biased as a
result of (i) possible heterosis in the cross between immigrants and natives,
and (ii) treating natives and immigrants as if they were members of the
same population, which tends to underrate superior immigrants. Source (i)
is unlikely in our experiment, since there is no cross initially and also since
both populations are Large White. Source (ii) deserves more attention since it
may affect dam selection in our experiment and would thus tend to underrate the
hyperprolific dams. However, hyperprolific gilts tend to express little of their
genetic superiority in their first litters [8], and we can consider that immigration
had little influence on the selection of females. This is also confirmed by the
actual proportion of hyperprolific ancestry in G17, which is quite close to its
expectation (1–0.875
7
) under a pure immigration scheme at a rate of 0.125 for
seven generations. However, considering that the actual immigration rate was
lower than intended in the experimental design (Tab. I), this assumption has to
be qualified.
Selection for litter size in pigs 527
The following tentative interpretation of our results can then be presented,
if we assume no interaction between selection and immigration. The total
genetic gain of about 1.4 piglet at birth per litter (average of TB1 + TB2) can
be partly attributed to immigration and the remainder to selection. Assuming
a genetic superiority of 1.6 piglets in hyperprolific females [8], taking the 0.65
proportion of hyperprolific origin reached in G17 (see Fig. 5), and given that the
immigrant piglets are 75% hyperprolific, the gain due to immigration may be
estimated to be about 0.8 piglets, slightly above half of the total gain. Though
the remaining selection gain of about 0.6 piglets is somewhat below the gain
which could be expected for TB1 from the selection intensities applied over
G11–G16, it can be concluded that, by combining selection with immigration
in the second part of this experiment, it has been possible to benefit both from
the immigrants superiority and from a more efficient within-line selection than
in the closed line of limited size used in the first part of the experiment.
ACKNOWLEDGEMENTS
The authors wish to thank Pierre Dando and the staff of the experimental
farm of Galle, for managing the whole experiment.
REFERENCES
[1] Bolet G., Renard C., Ollivier L., Dando P., La sélection sur la prolificité chez le
porc : réponse à une sélection en lignée ouverte, in: 19
e
Journées de la recherche
porcine en France, 4–5 février 1987, Institut technique du porc, Paris, pp. 47–54.
[2] Bolet G., Ollivier L., Dando P., Sélection sur la prolificité chez le porc. I. Résultats
d’une expérience de sélection sur onze générations, Genet. Sel. Evol. 21 (1989)
93–106.
[3] Gianola D., Foulley J.L., Fernando R., Prediction of breeding values when
variances are unknown, Génét. Sél. Evol. 18 (1986) 485–498.
[4] Groeneveld E., Kovac M., Wang T., Pest, a general purpose BLUP package
for multivariate prediction and estimation, in: Proceeding of the 4th World
Congress on Genetics Applied to Livestock Production, 23–27 July 1990, Vol. 13,
Edinburgh, Scotland, pp. 488–491.
[5] Haley C.S., Avalos E., Smith C., Selection for litter size in the pig, Anim.
Breeding Abst. 56 (1988) 317–332.
[6] Joakimsen O., Bakker R.L., Selection for litter size in mice, Acta Agric. Scand.
27 (1977) 301–318.
[7] Johansson K., Kennedy B.W., Wilhemson M., Precision and bias of estimated
genetic parameters in the presence of dominance and inbreeding, in: Proceeding
of the 5th World Congress on Genetics Applied to Livestock Production, 1994,
Vol. 22, pp. 386–389.
528 G. Bolet et al.
[8] Le Roy P., Legault C., Gruand J., Ollivier L., Héritabilité réalisée pour la taille de
la portée dans la sélection de truies dites « hyperprolifiques », Génét. Sél. Evol.
19 (1987) 351–364.
[9] Legault C., Gruand J., Amélioration de la prolificité des truies par la création
d’une lignée hyperprolifique et l’usage de l’insémination artificielle : principe et
résultats expérimentaux préliminaires, in: 13
e
Journées de la recherche porcine
en France, 4–5 février 1981, Institut technique du porc, Paris, pp. 261–268.
[10] Neumaier A., Groeneveld E., Restricted maximum likelihood estimation of
covariances in sparse linear models, Genet. Sel. Evol. 30 (1998) 3–26.
[11] Ollivier L., Five generations of selection for increasing litter size in swine,
Genetics, 74 supp. 2 (1973) 202–203.
[12] Ollivier L., On the use of animal models in the analysis of selection experiments,
Genet. Sel. Evol. 31 (1999) 135–148.
[13] Ollivier L., Bolet G., La sélection sur la prolificité chez le porc : résultats d’une
expérience de sélection sur dix générations, in: 13
e
Journées de la recherche
porcine en France, 4–5 février 1981, Institut technique du porc, Paris, pp. 261–
268.
[14] Rothschild M.F., Bidanel J.P., Biology and genetics of reproduction, in: Roth-
schild M.F., Ruvinsky A. (Eds), The genetics of the pig, CAB International,
Oxon, 1998, pp. 313–343.
[15] Sorensen D.A., Wang C.S., Jensen J., Gianola D., Bayesian analysis of genetic
change due to selection using Gibbs sampling, Genet. Sel. Evol. 26 (1994)
339–360.
[16] Sorensen D.A., Johansson K., Estimation of direct and correlated responses to
selection using univariate animal models, J. Anim. Sci. 70 (1992) 2038–2044.
[17] Strang G.S., Smith C., A note on the heritability of litter traits in pigs, Anim.
Prod. 28 (1979) 403–406.
[18] Thompson R., Sire evaluation, Biometrics 35 (1979) 339–353.
[19] Thompson R., Estimation of realized heritability in a selected population using
mixed model methods, Génét. Sél. Evol. 18 (1986) 475–484.
[20] Vu Tien Khang J., Méthodes d’analyse des données démographiques et généalo-
giques dans les populations d’animaux domestiques, Génét. Sél. Evol. 15 (1983)
263–298.
[21] Vu Tien Khang J., Poivey P., Calcul des probabilités d’origine des gènes et des
coefficients de parenté et de consanguinité : présentation d’un logiciel fondé sur
l’exploitation récursive des arbres généalogiques, in: Planification expérimentale
en génétique animale, Saint-Martin de Ré, 2–4 avril 1996, Inra-DGA, pp. 233–
240.
[22] Webb A.J., Development of a synthetic pig sire line by selection with immigration
2. Immigration, Anim. Prod. 22 (1976) 245–254.
[23] Westell R.A., Quaas R.L., Van Vleck L.D., Genetic groups in an animal model,
J. Dairy Sci. 71 (1988) 1310–1318.