Báo cáo khoa hoc:"Lack of congruence between morphometric evolution and genetic differentiation suggests a recent dispersal and local habitat adaptation of the Madeiran lizard Lacerta dugesii" doc
Bạn đang xem bản rút gọn của tài liệu. Xem và tải ngay bản đầy đủ của tài liệu tại đây (287.01 KB, 15 trang )
Genet. Sel. Evol. 33 (2001) 671–685 671
© INRA, EDP Sciences, 2001
Original article
Lack of congruence between
morphometric evolution and genetic
differentiation suggests a recent dispersal
and local habitat adaptation
of the Madeiran lizard Lacerta dugesii
António B
REHM
a, ∗
, Mahnaz K
HADEM
b
,
José J
ESUS
a
, Paula A
NDRADE
b
, Luis V
ICENTE
c
a
Centre of Biological and Geological Sciences,
Campus of Penteada, 9000 Funchal, Portugal
b
Department of Biology, University of Madeira, 9000 Funchal, Portugal
c
Centre of Environmental Biology, Departments of Zoology and Anthropology,
Science Faculty of Lisbon,
University of Lisbon, C2 Campo Grande, 1700 Lisbon, Portugal
(Received 22 March 2000; accepted 6 July 2001)
Abstract – Genetic differentiation among nine populations of the endemic lizard Lacerta
dugesii Milne-Edwards 1829 (Lacertidae) from four groups of islands constituting the
Archipelago of Madeira, was investigated by protein electrophoresis at 23 enzyme loci. Among
twenty polymorphic loci, the total genetic diversity was due primarily to intra-population
variation. The allele and genotypic frequencies among populations showed some heterogeneity,
allowing the species to present a structuring pattern compatible with their geographical cluster-
ing. Some evidence suggests that selection acting on some loci in different ecological conditions
may be responsible for the clustering of the populations studied. There was no apparent isolation
effect expected under an "island" model of population divergence, and no correlation was found
between genetic and geographic distances among populations. Morphological variation of the
proposed three L. dugesii subspecies is not congruent with the allozyme analysis. This most
probably suggests a rapid colonization of the islands followed by a strong effect of selection
operating over the morphological characters used to define the subspecies.
Lacerta dugesii / allozymes / morphology / geographical population structure
∗
Correspondence and reprints
E-mail:
672 A. Brehm et al.
1. INTRODUCTION
Islands constitute excellent systems for studying divergence and speciation in
lizard populations because in most cases gene flow is almost completely absent
and each island becomes a discrete unit [15]. Patterns of genetic variation
among islands can thus be attributed to population history, founder events,
drift or selection. Divergence may be a direct consequence of geographic dis-
tance separating the populations (isolation-by-distance model [35]), although
selection may contribute to this divergence when populations are under different
ecological conditions [30]. All these processes may produce similar patterns of
population genetic structuringmaking it difficult to distinguishthese alternative
hypotheses. It has recently been shown [19] that rapid adaptative radiation
of lizards in similar environments could overcome historical contingencies,
producing morphological similar outcomes on genetically differentindividuals.
Natural selection acting in similar habitats can be the major force in generating
phenotypic (and thus morphological) diversity in lizards [19].
The Madeira Archipelago consists of Madeira and Porto Santo Islands plus
two groups of smaller islands (Selvagens and Desertas). Distances between the
islands vary from a few kilometres to 300 km (Fig. 1). Madeira is the largest
island and has a climate ranging from humid subtropical in the north to hot
and arid in the south and east. Porto Santo, Desertas, and Selvagens are arid,
with sparse vegetation. Except the presence of the gecko Tarentola bischoffi
in the Selvagens, Lacerta dugesii is the sole flightless vertebrate endemic to
the Archipelago. Its origin, (European or African) and the time and historical
colonization of the islands are unknown. The species does not have any
close relative in the Canary Islands, although this archipelago is close to the
Selvagens. According to morphological and molecular data, the sister species
of Lacerta dugesii is L. perspicillata, endemic to Morocco [17]. Lacerta
dugesii is a small lizard that shows considerable color and pattern variability
among populations [2,3,9,10]. Its phenotypic variation remains to be under-
stood but could be the result of selection over different habitats in Anolis and
Tropidurus [19,23,32]. The species is extremely abundant, occurring on all
islands of the archipelago, and occupying habitats ranging from sea level to the
highest point (1 800 meters) of Madeira. Lacerta dugesii is omnivorous and its
only natural predators are birds of prey and rats. Its taxonomic status remains
under discussion but here we have adopted the name Lacerta dugesii following
Arnold [1]. The species has been seen aboard the ships that occasionally link
Madeira Island with the Desertas and Selvagens groups (pers. obs.). The
heavy maritime traffic existing between the two inhabited islands (Madeira
and Porto Santo) makes the exchange of individuals between them extremely
plausible. Few studies have investigated intra-specific divergence of L. dugesii.
Morphological variation of the individuals on Madeira Island or among the four
Genetic variation of Lacerta dugesii 673
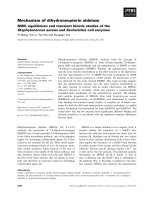
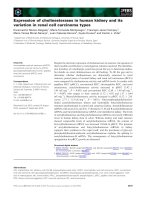
Figure 1. Map of the Archipelago of Madeira, showing the location of population
samples used in this work. Codes of populations are as follows: Madeira group of
islands (MA1, MA2, MA3), Desertas group of islands (DE1, DE2, DE3), Porto Santo
Island (PS), and the Selvagens group of islands (SE1, SE2).
groups of islands has been addressed [2,9]. Bischoff et al. [4] have presented
both morphological and allozyme data but the number of specimens studied was
relatively small (175 for the morphological characters, but only 22 individuals
from five islands were assayed for allozyme characters). A dendrogram based
on these data was consistent with the biogeographical distribution of L. dugesii
populations. Based on these studies, Bischoff et al. [4] proposed the existence
of three subspecies: Podarcis dugesii dugesii (Desertas Islands), P. dugesii
jogeri (Porto Santo Island) and P. dugesii selvagensis (Selvagens Islands) [4].
The population from Madeira was given no subspecific name.
In the present study, we examined allozyme variation within and among nine
populations distributed across the archipelago in order to look for any pattern
of genetic structure. The results revealed a rather weak pattern of genetic
differentiation in the populations of L. dugesii congruent with their geographic
distribution. The habitat shift prevailing in the different populations could favor
selection to act differently upon certain loci and therefore be responsible for
the pattern observed. A comparison of our results with those of Bischoff
et al. [4] inferred from morphological characters revealed a total lack of
congruence between the two types of data. Multidimensional analysis of
genetic distances based on these two types of data showed different geographic
clustering of the populations, a fact that may be due to a recent divergence
674 A. Brehm et al.
of populations, subjected to differential selective constraints and adapted to
different habitats.
2. MATERIALS AND METHODS
2.1. Samples and gel electrophoresis
Specimens of L. dugesii were collected from nine locations, spanning the
Madeira Archipelago (Fig. 1). Liver tissue was removed from 410 specimens
and frozen at −70
◦
C. The tissues were homogenized in an equal volume
of distilled water, followed by centrifugation at 10 000 g for 30 min at 4
◦
C.
Supernatants were collected and stored at −20
◦
C. Protocols for horizontal
starch gel electrophoresis and histochemical staining were similar to those
described previously [21]. Samples from two individuals of known electro-
phoretic mobility for a given locus were used in each gel as markers. Enzyme
systems are listed in the Appendix and buffer systems are available from the
authors upon request.
2.2. Analysis of genetic diversity
Allele frequencies and measures of intra- and inter-population vari-
ation (average heterozygosity, percent polymorphic loci, mean number of
alleles per locus, within and overall gene diversity) were estimated with
GENEPOPv3.1d [24]. Gene diversity parameters include within and over-
all gene diversity (Hs and Ht), and Nei [22] GST and GIS as measures
of gene diversity among populations [22,24,33,34]. Exact tests for diver-
gence from Hardy-Weinberg Equilibrium (HWE) were done for each locus in
each population with P-values estimated by the Markov chain method [16].
Population differentiation at each locus and over all loci among popula-
tions, was tested by estimating unbiased P-values of a log-likelihood G-exact
test, using FSTAT [13]. Random permutation procedures were used to test
whether values differed significantly from zero. The amount of gene flow
among populations was estimated within each island by substituting FST
with GST in Wright’s [34] island model of gene flow. This model estimates
Nm = (1 − GST)/2GST
α
with Nm being the effective number of migrants
per generation, and α =
n/(n − 1)
2, where n is the number of populations.
An AMOVA [12] on genotype frequencies in each population was performed
with the software ARLEQUIN [27], to test the hierarchical partitioning of
genetic variability within and among populations of the four groups of islands.
Significance of FST values was assessed by random permutation tests. Pairwise
Cavalli-Sforza and Edwards [6] chord distance was calculated and subjected
to Multidimensional Scaling (MDS) [18] using NTSYS-pc [26]. Correlation
between genetic and geographic distances among populations was tested with
Genetic variation of Lacerta dugesii 675
Option 6 of GENEPOPv3.1d [24], based on Slatkin and Maddison’s [29]
isolation by distance model, using F instead of FST [8]. Finally we performed
an MDS plot using the mean values of morphometric characters (meristics and
pholidotics) of individuals belonging to six populations of L. dugesii published
by Bischoff et al. [4]. The values were first standardized and a distance matrix
was constructed based on Euclidean distances. Whenever possible we kept the
same population codes to allow an easier comparison.
3. RESULTS
Twenty-three presumptive loci were scored for all populations (see
Appendix); three of these (AK, PGI and SOD) were monomorphic and were
excluded from data analysis. Mean number of alleles per locus was similar
across populations, varying from 1.7 to 2.1. Direct-count heterozygosity estim-
ates (H) ranged from 0.10 to 0.22. The percentage of polymorphic loci (pres-
ence of more than one allele) varied from 55% to 85% (see Appendix). Het-
erozygosity among populations did not differ significantly (two way ANOVA,
F = 1.68, NS), and island size and mean heterozygosity were not related
(F = 0.34, NS). There were no fixed differences between populations at any
locus. Some alleles were archipelago-specific: G3PDH-allele 3, AAT-allele 3
and G6PDH-allele 3 from the Selvagens Islands (SE1, SE2), Est-allele 4 and
LDH2-allele 3 from the Desertas Islands (DE2, DE3), MDH-alleles 5,6, PEP1-
allele 4 and PEP3-allele 4, which are specific to the Porto Santo Island (PS).
Most of the populations showed a high percentage of loci in which the most
common allele was at a frequencygreater than 90%. Only 16 out of 106 testsfor
conformity to HWE in individual loci in each population, showed a significant
deficit of heterozygotes when α was set to 0.005 (data not shown). Pooling
the genotypes into three classes: (1) homozygotes for the most common allele,
(2) common and rare heterozygotesand (3) rare homozygotes, therebyavoiding
classes with an expected low allele frequency,did not change the results. Table I
gives basic genetic diversity measures, P-values associated to Hardy-Weinberg
expectations for each locus across all populations, and probability exact tests
related to genotypic differentiation across all populations. All P-values were
subjected to Bonferroni corrections, and α was set to 0.002 since 20 tests were
done (0.05:20). Even so, seven loci showed deviation to HWE, all in the dir-
ection of heterozygote deficiency. Except for ME-1, PEP-2, G6PDH, LDH-1,
PGM-2 and XDH, genotypic distributions differed significantly (P < 0.0001)
across populations (Tab. I). We followed Nei [22] notation and measured
genetic differentiation among populations as GIS and GST. The mean values
of GIS and GST for all populations across all loci surveyed were 0.27 and 0.19
respectively. Unbiased estimates of log-likelihood (G)-based exact tests for
population differentiation revealed significant genotypic differences among all
676 A. Brehm et al.
populations, indicating a major pattern of heterogeneity among loci (Tab. I).
The same tests done between pairs of populations belonging to the four groups
of islands either within or among these groups gave similar results (data not
shown). The highest number of loci with significant P-values of genotypic
differentiation tests (in all cases P < 0.05, α = 0.002) was found between
population pairs MA1-MA2 and MA2-MA3 from Madeira Island (nine and
five loci respectively). Also, two populations of the Desertas group (DE2 and
DE3) showed seven loci with significant P-values. Pooling the populations
from the same group, and applying the same tests, led us to uncover some loci
such as EST, MDH and PEP-3, which consistently showed strong genotypic
structure among these groups. Other loci discriminate a particular group of
populations (AAT, G6PDH, ME-3 in Selvagens, or LAP and PEP-3 Porto
Santo island, data not shown). Three loci (PGM-2, XDH, MPI) did not show
any significant P-values related to genotypic differentiation either within or
among groups. Pooling the populations from each of the three archipelagos
(Madeira, Desertas and Selvagens) allowed us to compare the respective GST-
and GIS-values (Tab. II). The three populations from Madeira Island showed
the highest genotype heterogeneity. The GST-values depicted in Table II
also clearly indicate that the two populations from Selvagens were the least
differentiated.
The AMOVA results are shown in Table III and indicate that 99.7% of
the genetic differentiation existing in L. dugesii populations was due to intra-
population variation. Only a negligible amount of variation was attributed to
differences among populations within and among archipelagos. These values
confirm the analysis of variance done on heterozygosity estimates.
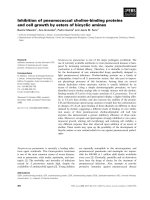
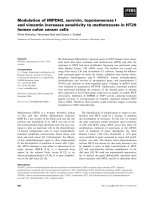
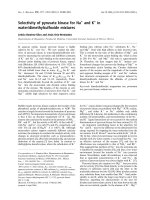
Multidimensional Scaling (MDS) plot based on Cavalli-Sforza and Edwards
chord distances (Fig. 2, left), shows a close proximity of the Desertas group
(DE1, DE2, DE3) to the MA3 population from Madeira Island and to a lesser
extent with the other populations from the same island (MA1 and MA2). The
two samples from the Selvagens (SE1 and SE2) and the sample from Porto
Santo (PS) Island appear to be slightly separated from the others. Although
one may be tempted to cluster the populations according to their geographic
origin, the truth is that they do not show clear and separate groups. Only the two
Selvagens remain close to each other as well DE3, DE1 and MA3. The fact is
that the plot from Figure 2, left, allows any kind of interpretation. To assess the
effects of geographicaldistanceon genetic divergence in L. dugesii populations,
pairwise FST-values were tested for correlation with geographic distances. No
significant correlation was found (r = 0.47, t = 2.9, P > 0.05). Finally,
the multidimensional scaling (MDS) plot based on the Bischoff morphological
characters gave different results from those obtained with the enzymatic data
(Fig. 2, right).
Genetic variation of Lacerta dugesii 677
Table I. Nei estimates of heterozygosity and gene diversity parameters, per locus,
over all populations of Lacerta dugesii and over all loci.
Loci Hs Ht GST GIS GD
(a)
HW ws
(b)
P-values P-values
ADH 0.11 0.14 0.23 0.37 * NS
G3PDH 0.28 0.33 0.15 0.15 * NS
EST 0.29 0.36 0.21 0.26 * *
AAT 0.32 0.36 0.11 −0.00 * NS
G6PDH 0.18 0.18 0.01 0.14 NS NS
IDH 0.17 0.19 0.12 0.31 * *
LAP 0.04 0.05 0.11 −0.13 * NS
LDH-1 0.10 0.11 0.03 0.25 NS NS
LDH-2 0.14 0.16 0.08 −0.09 * NS
MDH 0.38 0.59 0.38 0.59 * *
ME-1 0.14 0.14 0.03 0.25 NS NS
ME-3 0.35 0.46 0.27 0.37 * *
PEP-1 0.19 0.21 0.09 0.15 * NS
PEP-2 0.08 0.09 0.02 0.27 NS *
PEP-3 0.25 0.34 0.26 0.37 * *
PEP-4 0.10 0.11 0.09 0.36 * *
PGM-1 0.07 0.09 0.31 −0.47 * NS
PGM-2 0.03 0.03 0.00 0.01 NS NS
XDH 0.03 0.04 0.02 −0.03 NS NS
MPI 0.08 0.09 0.08 0.11 * NS
Mean 0.17 0.20 0.19 0.27 * *
* P = 0.0025, NS: non-significant;
(a)
Test for genotypic differentiation of populations using G-tests with 1 000 random-
isations [13];
(b)
P-values for testing Hardy-Weinberg within samples.
Table II. Genotypic differentiation parameters within three archipelagos, across loci
and populations of Lacerta dugesii.
Archipelago Hs Ht GST GIS HW
(a)
Nm
Madeira 0.15 0.18 0.19* 0.26 * 1
Desertas 0.19 0.20 0.09* 0.18 * 2
Selvagens 0.14 0.15 0.03* 0.28 * 4
* P < 0.05, α = 0.0025;
(a)
Significance of Hardy-Weinberg tests within samples based on FIS-values, with
1 000 randomisations.
678 A. Brehm et al.
Table III. Hierarchical AMOVA results based on genotype frequencies of Lacerta
dugesii populations.
Source of variation Df Sum of squares Percentage of variation FST
Among groups 3 7.15 0.11 0.0023*
Among populations,
within groups 5 6.59 0.19
Within populations 8 311 4 056.5 99.70
* P < 0.0001.
Figure 2. Left: Multidimensional Scaling (MDS) based on Cavalli-Sforza and
Edwards [6] chord distance, among populations of Lacerta dugesii plotted in two
dimensions. Right: MDS plot based on morphological data published by Bischoff
et al. [4].
4. DISCUSSION AND CONCLUSIONS
The expected heterozygosity values of L. dugesii (H = 0.13) averaged over
populations was higher than those previously reported for lizard island popula-
tions but similar or even higher than those reported for mainland populations [5,
7,11,14,20]. Podarcis muralis and P. oxycephala from the islets ofLake Skadar
have higher heterozygosity values relative to mainland populations [11]. How-
ever, populations of Lacerta melisellensis in the Adriatic islands have lower
heterozygosity values in more remote islands than in mainland populations, a
fact attributed to recent isolation of the islands [15]. Heterozygosity values
of Lacerta dugesii populations suggest that none had been subjected to a
strong genetic bottleneck. This is supported by the fact that the highest value
obtained (0.223) refer to a small island from the Desertas group. Of course,
one cannot rule out the possibility that migrations exist among the islands.
The high polymorphism level and the GST-values found for each archipelago
could easily be transformed into Nm > 1, thus suggesting that gene flow is
Genetic variation of Lacerta dugesii 679
actually taking place. The lack of fixed allele differences among populations
also supports a recent colonization by L. dugesii although it is impossible to
infer the time of colonization of each island from these data. Moreover the
most likely explanation for the heterozygote deficiencies found is to admit that
populations are structured on a microspatial scale, in other words, a Wahlund
effect.
The different GST-values for each locus among populations is a good indic-
ator that selection may be acting differently on some loci or, as Taylor et al. [31]
pointed out, gene flow is sufficiently strong to homogenize unselected loci. The
data do not suggest thatthe amount of gene flow is the same among populations;
this is not surprising given the different distances separating the various groups
of islands. The lowest value of Nm is found among the three populations
from Madeira Island, which are submitted to more diversified environmental
conditions, ultimately more efficiently favouring their isolation.
Population pairwise tests for genotype differentiation either on Madeira
Island or between populations on different islands reject the null hypothesis of
no genotypic differentiation. The AMOVA indicates that most of the genetic
variation of L. dugesii is found within populations, with much less variation
found among populations. Apparently, isolation by distance and oceanic
barriers has not lead to effective isolation and differentiation. The significant
overall GST-value of 0.19 suggests that some genetic structure exists, with the
GST-value for groups of populations being high in Madeira Island and low in
the Selvagens. It is population MA2 that contributes most to the differenti-
ation among the Madeira island populations, while the two populations from
Selvagens were not differentiated from each other (GST = 0.03).
Lacerta dugesii populations appear genetically distinct from each other
but do not show a clear pattern of genetic structuring compatible with their
geographic locations, as seen in the MDS plot based on the electrophoretic
data. The plot shows that the three samples from Desertas and sample MA3
from Madeira are relatively close which is not surprising, since Madeira Island
and the Desertas were certainly linked during the last glaciation periods around
18000 BP, and population MA3 inhabits an environment similar to the Desertas.
On the small Desertas Islands, the three populations are genetically similar
whereas they do not cluster together morphologically. This suggests that selec-
tion may be operating even in small areas on apparently similar environmental
conditions. Conversely, the three samples from Madeira Island appear to be
more different from one another than do samples from different islands. For
example, MA2 has been reported as having low lizard density with no gene
flow [3]. In fact, lizards in this region exist in high-density groups separated
by long distances. This area is environmentally very different from MA1 and
MA3, and its lizard population presents marked allelic differences from the
other two. The fact that MA2 does not appear close to the other two from the
680 A. Brehm et al.
same island in the plot of Figure 2, left, could indicate that some of the loci are
under strong selection.
The overall week correlation between genetic and geographic distances
indicates that genetic divergence among the islands is neither a function nor
the result of isolation by distance. In fact, our data suggest that L. dugesii
populations have a relatively recent dispersion history. Slatkin’s [28] model of
rapid colonization or population expansion, where a single ancestral population
gives rise to extant populations, could explain the observed pattern of genetic
divergence in L. dugesii, a case where the isolation-by-distance effect would
not be apparent if the “radiations” were recent.
A major conclusion is that the electrophoretic and morphological data
reveal different clustering of populations that could be explained by rapid
morphological adaptation to different habitats involving drastic changes in
morphology but not necessarily in allele frequencies. Others have reported
similar findings on lizards inhabiting ecologically different habitats [23,32]
and in sticklebacks [25]. Our hypothesis to explain the morphological clus-
tering of populations from different islands is that there is convergence of
some characters in similar environments, a fact already found in other lizard
populations [19]. Although there is some gene flow among the nine populations
of L. dugesii, it is not sufficient to override the morphological differences
observed, which may be driven by ecological selection and adaptation to the
particular environments prevailing in each habitat. Overall, our data point to
a weak phylogeographical structure of L. dugesii populations, which is not
in agreement with the morphological classification of these populations as
subspecies.
ACKNOWLEDGEMENTS
We thanktheParque Natural da Madeira for providing manyofthespecimens
used, Christian Biémont, Jean David and Paul Chippindale for critical com-
ments on the manuscript. José Jesus was a recipient of a post-graduate scholar-
ship from Fundação para a Ciência e Tecnologia, program PRAXIS XXI. Part
of this research was supported by JNICT contract PBIC/P/CEN/1096/92
to
Luis Vicente. The Centre of Biological and Geological Sciences is supported
by Fundação para a Ciência e Tecnologia through program PRAXIS XXI.
REFERENCES
[1] Arnold E., Towards a phylogeny and biogeography of the Lacertidae: relation-
ships within an old-world family of lizards derived from morphology, Bull. Br.
Mus. Nat. Hist. (Zool.) 55 (1989) 209–257.
Genetic variation of Lacerta dugesii 681
[2] Baez M., Observaciones de colorido y diseño de Podarcis dugesii en la isla de
Madeira (Sauria, Lacertidae), Vieraea 18 (1990) 197–203.
[3] Baez M., Brown R., Testing multivariate patterns of within-island differentiation
in Podarcis dugesii from Madeira, J. Evol. Biol. 10 (1997) 575–587.
[4] Bischoff W., Osenegg K., Mayer W., Untersuchungen zur subspezifischen Glie-
derung der Madeira-Mauereidechse, Podarcis dugesii (Milne-Edwards, 1829),
Salamandra 25 (1989) 237–259.
[5] Bobyn M., Darevsky I., Kupriyanova L., MacCulloch R., Upton D., Danielyan
F., Murphy R., Allozyme variation in populations of Lacerta raddei and Lacerta
nairensis (Sauria: Lacertidae) from Armenia, Amphibia-Reptilia 17 (1996) 233–
246.
[6] Cavalli-Sforza L., Edwards A., Phylogenetic analysis: models and estimation
procedures, Evol. 21 (1967) 550–570.
[7] Cirer A., Guillaume C., Electrophoretic analysis of the Pityusic islands lizard,
in: Rocek Z. (Ed.), Studies in Herpetology, Prague, 1996.
[8] Cockerham C., Weir B., Estimation of gene flow from F-statistics, Evol. 47
(1993) 855–863.
[9] Cook L.M., Variation in the Madeira lizard Lacerta dugesii, J. Zool. (Lond.) 187
(1979) 327–340.
[10] Crisp M., Cook L., Hereward F., Color and heat balance in the lizard Lacerta
dugesii, Copeia 2 (1979) 250–258.
[11] Crnobrnja-Isailovic J., Dzukic G., Aleksic I, Vujicic L., Avramov S., Podar-
cis muralis and Lacerta oxycephala (Reptilia: Lacertidae) on the islands
of Skadar Lake: Distribution and genetic relationships of populations, in:
Llorente G., Montori A., Santos X., Carretero M.A. (Eds.), Scientia Herpeto-
logica, Associación Herpetológica Española, Barcelona, 1995, pp. 71–80.
[12] Excoffier L., Smouse P.E., Quattro J.M., Analysis of molecular variance inferred
from metric distances among haplotypes: Application to human mitochondrial
DNA restriction data, Genet. 131 (1992) 479–491.
[13] Goudet, J., FSTAT v.1.2: A computer program to calculate F-statistics, J. Hered.
86 (1995) 485–486.
[14] Gorman G., Soule M., Yang S., Nevo E., Evolutionary genetics of insular adriatic
lizards, Evol. 29 (1975) 52–71.
[15] Gorman G., Buth D., Soule M., Yang S., The relationships of the Anolis crista-
tellus species group: electrophoretic analysis, J. Herpet. 14 (1980) 269–278.
[16] Guo S.W., Thompson E.A., Performing the exact test of Hardy-Weinberg pro-
portions for multiple alleles, Biometrics 48 (1992) 361–372.
[17] Harris D.J., Arnold E.N., Thomas, R.H., Relationships of lacertid lizards (Rep-
tilia: Lacertidae) estimated from mitochondrial DNA sequences and morphology,
Proc. Roy. Soc. London Ser. B 265 (1998) 1939–1948.
[18] Lessa E., Multidimensional analysis of geographic genetic structure, Syst. Zool.
39 (1990) 242–252.
[19] Losos J.B., Jackman T.R., Larson A., Queiroz K., Rodríguez-Schettino L., Con-
tingency and determinism in replicated adaptative radiations of island lizards,
Science 279 (1998) 2115–2118.
[20] MacCulloch R., Fu J., Darevsky I., Danielyan F., Murphy R., Allozyme variation
in three closely related species of Caucasian rock lizards (Lacerta), Amphibia-
Reptilia 16 (1995) 331–340.
682 A. Brehm et al.
[21] Murphy R., Sites J., Buth D., Haufler C., Proteins I: Isozyme electrophoresis,
in: Hillis D., Moritz C. (Eds.), Molecular Systematics, Sinauer Associates,
Sunderland, MA, 1990, pp. 45–126.
[22] Nei M., F-statistics and analysis of gene diversity in subdivided populations,
Ann. Hum. Genet. 41 (1977) 225–233.
[23] Orr M., Smith TH., Ecology and Speciation, TREE 13 (1998) 502–506.
[24] Raymond M., Rousset F., GENEPOP (v.1.2): a population genetics software for
exact test and ecuniscism, J. Hered. 95 (1995) 248–249.
[25] Rundle H., Nagel L., Baughman J., Schluter D., Natural selection and parallel
speciation in sympatric sticklebacks, Science 287 (2000) 306–308.
[26] Rohlf F., NTSYS-pc: Numerical Taxonomy and Multivariate Analysis System,
Exeter Software, New York, 1990.
[27] Schneider S., Kueffer J-M., Roessli D., Excoffier L., Arlequin ver. 1.1: A
software for population genetic data analysis, Genetics and Biometry Laboratory,
University of Geneva, 1997.
[28] Slatkin M., Isolation by distance in equilibrium and non-equilibrium populations,
Evol. 47 (1993) 264–279.
[29] Slatkin M., Maddison, W., Detecting isolation by distance using phylogenies of
genes, Genet. 117 (1990) 149–153.
[30] Sokal R.R., Jacquez G.M., Wooten M.C., Spatial autocorrelation analysis of
migration and selection, Genet. 121 (1989) 845–855.
[31] Taylor M.F., Shen Y., Kreitman M.E., A population genetic test of selection at
the molecular level, Science 270 (1995) 1497–1499.
[32] Vitt L., Caldwell J., Zani P., Titus T., The role of habitat shift in the evolution
of lizard morphology: Evidence from tropical Tropidurus, Proc. Nat. Acad. Sci.
U.S.A. 94 (1997) 3828–3832.
[33] Weir B., Cockerham C., Estimating F-statistics for the analysis of population
structure, Evol. 38 (1984) 1358–1370.
[34] Wright S., The genetical structure of populations, Ann. Eugen. 15 (1951) 323–
354.
[35] Wright S., Evolution and Genetics of Populations, Vol. 4: Variability within and
among Natural Populations, UCP, Chicago, 1978.
Genetic variation of Lacerta dugesii 683
APPENDIX
Table IV. Allele frequencies per locus, in Lacerta dugesii populations. N, is the
number of individuals sampled. Codes of populations are as in Figure 1. (continued
on next pages)
Loci Populations
SE1 SE2 MA1 MA2 MA3 PS DE1 DE2 DE3
1.ADH
(N) 20 19 24 18 15 24 23 14 24
1 0.97 1.0 1.0 0.69 1.0 1.0 0.67 1.0 0.98
2 0.02 0.00 0.00 0.30 0.00 0.00 0.33 0.00 0.02
2.G3PDH
(N) 18 17 50 18 15 24 50 14 24
1 0.78 0.76 0.96 0.64 1.0 0.58 0.87 1.0 0.63
2 0.11 0.12 0.04 0.36 0.00 0.42 0.13 0.00 0.37
3 0.11 0.12 0.00 0.00 0.00 0.00 0.00 0.00 0.00
3.EST
(N) 20 19 24 18 20 24 24 14 24
1 0.93 0.87 0.98 0.94 1.0 0.81 0.65 0.36 0.48
2 0.06 0.13 0.02 0.03 0.00 0.17 0.35 0.43 0.29
3 0.00 0.00 0.00 0.03 0.00 0.02 0.00 0.00 0.00
4 0.00 0.00 0.00 0.00 0.00 0.00 0.00 0.21 0.23
4.AAT
(N) 20 17 24 18 15 24 23 14 15
1 0.67 0.62 1.0 0.72 0.93 0.71 0.59 0.82 0.93
2 0.10 0.35 0.00 0.28 0.07 0.29 0.41 0.18 0.07
3 0.23 0.03 0.00 0.00 0.00 0.00 0.00 0.00 0.00
5.G6PDH
(N) 20 19 24 18 20 24 24 14 24
1 0.92 0.84 0.94 0.92 0.90 0.96 0.83 0.89 0.92
2 0.03 0.00 0.06 0.08 0.10 0.04 0.17 0.11 0.08
3 0.05 0.16 0.00 0.00 0.00 0.00 0.00 0.00 0.00
6.IDH
(N) 20 19 24 13 15 24 24 14 24
1 0.90 0.87 0.60 1.0 1.0 0.98 0.92 0.93 0.87
2 0.10 0.13 0.40 0.00 0.00 0.02 0.08 0.07 0.13
7.LAP
(N) 24 26 26 28 24 24 26 10 7
1 1.0 1.0 1.0 1.0 1.0 0.83 1.0 0.95 1.0
2 0.00 0.00 0.00 0.00 0.00 0.17 0.00 0.05 0.00
8.LDH-1
(N) 20 19 24 18 20 24 23 14 24
1 1.0 0.95 1.0 0.97 0.95 0.85 0.91 0.86 1.0
2 0.00 0.05 0.00 0.03 0.05 0.15 0.09 0.14 0.00
684 A. Brehm et al.
Table IV. continued.
Loci Populations
SE1 SE2 MA1 MA2 MA3 PS DE1 DE2 DE3
9.LDH-2
(N) 20 19 24 18 20 24 24 14 25
1 1.0 0.79 0.96 0.92 1.0 1.0 0.96 0.82 0.80
2 0.00 0.21 0.04 0.08 0.00 0.00 0.00 0.18 0.18
3 0.00 0.00 0.00 0.00 0.00 0.00 0.04 0.00 0.02
10.MDH
(N) 26 26 32 41 35 24 26 9 6
1 0.86 0.96 0.22 0.00 0.38 0.00 0.38 0.22 0.17
2 0.04 0.00 0.37 0.00 0.00 0.00 0.00 0.00 0.00
3 0.00 0.04 0.41 0.91 0.56 0.67 0.62 0.78 0.83
4 0.10 0.00 0.00 0.00 0.06 0.04 0.00 0.00 0.00
5 0.00 0.00 0.00 0.09 0.00 0.12 0.00 0.00 0.00
6 0.00 0.00 0.00 0.00 0.00 0.17 0.00 0.00 0.00
11.ME-1
(N) 26 26 40 47 38 24 26 9 8
1 0.98 0.94 0.99 0.95 0.87 0.98 0.88 0.94 0.81
2 0.02 0.06 0.00 0.02 0.08 0.02 0.06 0.06 0.00
3 0.00 0.00 0.01 0.03 0.05 0.00 0.06 0.00 0.19
12.ME-3
(N) 46 46 38 65 52 48 50 14 24
1 0.40 0.36 0.80 0.93 0.34 0.87 0.60 0.93 0.92
2 0.59 0.64 0.13 0.01 0.53 0.07 0.33 0.00 0.08
3 0.01 0.00 0.07 0.06 0.13 0.06 0.07 0.07 0.00
13.PEP-1
(N) 23 26 64 47 35 24 26 8 7
1 0.96 1.0 0.72 0.94 0.90 0.83 0.69 0.94 1.0
2 0.00 0.00 0.16 0.00 0.01 0.13 0.04 0.00 0.00
3 0.04 0.00 0.12 0.06 0.09 0.00 0.27 0.06 0.00
4 0.00 0.00 0.00 0.00 0.00 0.04 0.00 0.00 0.00
14.PEP-2
(N) 20 26 34 42 38 24 26 9 8
1 0.98 0.94 0.90 1.0 0.91 1.0 0.89 1.0 1.0
2 0.02 0.06 0.06 0.00 0.00 0.00 0.02 0.00 0.00
3 0.00 0.00 0.04 0.00 0.09 0.00 0.09 0.00 0.00
15.PEP-3
(N) 42 42 64 65 38 23 50 14 18
1 0.76 0.97 0.96 0.82 0.91 0.24 0.87 0.93 0.67
2 0.00 0.00 0.00 0.01 0.03 0.00 0.02 0.00 0.00
3 0.24 0.03 0.04 0.17 0.06 0.67 0.11 0.07 0.33
4 0.00 0.00 0.00 0.00 0.00 0.09 0.00 0.00 0.00
Genetic variation of Lacerta dugesii 685
Table IV. continued.
Loci Populations
SE1 SE2 MA1 MA2 MA3 PS DE1 DE2 DE3
16.PEP-4
(N) 25 26 36 42 38 24 26 9 8
1 0.96 1.0 0.82 0.99 0.77 0.94 1.0 1.0 1.0
2 0.04 0.00 0.11 0.00 0.21 0.00 0.00 0.00 0.00
3 0.00 0.00 0.07 0.01 0.02 0.06 0.00 0.00 0.00
17.PGM-1
(N) 24 26 26 28 24 24 26 10 7
1 1.0 1.0 0.98 0.63 1.0 1.0 0.96 1.0 1.0
2 0.00 0.00 0.02 0.37 0.00 0.00 0.00 0.00 0.00
3 0.00 0.00 0.00 0.00 0.00 0.00 0.04 0.00 0.00
18.PGM-2
(N) 23 26 26 28 24 24 26 10 7
1 1.0 1.0 0.96 0.98 1.0 1.0 0.98 0.95 1.0
2 0.00 0.00 0.04 0.02 0.00 0.00 0.00 0.00 0.00
3 0.00 0.00 0.00 0.00 0.00 0.00 0.02 0.05 0.00
19.XDH
(N) 20 19 24 18 15 24 24 14 24
1 1.0 1.0 0.96 0.94 1.0 0.94 1.0 1.0 1.0
2 0.00 0.00 0.04 0.06 0.00 0.06 0.00 0.00 0.00
20.MPI
(N) 20 19 24 18 16 24 22 14 16
1 0.97 1.0 0.96 1.0 0.97 1.0 0.78 0.96 0.94
2 0.03 0.00 0.04 0.00 0.03 0.00 0.22 0.04 0.06
Mean of number of alleles
2.0 1.7 2.0 2.0 1.9 2.0 2.1 1.8 1.7
Percentage of polymorphic loci
0.70 0.60 0.80 0.80 0.55 0.70 0.85 0.70 0.60
Mean of observed heterozygosity (H)
0.108 0.098 0.102 0.142 0.094 0.135 0.223 0.115 0.133
(ST. error) (0.031) (0.030) (0.025) (0.040) (0.024) (0.038) (0.043) (0.030) (0.038)
Expected Heterozygosity
0.141 0.145 0.157 0.163 0.137 0.187 0.246 0.151 0.169
(ST. error) (0.038) (0.038) (0.042) (0.037) (0.040) (0.042) (0.041) (0.037) (0.044)
HWE
(a)
estimates
* * * NS * * * NS NS
FIS
(b)
* * * NS * * NS * NS
Adenylate kinase (AK) 2.7.4.3; Alcohol Dehydrogenase (ADH) 1.1.1.1; Aspartate aminotransferase
(AAT) 2.6.1.1; Esterase (EST) 3.1.1 ; Glucose-6-phosphate Dehydrogenase (G6PDH) 1.1.1.49;
Glycerol-3-phosphate Dehydrogenase (G3PDH) 1.1.1.8; Isocitrate Dehydrogenase (IDH) 1.1.1.42;
L-Lactate Dehydrogenase (LDH-1, LDH-2) 1.1.1.27; Leucine Aminopeptidase (LAP) 3.4.11 ; Mal-
ate Dehydrogenase NAD (MDH) 1.1.1.37; Malate Dehydrogenase NADP (ME-1, ME-2) 1.1.1.40;
Manose-6-phosphate Isomerase (MPI) 5.3.1.8; Peptidase (PEP-1, PEP-3) 3.4 ; Peptidase (PEP-2,
PEP-4) 3.4 ; Phosphoglucose Isomerase (PGI) 5.3.1.9; Phosphoglucomutase (PGM - 1 , PGM-2)
5.4.2.2; Superoxide Dismutase (SOD) 1.15.1.1; Xanthine Dehydrogenase (XDH) 1.1.1.204.
* P < 0.0025;
(a)
Unbiased estimate of P-values using the Markov chain method;
(b)
P-values
of FP within samples, with 1 000 randomisations.