Báo cáo khoa hoc:"A higher resolution radiation hybrid map of bovine chromosome 13" docx
Bạn đang xem bản rút gọn của tài liệu. Xem và tải ngay bản đầy đủ của tài liệu tại đây (142.75 KB, 13 trang )
Genet. Sel. Evol. 34 (2002) 255–267
255
© INRA, EDP Sciences, 2002
DOI: 10.1051/gse:2002007
Original article
A higher resolution radiation hybrid map
of bo vine chromosome 13
Jörg S
CHLÄPFER
a∗
, Nasikhat S
TAHLBERGER
-S
AITBEKOVA
a
,
Sergio C
OMINCINI
b
, Claude G
AILLARD
a
,DavidH
ILLS
c
,
Rudolf K. M
EYER
d
, John L. W
ILLIAMS
c
,JimE.W
OMACK
e
,
Andreas Z
URBRIGGEN
d
, Gaudenz D
OLF
a
a
Institute of Animal Genetics, Nutrition and Housing,
Faculty of Veterinary Medicine, University of Berne,
Bremgartenstrasse 109 a, 3012 Berne, Switzerland
b
Department of Genetics and Microbiology, University of Pavia,
Via Ferrata 1, 271000 Pavia, Italy
c
Division of Genomics and Bioinformatics, Roslin Institute (Edinburgh),
Roslin, Midlothian, EH25 9PS, UK
d
Institute of Animal Neurology, Faculty of Veterinary Medicine,
University of Berne, Bremgartenstrasse 109 a, 3012 Berne, Switzerland
e
Department of Veterinary Pathobiology, College of Veterinary Medicine,
Texas A&M University, College Station, Texas 77843, USA
(Received 25 June 2001; accepted 7 December 2001)
Abstract – In this paper, we present a radiation hybrid framework map of BTA13 composed of
nine microsatellite loci, six genes and one EST. The map has been developed using a recently
constructed 12
000 rad bovine-hamster whole-genome radiation hybrid panel. Moreover, we
present a comprehensive map of BTA13 comprising 72 loci, of which 45 are microsatellites,
20 are genes and seven are ESTs. The map has an estimated length of 2694.7 cR
12
000
.The
proposed order is in general agreement with published maps of BTA13. Our results only partially
support previously published information of five blocks of conserved gene order between cattle
and man. We found no evidence for the existence of an HSA20 homologous segment of coding
DNA on BTA13 located centromeric of a confirmed HSA10 homologous region. The present
map increases the marker density and the marker resolution on BTA13 and enables further
insight into the evolutionary development of the chromosome as compared to man.
bovine chromosome 13 / radiation hybrid / gene mapping / 12
000 rad / comparative
mapping
∗
Correspondence and reprints
E-mail:
256 J. Schläpfer et al.
1. INTRODUCTION
Whole-genome radiation hybrid (WG-RH) mapping (e.g. [24]) has become
the method of choice for the merging of type I markers such as conserved genes
or expressed sequence tags (ESTs) with highly polymorphic type II markers
(i.e. microsatellites) from recombination based marker maps. Womack and
coworkers [25] reported a bovine WG-RH panel, created using 5
000 rad of
gammarays (RH
5
000
). This panel hasbeen extensivelyused for theconstruction
of single chromosome specific framework maps (e.g. [2,14]) and a map of the
entire cattle genome [3].
A total of 99 loci are assigned to BTA13, of which 41 are of type I and 58
are microsatellites
1
.TheRH
5
000
map for BTA13 [18] as well as the whole
genome map [3] are limited in the number of markers included. The BTA13
specific RH
5
000
map [18] includes 27 markers of which 11 are type I loci, while
the bovine whole genome RH map contains a total of 37 markers on BTA13,
comprising 29 type I and eight type II markers [3]. Thus, although the RH
map of Band and coworkers [3] locates a considerable number of genes and
ESTs on BTA13, these type I are poorly embedded in a microsatellite frame-
work, whereas in the map by Schläpfer and coworkers [18] the microsatellite
framework is sound but the type I content should be improved.
BTA13 is of particular interest, since the bovine prion protein gene (PRNP)
resides on this chromosome [16]. PRNP potentially plays a key role in the
development of bovine spongiforme encephalopathy (BSE). The physical pos-
ition of PRNP has been localized on the BTA13 band q17 [19] by fluorescent
in situ hybridization (FISH).
Bovine/human ZOO-fluorescence in situ hybridization (ZOO-FISH) studies
have identified homologous chromosome segments between cattle and man
(e.g. [22]). BTA13 has been reported to be homologous to parts of the human
chromosomes 10 and 20 (HSA10 and HSA20), in that BTA13 seems to be
composed of an HSA10 segment sandwiched by centromeric and telomeric
HSA20 regions. The HSA10 homologous segment on BTA13 is represented
by the interleukin 2 receptor alpha (IL2RA) and vimentin (VIM).
The goal of the present study was to refine the resolution of the BTA13 map
using a 12
000 rad bovine-hamster WG-RH panel [15] and to order as many
microsatellites and type I markers as possible. This would allow to define the
breakpoints between HSA10 and HSA20 and to evaluate and expand previous
findings of five blocks of conserved locus orders on BTA13 [18].
2. MATERIALS AND METHODS
The construction and characterization of the 12
000 rad whole genome-
radiation hybrid (WG-RH) panel has previously been described [15].
1
/>Radiation hybrid map of BTA13 257
2.1. Loci, PCR primers and conditions
Forty-five of the 72 markers were microsatellites, 20 were genes and seven
ESTs. Where available, published primer sequences and PCR conditions were
used. Primer pairs for GHRH, PRMS and PRND were designed de novo,
using the OLIGO 5.0 program package (National Biosciences, Plymouth, MN,
USA). The PCR fragments were 350, 323 and 235 base pairs (bp) long
respectively. The sense and antisense primer sequences for GHRH were
5
CTGCCTTCCCAAGCCTCTCA and 5
AGCTGGCCCAGAACCTTCC,
for PRMS 5
ATGTTGGAAAATTGCTGGTG and 5
CGGTCTGATTTTTGT-
CATCA and for PRND 5
GGAGTGGAGGGCAATA GGT and 5
AGT -
CACAGTGCTTGGTGGAG. For these three markers, a touch-down PCR
program [7] was implemented. Standard PCR were carried out in 12 µL
containing 2 µL of WG-RH DNA, 2.5 pmol of each primer, 0.25 mM of each
dNTP 1× PCR buffer with 1.5 mM MgCl
2
(Appligene, Gaithersburg MD,
USA) and 0.35 unit Taq polymerase (Appligene).
2.2. Genotyping
A s et of 180 HAT-resistant WH-RH clones was available for typing. All
72 markers were analyzed in duplicate for the presence or absence of a bovine-
specific PCR product. Markers were retyped whenever the results were ambigu-
ous. Generally, typing was performed on 8% denaturing polyacrylamide gels
using a LI–COR DNA s equencer model 4200 (LI–COR, Lincoln, NE, USA).
For the type I markers CSNK2A1, HCK, VIM, PLC–II/PLCG1 and THBD
amplification products were electrophoresed on 2% Sea Kem, HGT agarose
(FMC Bio Products, Rockland, ME, USA), ethidium bromide stained and then
photographed.
2.3. Statistical analysis and generation of the RH map
Cell lines that retained none of the 72 BTA13 markers tested, were excluded
from the subsequent analyses. Only one of the cell lines showing identical
retention patterns for all 72 doubly typed loci was included in the analyses.
The RHMAP statistical software program package version 3.00 [6,10] was
used for data analysis. First, the RH2PT option was used to estimate marker
retention frequencies and to identify markers with identical retention patterns.
The same option was used for the two-point analysis with lod score thresholds
of 3.0 and 5.0.
The RHMAXLIK option was used for the development of the framework
as well as the comprehensive map. Due to the large number of markers, the
stepwise loci ordering strategy was implemented. Data were analyzed under
the equal retention model with a SAVMAX setting of 9.00. Initially, all loci
258 J. Schläpfer et al.
were used for the development of the framework map ordered with a relative
likelihood of 1000:1 (ADDMIN 3.00). The loci ordered with this level of
support were then forced in this order and the program was rerun to add loci
with a level of support of 100:1 (ADDMIN 2.00). Again, loci ordered this way
were forced into the most likely order. As many as possible additional rounds
of adding loci at a given ADDMIN setting and forcing them into the most likely
order were performed before decreasing the level of the support. The support
level steps applied were 3.00, 2.00, 1.00, 0.50 and 0.00.
In parallel, all markers forming a linkage group of at least three loci at lod
score level 5.0 based on the two-point analysis (RH2PT), were ordered with a
relative likelihood of 1000:1 (ADDMIN 3.00).
3. RESULTS
Following the removal of uninformative hybrids, a total number of 134
hybrids were used in the analysis. The two genes- oxytocin (OXT) and arginine-
vasopressin (AVP), and the two microsatellite markers, BMC1222 and HEL7,
showed identical retention patterns. The average marker retention frequency
in the hybrids was 18.8% with the lowest for the PRMS microsatellite in the
PRNP gene (10.4%) and the highest for the EST BE217542 (32.1%). Retention
frequencies for all the loci are given in Figure 2. One hundred and thirty-four
unique retention patterns were detected for the 72 loci tested. At lod 5.0, the
72 loci were divided into ten linkage groups (Tab. I).
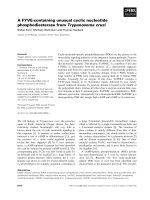
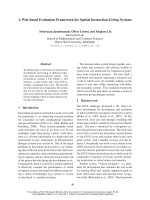
A framework map consisting of sixteen loci ordered with odds greater than
1000:1 was developed (Fig. 1). The framework map was oriented relatived to
the centromere being based on published, FISH derived physical assignments
of PRNP and the microsatellite BL42 [19]. The linear locus order of the
framework map is: centromere – BE217508 – URB058 – BMS1669 – PRNP –
PRMS – CHGB – BMS9248 – ETH7 – BL42 – PCK1 – BMS1226 – RM327 –
CSNK2A1 – HCK – BMS1784 – AHCY.
−−−−−−−−−−−−−−−−−−−−−−−−−−−−−−−−−−−−−−−−−−−−−−−−−−−−−−−−−−−−→
Figure 1. Comprehensive radiation hybrid map of BTA13 comprising 72 loci. Type I
loci are in italics. Two-point analysis of all loci, calculated with the option RH2PT of
the RHMAP program package defined ten linkage groups at lod score 5.0. The loci
of linkage groups 1, 3, 4, 5, 6, 7, 8 and 9 were ordered within the respective linkage
group (middle axis). The level of support for the orders of selected markers within the
linkage groups are indicated at the far right side. Markers that connect ordered linkage
groups protrude on the right side of the middle axis. Loci ordered within the linkage
groups with lower levels of support stick out on the left side of the middle axis. The
markers are color coded for the over all lod scores of the comprehensive map. Loci in
red are ordered with lod ≥ 3.0, loci in blue are ordered with lod ≥ 2.0, loci in green
are ordered with lod ≥ 1.0, loci in pink are ordered with lod ≥ 0.5 and loci in black
are ordered with lod 0.0.
Radiation hybrid map of BTA13 259
AF2
TGLA6
TGLA23
BMS1742
H12715
BMC1222/HEL7
IL2RA
BMS1231
ILSTS59
BMS1145
VIM
BM720
INRA52
BMS1580
ILSTS86
URB058
PRMS
CHGB
BMS9248
ETH7
BL42
PCK1
BMS1226
RM327
CSNK2A1
HCK
BMS1784
AHCY
BE217456
GHRH
CSSM030
PLCII
BL1071
BE217556
JAB3
BMS995
BMS2319
BMS6548
DIK93
CSSM017
DIK83
BE217429
MILSTS77
BMS1352
BE217427
HUJ616
INRA105
THBD
BE217508
URB007
UWCA25
ASIP
BE217542
PPGB
PLTP
AGLA232
INRA196
RM215
BMS1676
BMS813
GNAS1
TGLA381
DIK54
SOD1L
AVP/OXT
PDYN
BMS4509
BMS1669
PRNP
PRND
Linkage group 8 and 9: 3 loci
ordered with lod 3.33
Linkage group 5: 4 loci
ordered with lod 6.38
Linkage group 3: 5 loci
ordered with lod 3.44
Linkage group 4: 3 loci
ordered with lod 3.79
Linkage group 1: 13 loci
ordered with lod 3.19
Linkage group 7: 6 loci
ordered with lod 3.43
Linkage group 6: 6 loci
ordered with lod 6.73
260 J. Schläpfer et al.
Table I. Linkage groups and their loci at lod score level 5.0 derived from two point
analysis.
Linkage group Lod score 5.0
1 ETH7, BL42, TGLA381, BM9248, UWCA25, PRMS, BMS1669,
BM4509, PRNP, BMS1676, BMS1226, BMS813, RM215, RM327,
URB007, AHCY, ASIP, PDYN, BMS1784, CHGB, DIK54,
GNAS1, OXT/A VP, SOD1L, URB058, PCK1, CSNK2A1, HCK,
BE217542, PRND
2 HUJ616, INRA05
3 MILSTS77, BM720, BMS1352, BMS1145, BMS1231, ILSTS59,
VIM, BE217427
4 BMS1580, ILSTS86, INRA52, THBD, BE217508
5 BMC122/HEL7, BMS1742, IL2RA, AF213840/H12715
6 JAB3, AGLA232, BMS6548, PLTP, PPGB, BMS2319, BMS995,
CSSM17, DIK93
7 CSSM30, BL1071, INRA196, GHRH, PLC-II, BE217456,
BE217556
8 AF2, TGLA6
9 DIK83, TGLA23
10 BE217429
In a parallel approach, the markers in the linkage groups consisting of more
than three loci at lod 5.0 were ordered separately. The microsatellites DIK83
and TGLA23 as well as AF2 and TGLA6 fell into separate linkage groups at a
lod 5.0 (Tab. I), but merged into one at a lod 3.0 (data not shown). The ordering
of markers within linkage groups led to seven subsets of loci, each ordered
with odds greater than 1000:1 (Fig. 1) and thus each representing a framework
map of the linkage group.
The most likely comprehensive RH
12
000
map, based on two-point analysis
and data analysis using the program option RHMAXLIK, is depicted in Fig-
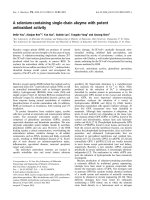
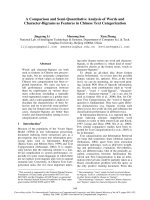
ure 1. Figure 2 shows the relative distance of the 70 loci in the comprehensive
map indicated in cR
12
000
as estimated by the multi-point analysis program.
4. DISCUSSION
Due to the identical retention patterns for the two microsatellites BMC1222
and HEL7, as well as the two genes AVP and OXT, the four loci were treated
as two marker pairs (BMC1222/HEL7 and AVP/OXT), reducing the number of
loci in the final map to 70. An identical retention pattern of two loci can either
be due to the loci being identical or the loci being too close together to resolve
their r elative position. The typing results of AVP and OXT are in agreement
Radiation hybrid map of BTA13 261
CENTROMERE
BE217429
AF2
TGLA6
D
IK83
TGLA23
BMS1742
AF213840/H1271
BMC1222/HEL
7
I
L2RA
BMS1231
M
ILSTS7
7
BMS1352
I
LSTS59
BMS1145
VI
M
BM720
BE21742
7
H
UJ616
I
NRA105
I
NRA52
THBD
BMS1580
I
LSTS86
BE217508
URB00
7
UWCA25
URB058
BMS4509
BMS1669
P
RNP
P
RND
P
RM
S
CHGB
BMS9248
TGLA381
dist.
105.0
32.1
80.9
48.2
111.8
50.6
24.2
31.3
111.3
13.2
7.6
41.6
36.7
36.9
55.6
60.4
74.4
31.9
85.2
13.1
24.2
12.7
35.2
93.5
7.9
2.6
2.6
20.2
16.5
7.5
30.2
24.5
28.3
15.5
D
IK54
SOD1L
AVP/OX
T
P
DY
N
ETH
7
RM215
BMS1676
BMS813
GNAS1
BL42
P
CK1
BMS1226
RM32
7
CSNK2A1
H
CK
BMS1784
AHC
Y
ASIP
BE217542
BE217456
GHR
H
CSSM030
P
L
C
-
I
I
BL1071
I
NRA196
BE217556
P
PGB
P
LTP
AGLA232
JAB3
BMS995
BMS2319
BMS6548
D
IK93
CSSM01
7
TELOMERE
dist.
2.4
37.6
23.3
37.9
66.3
78.7
17.7
9.4
19.2
20.9
61.1
24.7
33.0
23.9
38.9
53.1
50.1
4.2
33.4
116.8
29.2
26.6
47.7
37.0
45.0
30.8
89.8
2.4
64.2
76.0
40.6
9.1
6.4
21.0
42.5
ret. fre
q
.
14.9
17.2
14.9
21.8
19.4
20.1
17.9
17.2
16.4
16.4
15.8
16.4
17.9
18.8
17.9
19.5
17.2
16.4
15.7
15.8
16.4
18.7
16.4
23.1
15.7
13.5
14.2
13.4
14.2
15.7
17.9
10.4
15.0
17.9
16.4
ret. fre
q
.
17.2
17.9
20.1
20.1
19.5
18.7
19.5
20.9
22.4
24.6
19.4
23.9
20.1
15.8
17.2
23.3
25.4
25.4
32.1
17.2
14.3
14.9
17.2
18.8
17.6
20.1
17.9
17.3
27.6
17.9
23.3
24.6
23.9
23.1
26.9
Figure 2. Linear marker order of the comprehensive map. The relative distance
between the loci indicated in cR
12
000
was estimated according to the RHMAXLIK
multi-point analysis program option of the RHMAP package. The total map length
is 2694.7 cR
12
000
. The program option RH2PT was used to determine the retention
frequencies in percent for all loci tested.
with previous findings [18,19], which showed tight linkage of the t wo genes
in cattle. In humans, Sausville and coworkers [17] found AVP and OXT to be
closely linked, and Marini et al. [12] found an intergenic sequence of 3.5 kb
separating AVP and OXT in the mouse. Sequence comparisons of database
entries of 351 nucleotides of the microsatellite BMC1222 (EMBL: G19106)
and 516 nucleotides of HEL7 (EMBL: X65210) did not reveal evidence for
the identity of the two markers (data not shown). The distance between both
marker pairs AVP/OXT and BMC1222/HEL7 is therefore below the resolution
of the RH
12
000
mapping panel.
262 J. Schläpfer et al.
Rexroad and coworkers [15] found an average retention frequency of 30.6%
for 18 BTA1 specific markers tested in 88 RH
12
000
hybrids, whereas our ana-
lyses of 72 BTA13 specific markers in 134 hybrids indicate a lower retention
frequency of 18.8%. We selected the 134 RH cell lines in order to reach a
maximal number of unique retention patterns for the tested loci. The retention
frequency of the 27 markers in the RH
5
000
panel was 26.4% [18], as compared
to 17.8% of the same set of markers in the RH
12
000
panel. Since the bovine
RH
12
000
panel [15] has not been used for a chromosome wide mapping effort
yet, we wanted to type all available hybrids. The reduction to 134 hybrids
in the analysis was based on the retention of BTA13 specific markers and the
exclusion of identical clones. For practical reasons it would be advantageous
to reduce the number of hybrids to 90 to use a single 96-well PCR plate for
amplification. Selecting clones based on high retention frequencies would
allow to set up such a panel for the use on other bovine chromosomes.
Apart from the BMS1669 microsatellite, the linear locus order of the
16 framework markers is in agreement with four linkage maps [4,9,20,23],
the two RH
5
000
maps [3,18] as well as findings from physical assignments [8,
19]. Except for EST BE217508, all loci that constitute the RH
12
000
framework
map are members of linkage group 1 at a lod score level of 5.0 (Tab. I). Markers
in this linkage group are located in the mid-chromosomal region of BTA13.
This location is characterized by a relatively high density of markers, that leads
to a higher number of informative typing results. This in turn seems to result in
an optimal data structure, that facilitates marker ordering as compared to loci
in a more telomeric or centromeric position.
In contrast to the RH
5
000
map [18], where the GNAS1 locus served as a
framework marker between BL42 and HCK, GN AS1 could not be included in the
RH
12
000
map in this function. Construction of the comprehensive map located
GNAS1 between ETH7 and BL42 with odds of ≥ 100:1. When using the loci
that form linkage group 1, without the microsatellites ETH7 and BMS9248,
the order BL42 – GNAS1 – BMS813 – BMS1676 – RM215 hadalodscore
of 4.06 (data not shown). It is likely that the typing information of additional
markers in this chromosomal region improves the ordering capabilities of a
given mapping panel, leading to the revision of previous findings.
The loci within the seven linkage groups, that are ordered with odds greater
than 1000:1 (Fig. 1) show no discrepancy to the orders of framework markers
found in other marker maps. However, the strong support of a given locus
order does not allow for the prediction of the orientation of a set of markers
relative to the chromosomal endpoints.
In the comprehensive RH
12
000
map, several mostly minor discrepancies
to some of the other published maps are apparent (Fig. 1). In most cases
the orientation of groups of two or three markers are inverted relative to the
chromosomal endpoints.
Radiation hybrid map of BTA13 263
Our study has produced the most extensive marker map of BTA13 to date,
ordering 72 loci and covering 2694.7 cR
12
000
of the chromosome. The present
map is approximately four times larger than the BTA13 map produced by the
RH
5000
panel [18]. Inflation of the map length is likely due to the adding of
markers, since this phenomenon is also known in recombination based linkage
maps.
Looking at the RH
12
000
map in a comparative genetic context provides no
evidence for the existence of the postulated region homologous to HSA20
on BTA13, located centromeric to a confirmed HSA10 homologous region.
Independent ZOO-FISH experiments (e.g. [22]) had suggested such an HSA20
region, but both the RH
5000
map presented by Schläpfer et al. [18] and Band
et al. [3] failed to confirm these results. The present RH
12
000
map locates
the two ESTs BE217429 and AF213840/H12715 centromeric to IL2RA.A
sequence database search (BLASTN) [1], using the EST BE217249 and
AF213840/H12715 as query sequences identified human DNA sequences
(EMBL accession number AL161799 and AL390294) from clones assigned
to HSA 10 as the most likely homologues (data not shown). Considering
that the genes which were included in this present map are relatively evenly
distributed over both arms of HSA20, and the fact, that the ordering of six
newly assigned genes on BTA13 [21] has not identified the postulated HSA20
homologous segment, might point towards a reevaluation of the ZOO-FISH
findings. However, the postulated HSA20 homologous segment located close
to the centromere on BTA13, could represent an evolutionarily conserved block
of non-coding DNA.
The RH
5
000
map [18] has described five blocks of conserved gene order
between cattle and man. The results of the RH
12
000
mapping effort partially
support t his proposition. In its revised form, block 1 consists of the HSA10
homologues, IL2RA and VIM. All loci in the remaining four blocks are HSA20
homologues. Block 2 consists of THBD, PRNP, PRND, CHGB , SOD1L,
AVP/OXT and PDYN; block 3 contains GNAS1 and PCK1; and block 4 consists
solely of CSNK2A1. HCK, AHCY, ASIP, GHRH, PLC–II, PPGB and PLTP
make up block 5. As compared to the findings presented in the RH
5
000
map [18],
blocks 2 and 5 have been significantly extended. At the given marker density, no
subdivision of the conserved gene order in block 5 was identified. The situation
in block 2 is somewhat more complicated, since internal rearrangements led to
a division of the block into four subunits (block 2a-2d). Block 2 is of special
interest, since it contains PRNP, the microsatellite PRMS in intron 2 of PRNP,
as well as the PRNP-like gene PRND [13]. PDYN has not been included in
the latest HSA20 map [5], however the gene has been physically assigned to
20pter-p12.2 [11], which is located in the vicinity of AVP/OXT and CSNK2A1.
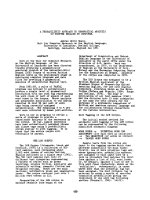
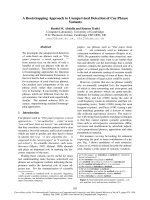
We assume PDYN to be located between AVP/OXT and CSNK2A1 (Fig. 3).
The comparison of HSA20 and BTA13 shows a rearranged order of the loci
264 J. Schläpfer et al.
BTA13 HSA10
centromere
IL2RA
q
14
VIM
q
16-
q
17
THBD
q
17
PRND
# PRNP
q
17-
q
21
# CHGB
SOD1L
q
21-
q
22
AVP/OXT q21-q22
PDYN
GNAS1
q
22
# PCK1
# CSNK2A1
# HCK
q
22
# AHCY
ASIP
¢ GHRH
¢ PLC-II
PPGB
PLTP
IL2RA
p
15-
p
14
VIM
p
13
centromere
HSA20
CSNK2A1 p13
*PDYN* pte
r
-
p
12
AVP/OXT
p
13
PRNP
p
te
r
-
p
12
PRND
CHGB
p
te
r
-
p
12
THBD
p
12-cen
centromere
HCK
q
11-
q
12
AHCY cen-q13.1
ASIP
q
11.2-
q
12
GHRH
q
11.2
PLCG1 q12-q13.1
PPGB
q
13.1
PLTP
q
12-
q
13.1
PCK1
q
13.2
GNAS1 13.2-q13.3
block 1
block 2 a
block 2 b
block 2 c
block 2 d
block 3
block 4
block 5
p-arm
block 1
block 4
block 2 d
p-ar
m
block 2 b
block 2 c
block 2 a
block 5
q-arm
block 3
Figure 3. Revised blocks of conserved gene order in cattle and man. The bovine
PLC-II gene is homologous to the human PLCG1 locus. No gene homologous to the
cattle SOD1L is known in man.
∗
indicates the assumed location of PDYN between
AVP/OXT and CSNK2A1 in man.
#
indicates framework markers. ¢ indicates markers
ordered with a lod score of at least 3 within the linkage groups. Where known, the
physical location in cattle [8,18] and man are indicated.
Radiation hybrid map of BTA13 265
PRND and PRNP (block 2b) and CHGB (block 2c), in cattle, relative to the
centromeric THBD (block 2a) and AVP/OXT (block 2d). In humans, no gene
homologous to bovine SOD1L has been identified. We therefore did not assign
the locus to a given block (Fig. 3). The linear locus order centromere – PRNP –
PRMS – CHGB has odds greater than 1000:1, since the three loci are framework
markers (Fig. 1). In contrast to this high level of support, the comprehensive
RH
12
000
position of PRND (lod score ≥ 0.0) in the locus order centromere –
PRNP – PRND – PRMS is questionable, since PRND has been found to be
located 16 kb downstream of PRNP in the mouse [13]. The microsatellite
PRMS however, is approximately 21
500 bp upstream of the PRNP coding
region. Given t he proposed internal rearrangement of block 2b and 2c in cattle
compared to man, the locus order centromere – PRND – PRNP – PRMS –
CHGB is most likely. However these are preliminary results that have to be
confirmed, for example by mapping of additional markers in the vicinity or by
fiber FISH experiments.
Despite these limitations, the present RH
12
000
map provides further insight
into the evolutionary development of BTA13 compared to HSA10 and HSA20.
The WG-RH
12
000
mapping panel has been shown to supplement the RH
5
000
panel in the development of marker maps featuring a higher resolution. The
finding within block 2 in cattle provides further evidence that, although syn-
teny between HSA10/HSA20 and BTA13 is conserved, gene order within
the homologous segments has been significantly altered by intrachromosomal
rearrangements.
ACKNOWLEDGEMENTS
We would like to thank Elaine Owens for her cell culture work, Jan Johnson
for the large-scale DNA extractions, Ursula Sattler and Brigitta Colomb for
their genotyping and Etienne Bäumle and Cyril Gaillard for the computer
support. This work was founded by the Swiss Federal Office for Education and
Research (BBW grant no. 97.0579-1) and the Swiss Federal Veterinary Office.
REFERENCES
[1] Altschul S.F., Madden T.L., Schäffer A.A., Zhang J., Zhang Z., Miller W.,
Lipman D.J., Gapped BLAST and PSI-BLAST: a new generation of protein
database search programs, Nucl. Acid. Res. 25 (1997) 3389–3402.
[2] Amarante M.R., Yang Y.P., Kata S.R., Lopez C.R., Womack J.E., RH maps of
bovine chromosomes 15 and 29: conservation human chromosomes 11 and 5,
Mamm. Genome 11 (2000) 364–368.
[3] Band M.R., Larson J.H., Rebeiz M., Green C.A., Heyen D.W., Donovan J.,
Windish R., Steining C., Mahyuddin P., Womack J.E., Lewin H.A., An ordered
comparative map of the cattle and human genomes, Genome Res. 10 (2000)
1359–1368.
266 J. Schläpfer et al.
[4] Barendse W., Vaiman D., Kemp S.J., Sugimoto Y., Armitage S.M., Williams
J.L., Sun H.S., Eggen A., Agaba M., Aleyasin S.A., Bishop M.D., Buitkamp J.,
Byrne K., Collins F., Cooper L., Coppettiers W., Denys B., Drinkwater R.D.,
Easterday K., Elduque C., Ennis S., Erhardt G., Ferretti L., Flavin N., Gao Q.,
Georges M., Gurung R., Harlizius B., Hawkins G., Hetzel J., Hirano T., Hulme
D., Jorgensen C., Kessler M., Kirkpatrick B.W., Konfortov B., Kostia S., Kuhn
C., Lenstra J.A., Leveziel H., Lewin H.A., Leyhe B., Lil L., Martin-Burriel I.,
McGraw R.A., Miller J.R., Moody D.E., Moore S.S., Nakane S., Nijman I.J.,
Olsaker I., Pomp D., Rando A., Ron M., Shalom A., Teale A.J., Thieven U.,
Urquhart B.D.G., Vage D I., Van de We ghe A., Varvio S., Velmala R., Vilkki
J., Weikard R., Woodside C., Womack J.E., Zanotti M., Zaragoza P., A medium-
density genetic linkage map of the bovine genome, Mamm. Genome 8 (1997)
21–28.
[5] Bentley D.R., Deloukas P., Dunham A., French L., Gregory S.G., Humphray
S.J., Mungall A.J., Ross M.T., Carter N.P., Dunham I., Scott C.E., Ashcroft K.J.,
Atidnson A.L., Aubin K., Beare D.M., Bethel G., Brady N., Brook J.C., Buriord
D.C., Burrill W.D., Burrows C., Butler A.P., Carder C., Cataneset J.J., Clee
C.M., Clegg S.M., Cobley V., Coffey A.J., Cole C.G., Collins J.E., Conquer J.S.,
Cooper R.A., Culley K.M., Dawson E., Dearden F.L., Durbin R.M., de Jongt P.J.,
Dhami P.D., Earthrowl M.E., Edwards C.A., Evans R.S., Gillson C.J., Ghori J.,
Green L., Gwilitam R., Halls K.S., Hammond S., Harper G.L., Heathcott R.W.,
Holden J.L., Holloway E., Hopkins B.L., Howard P.J., Howell G.R., Huckle E.J.,
Hughes J., Hunt P.J., Hunt S.E., Izmajlowicz M., Jones C.A., Joseph S.S., Laird
G., Langford C.F., Lehvaslaiho M.H., Leversha M.A., McCann O.T., McDonald
L.M., McDowall J., Maslen G.L., Mistry D., Moschonas N.K., Neocleous V.,
Pearson D.M., Phillips K.J., Porter K.M., Prathalingam S.R., Ramsey Y.H.,
Ranby S.A., Rice C.M., Rogers J., Rogers L.J., Sarafidou T., Scott D.J., Sharp
G.J., Shaw-Smith C.J., Smink L.J., Soderlund C., Sotheran E.C., Steingruber
H.E., Sulston J.E., Taylor A., Taylor R.G., Thorpe A.A., Tinsley E., Warry G.L.,
Whittaker A., Whittaker P., Williams S.H., Wilmer T.E., Wooster R., Wright
C.L., The physical maps for sequencing human chromosomes 1, 6, 9, 10, 13, 20
and X, Nature 409 (2001) 942–943.
[6] Boehnke M., Lange K., Cox C.R., Statistical methods for multipoint radiation
hybrid mapping, Am. J. Hum. Gen. 49 (1991) 1174–1188.
[7] Don R.H., Cox P.T., Wainwright B.J., Baker K., Mattick J.S., “Touchdown”PCR
to circumvent spurious priming during gene amplification, Nucl. Acid. Res. 19
(1991) 4008.
[8] Gallagher D.S., Schläpfer J., Burzlaff J.D., Womack J.E., Stelly D.M., Davis
S.K. Taylor J.F., Cytogenetic alignment of the bovine chromosome 134 genome
map by fluorescence in situ hybridization of human chromosome 10 and 20
comparative markers, Chromosome Res. 7 (1999) 115–119.
[9] Kappes S.M., Keele J.W., Stone R.T., McGraw R.A., Sonstegard T.S., Smith
T.P., Lopez-Corrales N.L., Beattie C.W., A second-generation linkage map of
the bovine genome, Genome Res. 7 (1997) 235–249.
[10] Lange K., Boehnke M., Cox D.R., Lunetta K.L., Statistical methods for polyploid
radiation hybrid mapping, Genome Res. 5 (1995) 136–150.
Radiation hybrid map of BTA13 267
[11] Litt M., Buroker N.E., Kondoleon S.K., Liston D., Douglass J., Sheehy R.,
Magenis R.E., Chromosomal localization of the human proenkephalin and pro-
dynorphin genes, Cytogenet. Cell Genet. 46 (1987) 651.
[12] Marini J.C., Nelson K.K., Battey J., Siracusa L.D., The pituitary hormones argin-
ine vasopressin-neurophysin II and oxytocin-neurophysin I show c lose linkage
with interleukin-1 on mouse chromosome 2, Genomics 15 (1993) 200–202.
[13] Moore R.C., Lee I.Y., Silverman G.L., Harrison P.M., Strome R., Heinrich
C., Karunaratne A., Pasternak S.H., Chishti M.A., Liang Y., Mastrangelo P.,
Wang K., Smith A.F., Katamine S., Carlson G.A., Cohen F.E., Prusiner S.B.,
Melton D.W., Tremblay P., Hood L.E., Westaway D., Ataxia in prion protein
(PrP)-deficient mice is associated with upregulation of the novel PrP-lik e protein
doppel, J. Mol. Biol. 292 (1999) 797–817.
[14] Rexroad C.E., Schläpfer J.S., Yang Y., Harlizius B., Womack J.E., A radiation
hybrid map of bovine chromosome one, Anim. Genet. 30 (1999) 325–332.
[15] Rexroad C.E. III, Owens E.K., Johnson J.S., Womack J.E., A 12’000 rad whole
genome radiation hybrid panel for high resolution mapping in cattle: charac-
terization of the centromeric end of chromosome 1, Anim. Genet. 31 (2000)
262–265.
[16] Ryan A.M., Womack J.E., Somatic cell mapping of the bovine prion protein gene
and restriction fragment length polymorphism studies in cattle and sheep, Anim.
Genet. 24 (1993) 23–26.
[17] Sausville E., Carney D., Battey J., The human vasopressin gene is linked to the
oxytocin gene and is selectively expressed in a cultured lung cancer cell line, J.
Biol. Chem. 260 (1985) 10236–10241.
[18] Schläpfer J., Yang Y., Rexroad C.E. III, Womack J.E., A radiation hybrid frame-
work map of bovine chromosome 13, Chromosome Res. 5 (1997) 511–519.
[19] Schläpfer J., Gallagher D.S. Jr., Burzlaff J.D., Womack J.E., Stelly D.M., Taylor
J.F., Davis S.K., Comparative mapping of bovine chromosome 13 by flourescence
in situ hybridization, Anim. Genet. 29 (1998) 265–272.
[20] Schläpfer J., Stahlberger-Saitbekova N., Küffer J., Dolf G., Genetic mapping
of the prion protein gene (PRNP) on bovine chromosome 13, J. Anim. Breed.
Genet. 117 (2000) 211–216
[21] Schläpfer J., Dolf G., Womack J.E., Stahlberger-Saitbekova N., Assignment of
six genes to bovine chromosome 13, J. Anim. Breed. Genet. 118 (2001) 189–196.
[22] Solinas-Toldo S., Lengauer C., Fries R., Comparative genome map of human
and cattle, Genomics 27 (1995) 489–496.
[23] Thomsen H., Reinsch N., Xu N., Looft C., Grupe S., Kühn C., Brockmann G.A.,
Schwerin M., Leyhe-Horn B., Hienleder S., Erhardt G., Medjugorac I., Russ I.,
Förster M., Brenig B., Reinhardt F., Reents R., Blümel J., Averdunk G., Kalm E.,
A male bovine linkage map for the ADR granddaughter design, J. Anim. Breed.
Genet. 117 (2000) 289–306.
[24] Walter M.A., Spillett D.J., Thomas P., Weissenbach J., Goodfellow P.N., A
method for constructing radiation hybrid maps of whole genomes, Nat. Genet. 7
(1994) 22–28.
[25] Womack J.E., Johnson J.S., Owens E.K., Rexroad C.E. III, Schläpfer J., Yang Y.,
A whole genome radiation hybrid panel for bovine genome mapping, Mamm.
Genome 8 (1997) 854–856.