Báo cáo sinh học: "Optimal design for the detection of a major gene segregation in crosses" potx
Bạn đang xem bản rút gọn của tài liệu. Xem và tải ngay bản đầy đủ của tài liệu tại đây (503.08 KB, 11 trang )
Original
article
Optimal
design
for
the
detection
of
a
major
gene
segregation
in
crosses
between
2
pure
lines
JM
Elsen
P
Le
Roy
1
Institut
national
de
la
recherche
agronomique,
station
d’amélioration
génétique
des
animaux,
BP!7,
31326
Castanet-Tolosan
cedex;
2
Institut
national
de
la
recherche
agronomique,
station
de
génétique
quantitative
et
appliquée,
78352
Jouy-en-Josas
cedex,
France
(Received
15
June
1994;
accepted
15
December
1994)
Summary -
A
simulation
method
was
used
to
compare
different
experimental
designs
for
their
power
to
detect
a
major
gene
using
a
maximum
likelihood
approach.
The
optimal
design
is
most
often
the
production
of
F2
as
the
only
segregating
genetic
type,
with
a
limited
effect
of
the
relative
numbers
of
F2s
and
non-segregating
groups
(parentals
and
F1)
on
the
power.
Dominant
genes
were
more
easily
detected
than
additive
ones.
A
model
dealing
with
the
heteroskedasticity
of
the
polygenic
component
was
also
studied.
major
gene
/
optimization
/
maximum
likelihood
/
homozygous
line
Résumé -
Protocoles
optimaux
pour
la
détection
d’un
gène
à
effet
majeur
en
ségrégation
dans
des
croisements
entre
2
lignées
pures.
Différents
protocoles
expéri-
mentaux
ont
été
comparés
par
simulation
sur
leur
puissance
pour
la
détection
d’un
gène
à
l’aide
d’un
test
du
maximum
de
vraisemblance.
Le
protocole
optimal
est
le
plus
souvent
celui
pour
lequel
le
seul
type
génétique
où
le
gène
est
en
ségrégation
est
la
F2,
avec
un
faible
effet
de
la
proportion
de
F2
par
rapport
aux
types
génétiques
sans
ségrégation
(parentaux
et
Fl).
Les
gènes
dominants
sont
détectés
plus
facilement
que
les
gènes
additifs.
Un
modèle
considérant
l’hétéroscédasticité
de la
composante
polygénique
est
aussi
étudié.
gène
majeur
/ optimisation
/ maximum
de
vraisemblance
/ lignée
homozygote
INTRODUCTION
The
genetic
maps
presently
under
development
will
soon
be
a
great
help
in
the
detection
of
quantitative
trait
loci.
Nevertheless,
as
stated
by
Gofhnet
et
al
(1994),
evidencing
major
gene
segregation
without
marker
information
will
remain
important
for
various
reasons:
i)
genetic
maps
may
not
be
available
for
all
species;
ii)
systematic
use
of
molecular
markers
is
very
costly;
iii)
statistical
analysis
of
phenotype
distributions
is
a
useful
preliminary
analysis
of
available
data;
and
iv)
retrospective
studies
of
old
experiments
without
marker
information
may
be
valuable.
The
basis
for
population
genetics
was
established
by
Mendel,
who
used
crosses
between
pure
lines
of
peas
to
observe
the
segregation
of
genes
controlling
the
colour
and
appearance
of
seeds
in
F2
and
backcrosses.
Since
that
time,
a
number
of
crosses
between
homozygous
lines
and
even
between
heterogeneous
subpopulations
have
been
conducted
in
plants
and
animals
as
tests
of
a
major
gene
segregation
between
these
lines
or
subpopulations
(the
parental
groups),
eg,
Hanset
(1991)
and
Boujenane
et
al
(1991).
The
subpopulations
may
often
be
considered
as
independent
samples
(eg,
Bradford
and
Famula,
1984;
Duchet-Suchaux
et
al,
1992;
Loisel
et
al,
1994).
The
underlying
hypothesis
is
usually
that
the
parental
groups
(PI
and
P2)
are
homozygous
in
opposite
states
(AA
and
BB)
at
a
particular
locus
governing
the
measured
trait.
Under
this
hypothesis,
the
first
cross
(Fl)
is
homogeneous
with
all
animals
AB;
the
F2s
(crosses
between
Fl
parents)
may
be
AA,
AB
or
BB
with
probabilities
of
1/4,
1/2
and
1/4
respectively;
the
backcrosses
(either
BC1,
crosses
between
Fl
and
PI,
or
BC2,
crosses
between
Fl
and
P2)
are
also
heterogeneous
AA
or
AB
animals
(BC1)
and
AB
or
BB
animals
(BC2)
with
proportions
1/2,
1/2.
The
statistical
analysis
of
the
data
obtained
from
these
populations
was
clearly
described
by
Elston
and
Stewart
(1973)
and
Stewart
and
Elston
(1973).
They
showed
how
a
maximum
likelihood
approach
could
be
used
to
test
various
genetic
hypotheses
differing
in
gene
numbers
and
types
(additive/dominant,
autosomal/sex-
linked).
Alternative
methods
were
described
by
Mode
and
Gasser
(1972)
and
Weber
(1959).
The
power
of
this
type
of
experiment
has
been
recently
investigated
by
Janss
and
Van
der
Werf
(1992),
limiting
their
study
to
the
case
of
F2
populations.
In
this
paper,
we
describe
a
study
of
the
optimal
structure
of
the
population
defined
by
the
relative
and
absolute
numbers
of
subgroups
(PI,
P2,
Fl, F2,
BC1
and
BC2).
Different
structures
were
compared
using
simulations
and
their
power
to
detect
a
major
gene
in
a
maximum
likelihood
approach
was
investigated.
Some
information
about
a
more
robust
model
is
also
provided.
The
use
of
simulations
for
the
evaluation
of
the
statistical
properties
of
the
likelihood
ratio
test
is
justified
by
the
non-observation
of
classical
asymptotic
distributions
in
the
particular
context
studied
(Goffinet
et
al,
1992;
Loisel
et
al,
1994).
METHODS
Model
Two
hypotheses
were
compared.
Ho
assumes
that
the
difference
between
the
parental
lines
PI
and
P2
is
due
to
a
large
number
of
genes,
each
with
a
small
effect
in
controlling
the
trait
measured,
and
Hl
assumes
that
beyond
this
polygenic
difference,
a
major
gene
is
fixed
at
opposite
homozygous
states
(AA
and
BB)
in
the
parental
lines.
Y2!
is
the
performance
of
the
jth
individual
of
the
ith
genetic
type.
Six
genetic
types
are
considered
(PI,
P2,
F1, F2,
BC1,
BC2)
with
i =
1
to
6
respectively.
The
number
of
individuals
in
the
ith
group
is
ni.
Under
Ho,
the
performance
xj
was
modeled
as:
where p
is
the
general
mean
and l
i
the
genetic
type
i effect
which
can
be
detailed
using
Dickerson’s
crossbreeding
parameters
(Dickerson,
1973).
In
this
study,
the
only
parameters
considered
were
the
direct
individual
additive
effects
(r
and
s
for
the
parental
populations
PI
and
P2
respectively)
and
the
direct
heterosis
effect
(h):
e
ij
is
the
residual
effect
which
is
normally
distributed
N(0,
<r!).
Under
Hl,
the
performance
l
oj
is
modeled
as:
y
ti
=
J1
-i- l
i
+
gk
+
e2!
with
probability
Pik
where
g,!
is
the
major
genotype
k
effect
(k
=
1
for
AA,
2
for
AB
and
3
for
BB)
and
pi
k
is
the
probability
of
the
kth
genotype
in
the
ith
genetic
type.
Under
the
preceding
fixed
alleles
hypothesis:
The
case
where
the
within-major-genotype
variance
varies
between
groups
may
be
studied
simply
by
replacing
u
with
c, 2
In
our
simulations,
this
has
been
explored
for
a
limited
range
of
population
structures.
Test statistic
.
The
hypothesis
Ho
was
tested
using
the
likelihood
ratio
test
£
=
-21n(L
o/
L1)
where:
It
must
be
emphasized
that,
in
this
model,
no
familial
relationships
are
considered
between
the
measured
individuals.
The
Ho
hypothesis
(no
major
gene
segregating
in
F2s
and/or
backcrosses)
was
rejected
if
the
test
statistic C
exceeded
a
threshold
A.
Due
to
non-observation
of
regulatory
conditions,
the
asymptotic
distribution
of G
under
Ho
is
probably
not
the
classical
x2
with
a
number
of
degrees
of
freedom
equal
to
the
difference
between
the
number
of
parameters
to
be
estimated
under
Hl
and
Ho
(Goffinet
et
al,
1992;
Jans
and
Van
der
Werf,
1992).
Moreover,
for
a
limited
number
of
individuals,
the
true
asymptotic
distribution
may
not
be
attained.
To
cope
with
these
difficulties,
empirical
rejection
thresholds
were
obtained
from
simulations.
Cases
studied
First,
the
power
was
evaluated
for
different
population
structures,
given
a
total
number
of
180
individuals
measured.
These
situations
are
given
in
table
I.
In
all
cases,
PI,
P2
and
Fl
were
in
equal
proportions.
In
the
Cl
cases,
the
backcrosses
were
not
produced
and
the
segregation
of
the
major
gene
was
visible
only
in
the
F2.
In
the
C2
cases,
the
F2
was
absent
and
the
2
backcrosses
were
present
in
equal
proportions.
The
C3,
C4
and
C5
cases
described
the
situations
where
both
F2
and
backcrosses
were
present.
The
proportion
t of
individuals
belonging
to
the
’segregating
groups’
increased
between
C10
and
C19,
C20
and
C26,
and
C3
and
C5.
The
proportion
of
F2s
to
backcrosses
increased
between
C30
and
C35,
C40
and
C44,
and
C50
and
C54.
The
major
gene
was
characterized
for
each
of
these
cases
by
an
effect
of
2
residual
standard
deviations
between
the
means
of
homozygotes,
either
additive
(g
l
=
0,
g2
=
1
and
g3
=
2,
ie,
a
= (g
3
-
gl
)12
=
1)
or
dominant
(
9i
= g2 =
0
and
g3
=
2,
ie
d
= g2 -
(9
1
+
9s)/2
= -1).
Secondly,
the
effects
of
the
whole
population
size
(E
i
ni
=
30
to
480
individuals)
and
of
the
major
gene
effect
(4
values
for
a
between
0.25
and
la
e,
and
d
=
0
or
- a)
were
evaluated
in
the
case
where
half
of
the
population
was
made
up
of
F2
individuals.
The
other
half
was
equally
divided
between
PI,
P2
and
Fl
individuals.
Finally,
considering
these
types
of
major
genes,
the
likelihood
was
modified
to
consider
the
case
where
the
within-group
variance
differs
between
the
F2
(a
2
and
the
non-segregating
subpopulations
(a2N
).
Simulations
were
performed
F2) and
the
non-segregating
subpopulations
!).
Simulations
were
performed
considering
!FZ
=
1
and
aN
S
=
!FZ,
cr!/1.25
or
crj!/1.5,
for
the
structures
C10
to
C19
and
their
equivalent
with
the
total
number
of
measured
individuals
doubled.
Numerical
techniques
The
results
were
obtained
from
simulations.
Appropriate
subroutines
from
the
NAG
library
were
used
for
the
generation
of
genotypes
and
normal
values
(G05CCF,
G05DDF,
G05CAF).
The
maximization
of
the
likelihood
was
performed
using
a
quasi-Newton
algorithm
(E04JBF
from
the
NAG
Library).
Only
1
starting
point
was
tested
for
each
maximization.
The
rejection
thresholds
under
Ho
were
estimated
from
the
10%
empirical
quantiles
of
the
test
statistic
distribution,
for
each
population
structure
studied,
defined
by
the
group
sizes
ni.
The
power
at
the
10%
level
was
simply
estimated
for
each
case
studied
by
taking
the
number
of
test
statistic
values
that
exceeded
the
corresponding
Ho
quantile.
Two
thousand
simulations
were
performed
in
each
of
the
Ho
and
Hl
cases.
RESULTS
AND
DISCUSSION
Optimal
structure
under
the
homoskedastic
model
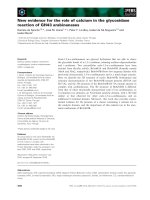
Figure
1
gives
the
power
of
situations
Cl
and
C2
as
a
function
of
the
ratio
t of
the
segregating
population
(F2
or
the
2
backcrosses)
size
to
the
total
population
size.
Whereas
the
2
types
of
designs
(F2
or
BC
alone)
give
a
similar
power
for
a
dominant
gene,
the
F2
must
be
used
in
the
case
of
an
additive
gene,
with
a
power
varying
between
60
and
70%
against
30
to
40%
for
the
backcross.
In
the
Cl
situations
the
maximum
power
is
always
reached
for
an
equal
proportion
of
segregating
(n
4
=
90)
and
non-segregating
populations
(n
l
= n
2
=
n3
=
30),
ie
with
a
t ratio
of
1/2.
In
contrast,
in
the
C2
situations,
this
optimal
proportion
seems
to
differ
according
to
whether
a
dominant
(where
the
optimum
is
about
3
times
more
in
backcross
individuals
than
in
non-segregating
individuals)
or
an
additive
gene
(the
maximum
power
being
attained
with
the
minimum
number
of
backcross
individuals
studied)
is
considered.
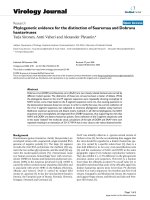
Figure
2
describes
the
case
where
the
F2
and
backcross
groups
were
both
produced
(C3,
C4
and
C5).
The
power
is
given
as
a
function
of
the
ratio
u
of
the
number
of
F2s
to
the
number
of
F2
+
backcross
individuals,
for
the
3
situations
considered
with
respect
to
the
t parameter:
1/2
(C3
cases,
nl
=
n2
=
n3
=
30),
2/3
(C4
cases,
nl
=
n2
=
n3
=
20)
and
5/6
(C5
cases,
nl
=
n2
=
n3
=
10).
The
power
appeared
to
be
very
insensitive
to
the
ratio
u
for
a
dominant
gene
and
when
considering
an
additive
gene
with
a
small
number
of
parental
individuals
(t
=
5/6).
In
situations
with
an
additive
gene
with
a
larger
proportion
of
parental
individuals
(t
=
1/2
or
2/3),
the
maximum
power
was
attained
by
maximising
the
proportion
of
F2s.
Evidence
for
a
major
gene
comes
from
the
detection
of
a
mixture
of
subdistribu-
tions
within
the
global
distribution of
either
F2
and/or
backcrosses.
In
principle,
the
test
statistic
used
(the
likelihood
ratio
test)
makes
use
of
the
whole
non-normality
of
the
global
distribution.
This
non-normality
is
greater
when
the
means
of
the
subdistributions
are
more
extreme.
This
phenomenon
probably
explains
the
lack
of
power
of
the backcross
cases
as
compared
to
the
F2
cases
when
an
additive
gene
was
studied.
In
this
situation,
the
difference
between
distribution
components
means
of
the
global
F2
distribution
was
twice
as
a
high
as
the
difference
in
either
the
BC1
or
the
BC2.
When
a
hypothesis
can
be
made
about
the
type
of
dominance,
before
the
experiment
is
designed,
then
maximum
power
will
be
attained
by
limiting
the
segregating
subpopulation
to
the
single
backcross
showing
segregation.
However,
the
power
of
such
a
design
will
be
zero
if
the
true
dominance
is
in
the
opposite
direction.
Table
II
compares
the
power
of
this
design
with
the
power
of
an
F2
when
a
total
of
180
individuals
were
measured,
half
of
which
were
in
the
non-segregating
(PI,
P2
and
Fl)
populations.
All
these
results
may
also
be
directly
related
to
the
proportion
of
the
variance
of
the
trait
due
to
the
major
gene
in
the
segregating
groups
(table
III);
this
proportion
increases
with
the
differences
between
subdistributions
means.
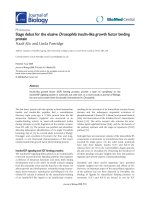
Size
of the
design
The
minimum
number
of
individuals
to
be
measured
in
order
to
have
a
90%
power
for
the
detection
of
a
gene
effect
a
=
1
standard
deviation
is
150
when
considering
a
dominant
gene
(d
=
-a)
and
about
500
when
considering
an
additive
gene
(d
=
0)
(fig
3).
Larger
populations
are
required
for
smaller
gene
effects.
The
changes
in
curve
shape
with
the
gene
effect
a
must
be
emphasized.
These
curves
are
nearly
linear
for
power
under
70%
and,
in
this
linear
part,
the
slope
(ie
the
gain
in
power
per
extra
individual
measured)
increases
with
a.
The
resulting
increase
in
size
of
the
design
required
for
a
70%
power
does
not
appear
to
be
linear
in
1/a.
Janss
and
Van
der
Werf
(1992)
considered
a
1
standard
deviation
additive
gene
effect
(a
=
1)
and
a
5%
significance
level
and
found
a
12%
power
when
only F2
individuals
were
measured
(1000
individuals)
but
a
100%
power
when
500
Fls
were
added
to
these
1000
F2s.
From
our
simulations,
the
further
inclusion
of
parental
P1
l
and
P2
performances
in
the
analyses
appears
to
be
extremely
useful.
We
confirmed
these
results
at
the
10%
level
with
some
simulations
performed
with
F2
individuals
only.
The
power
of
detecting
an
additive
2
standard
deviations
gene
with
1 000
F2s
reached
only
24%,
a
value
attained
with
only
30
individuals
when
the
parental
subgroups
were
included.
’
Robustness
to
heteroskedasticity
Janss
and
Van
der
Werf
(1992)
argued
that
the
inclusion
of
Fl
data
decreases
the
robustness
of
the
analysis,
a
false
major
gene
being
easily
detected
when,
the
F2
group
variance
is
higher
than
in
the
F1
population
(100%
false
detection
with
a
50%
variance
increase).
As
described
above,
this
heteroskedasticity
can
be
included
in
the
model
without
difficulty.
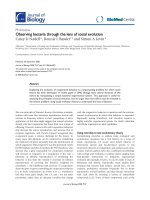
Figure
4
shows
the
power
of
such
a
heteroskedastic
model
for
various
population
sizes,
when
the
performances
are
simulated
with
a!2
=
2
Additive
and
dominant
genes
of
a
1 standard
deviation
effect
were
considered.
The
results
obtained
with
a!2
=
1.25o
NS
and
a!2
=
OrNs 2
were
very
similar.
The
detection
power
for
additive
genes
was
low
and
nearly
independent
of
the
population
size
and
structure.
In
contrast,
in
the
case
of
a
dominant
gene,
the
power
increased
strongly
with
population
size
and
reached
its
maximum
when
all
individuals
belonged
to
the
F2
population,
which
is
the
opposite
of
the
homoskedastic
case
where
the
non-
segregating
populations
were
useful.
This
result
shows
that
the
information
in
the
non-segregating
population
derives
from
the
level
of
the
within-group
variance.
This
variance
for
the
F2
can
be
estimated
in
the
parental
and
Fl
groups
in
the
homoskedastic
model,
but
not
in
the
heteroskedastic
model.
In
the
latter,
the
major
gene
segregation
was
only
tested
through
the
non-normality
of
the
F2
group,
while
in
the
previous
model
the
increase
of
variance
between
Fl
and
F2
also
contributed
to
this
testing.
CONCLUSION
In
general,
the
generation
of
backcrosses
does
not
compete
with
the
production
of
F2s
alone
as
a
segregating
population.
This
is
particularly
true
for
an
additive
gene.
The
power
of
the
detection
test
seems
to
be
poorly
sensitive
to
the
proportion
of
F2s
in
the
whole
population.
The
optimum
appears
to
be
50%
of
F2s
with
equal
proportions
of
PI,
P2
and
F1.
Large
dominant
genes
are
easily
detected
in
such
small
populations
(fewer
than
200
individuals
for
a
2
standard
deviations
gene
effect).
Additive
genes
are
less
easily
detected.
These
results
were
obtained
by
comparing
mixed
with
polygenic
inheritance
in
the
homoskedastic
case.
To
prevent
a
lack
of
robustness
due
to
heteroskedasticity,
a
model
including
variance
differences
between
F2s
and
parental
populations
may
be
used.
In
this
case,
the
major
gene
is
detected
through
the
non-normality
of
the
F2,
with
a
loss
of
power.
Another
extreme
situation
may
be
found
if
the
differences
between
genetic
types
are
due
only
to
the
segregation
at
the
major
locus.
Comparing
this
monogenic
hypothesis
to
the
polygenic
one
causes
difficulty
since
these
hypotheses
are
not
nested.
This
may
be
solved
simulating
empirical
quantiles
as
done
in
this
study
or
using
the
Akaike
(1973)
criteria.
REFERENCES
Akaike
H
(1973)
Information
theory
and
an
extension
of
ML
principle.
In:
2nd
Interna-
tional
Symposium
on
Information
theory
(BN
Petrov,
F
Csahi,
eds),
Ak
Kiado,
Bu-
dapest,
Hungary,
267-281
Boujenane
I,
Bradford
GE,
Famula
TR
(1991)
Inheritance
of
litter
size
and
its
components
in
crosses
between
D’Man
and
Sardi
breeds
of
sheep.
J
Anim
Sci
69,
517-524
Bradford
GE,
Famula
TR
(1984)
Evidence
for
a
major
gene
for
rapid
postweaning
growth
in
mice.
Genet
Res
Camb
44,
293-308
Dickerson
GE
(1973)
Inbreeding
and
heterosis
in
animals.
In:
Proc
Anim
Breeding
Genet
Sym
P
in
honour
of
Dr
JL
Lush,
Am
Soc
Anim
Sci
Assoc,
Champaign,
IL,
USA,
54-77
Duchet-Suchaux
M,
Menanteau
P,
Le
Roux
H,
Elsen
JM,
Lechopier
P
(1992)
Genetic
control
of
resistance
to
enterotoxigenic
Escherichia
coli
in
infant
mice.
Microbiol
Pathogenesis
13,
157-160
Elston
RC,
Stewart
J
(1973)
The
analysis
of
quantitative
traits
for
simple
models
from
parental,
Fl
and
backcross
data.
Genetics
73,
695-711
Goffinet
B,
Loisel
P,
Laurent
B
(1992)
Testing
in
normal
mixture
models
when
the
proportions
are
known.
Biometrika
79,
842-846
Goffinet
B,
Bekmann
J,
Boichard
D
et
al
(1994)
M6thodes
math6matiques
pour
1’etude
des
genes
contr6lant
des
caract6res
quantitatifs.
Genet
Sel
Evol
26,
9s-20s
Hanset
R
(1991)
The
major
gene
of
muscular
hypertrophy
in
the
Belgium
Blue
cattle
breed.
In:
Breeding
for
Disease
Resistance
in
the
Farm
Animal
(JB
Owen,
RFE
Axford,
Wallingford,
eds),
CAB
International,
UK,
467-478
Janss
LLG,
Van
der
Werf
JHJ
(1992)
Identification
of
a
major
gene
in
Fl
and
F2
data
when
alleles
are
fixed
in
the
parental
lines.
Genet
Sel
Evol 24,
511-526
Loisel
P,
Goffinet
B,
Monod
H,
Montes
de
Oca
G
(1994)
Detecting
a
major
gene
in
an
F2
population.
Biometrics
50,
512-516
Mode
CJ,
Gasser
DL
(1972)
A
distribution
free
test
for
major
gene
differences
in
quantitative
inheritance.
Math
Biosci
14,
143-150
Stewart
J,
Elston
RC
(1973)
Biometrical
genetics
with
1
or
2
loci:
the
inheritance
of
physiological
characters
in
mice.
Genetics
73,
675-693
Weber
E
(1959)
The
genetical
analysis
of
characters
with
continuous
variability
on
a
mendelian
basis.
I.
Monohybrid
segregation.
Genetics
44,
1131-1139