Báo cáo sinh học: "Comparative study of growth in poultry" ppt
Bạn đang xem bản rút gọn của tài liệu. Xem và tải ngay bản đầy đủ của tài liệu tại đây (570.37 KB, 11 trang )
Original
article
Comparative
study
of
growth
curves
in
poultry
H
Kní&jadnr;etová,
J
Hyánek
L
Hyánková,
P
B&jadnr;li&jadnr;ek
Research
Institute
of Animal
Production,
104
00
Prague
10-UhNneves,
Czech
Republic
(Received
26
April
1993;
accepted
6
February
1995)
Summary -
This
paper
compares
the
growth
patterns
of
chickens,
turkeys,
ducks
and
geese.
The
growth
curves
and
their
parameters
were
estimated
by
the
Richards
function.
In
this
work,
weight
data
of females
of current
sire
lines
(62
chickens,
47
ducks
and
42
geese)
and
commercial
medium-type
hybrids
(27
turkeys)
were
used.
Birds
were
fed
ad
libitum
and
weighed
at
7
or
14
d
intervals
up
to
18-28
weeks
of
age.
The
accuracy
of
the
curve
fit
was
high
in
all
species
(R
2
=
0.9840
to
0.9994).
The
ratios
y+
/A
(weight
at
the
inflection
point
over
mature
weight),
which
determine
the
shape
of
the
growth
curve,
were
0.370,
0.358,
0.407
and
0.261
in
chickens,
turkeys,
ducks
and
geese,
respectively.
Only
the
growth
pattern
of
the
Galliforms
did
not
significantly
differ
from
the
Gompertz
type
of
growth
(y
+
/A
=
0.368).
The
age
at
the
inflection
point
confirmed
the
high
early
growth
of
geese
(t
+
=
21.1
d)
and
ducks
(t
+
=
25.5
d).
The
chickens
finished
the
autoacceleration
phase
of
growth
at
47.7
d
and
turkeys
at
74.0
d
of
age.
The
phenotypic
correlations
between
the
inflection
parameters
t+
and
y+
were
higher
in
waterfowl
than
in
chickens
and
turkeys.
The
inflection
parameter
t+
and
y+
were
positively
associated
with
the
maturing
index
k
in
ducks
and
geese,
and
negatively
in
chickens
and
turkeys.
The
evolutionary
aspects
of
the
interspecific
differences
are
discussed.
growth
curve
/
turkey
/
waterfowl
/
chicken
/
evolution
Résumé -
Étude
comparative
des
courbes
de
croissance
de
volaille.
L’article
compare
les
patrons
de
croissance
du
poulet,
de
la
dinde,
du
canard
et
de
l’oie.
Les
courbes
de
croissance
et
leurs
paramètres
ont
été
estimés
selon
l’équation
de
Richards.
L’analyse
a
porté
sur
les
poids
de
femelles
de
lignées
paternelles
courantes
(62
poulets,
47
canards
et
42
oies)
et
de
27
dindes
(hybrides
commerciaux
de
type
moyen).
Les
oiseaux
ont
été
nourris
ad
libitum
et
pesés
régulièrement
jusqu’à
l’âge
de
18
à
28
sem.
La
précision
de
l’ajustement
des
courbes
est
élevée
pour
les
!!
espèces
(R
2
=
0,9840
à
0,9994).
Le
rapport
y+
/A
(poids
au
point
d’inflexion
sur
poids
adulte)
qui
définit
la
forme
de
la
courbe
de
croissance
est
de
0,370,
0,358,
0,407
et
0,261
pour
le
poulet,
la
dinde,
le
canard
et
l’oie
respectivement.
Seul
le
patron
de
croissance
des
Galliformes
ne
diffère
pas
significativement
de
la
fonction
de
Gompertz
(y
+
/A
=
0, 368).
L’âge
au
point
d’inflexion
confirme
la
précocité
de
croissance
de
l’oie
(t
+
=
21, 1 j)
et
du
canard
(t
+
=
25,
5 j).
La
période
d’auto-accélération
de
la
croissance
dure
47,7 j
chez
le
poulet
et
74 j
chez
la
dinde.
Les
corrélations
phénotypiques
entre
les
paramètres
d’inflexion
t+
et
y+
sont
plus
élevées
chez
le
canard
et
l’oie
que
chez
le
poulet
et
la
dinde.
Les
liaisons
entre
les
paramètres
d’inflexion
t+
et
y+
et
l’index
de
maturation
k
sont
positives
chez
le
canard
et
l’oie
et
négatives
chez
le
poulet
et
la
dinde.
Les
aspects
évolutifs
des
différences
interspécifiques
sont
discutés
dans
l’article.
courbe
de
croissance
/
dinde
/
palmipède
/
poule
/
évolution
INTRODUCTION
Variation
in
growth
curves
of
different
species
of
domestic
birds
is
predominantly
related
to
the
evolutionary
differences
between
the
wild
ancestors
of
these
species.
The
shape
of
the
growth
curve
results
from
the
growth
rate
and
its
changes
during
ontogenesis.
Some
comparisons
of
growth,
fat
deposition
and
efficiency
of
meat
production
in
domestic
birds,
ie
chickens
and
turkeys
( Galliforms),
ducks
and
geese
(Anseriforms),
have
been
presented
by
Nixey
(1986)
and
Shalev
and
Pasternak
(1989).
Further
comparative
analyses
of
the
growth
patterns
in
poultry
were
carried
out
by
Salomon
et
al
(1988,
1990)
and
Anthony
et
al
(1991).
The
purpose
of
this
study
was
to
compare
the
parameters
of
growth
curves
in
chickens,
turkeys,
ducks
and
geese
obtained
using
the
Richards
function,
and
to
give
some
interpretation
to
these
differences
which
arose
between
species
during
evolution
and,
more
recently,
through
artificial
selection.
MATERIALS
AND
METHODS
Comparisons
involved
4
independent
data
sets
of
female
birds.
The
chicken,
duck
and
goose
data
were
previously
described
by
Knizetova
et
al
(1991a,b,
1994).
While
most
of
the
analyzed
species
of
meat-type
domestic
birds,
the
chicken
(Gallus
gallus
domesticus),
the
duck
(Anas
platyrhynchos)
and
the
goose
(Anser
anser),
were
represented
by
females
of
the
sire
line,
only
medium-size
commercial
hybrid
females
were
used
for
the
turkey
(Meleagris
gallopavo)
data
sets.
The
chicken
line
was
developed
from
White
Cornish
and
White
Plymouth
Rock,
the
synthetic
strain
of
geese
was
descended
from
the
Bohemian
and
Italian
White
geese,
and
Pekin
ducks
were
of
Czech
origin.
The
weight
data
from
178
birds
(62
chickens,
27
turkeys,
47
ducks
and
42
geese)
were
used
for
the
analysis.
All
birds
were
reared
on
litter
floor
pens
with
an
additional
outdoor
watering
area
for
ducks
and
geese.
Both
food
and
water
were
available
ad
libitum.
The
starter
diet
for
the
chickens
during
the
first
3
weeks
contained
209
g
protein
and
11.7
MJ
ME/kg,
and
the
grower
diet,
fed
up
to
26
weeks,
contained 189
g
protein
and
11.3
MJ
ME/kg.
The
diet
for
the
turkeys
during
the
first
4
weeks
contained
280
g
protein
and
11.3
MJ
ME/kg;
grower
diet
1
contained
234
g
protein
and
11.6
MJ
ME/kg
(up
to
8
weeks
of
age)
and
grower
diet
2
contained
180
g
protein
and
11.6
MJ
ME/kg
(up
to
12
weeks
of
age).
During
the
final
phase
of
growth,
the
turkeys
were
fed
on
a
diet
with
158
g
protein
and
12.0
MJ
ME/kg.
The
ducks
were
fed
on
a
starter
diet
containing
176
g
protein
and
11.4
MJ
ME/kg
from
hatching
to
3
weeks
of
age,
followed
by
a
grower
diet
with
148
g
protein
and
11.4
MJ
ME/kg
to
10
weeks
of
age
and
a
diet
for
mature
ducks
with
133
g
protein
and
11.4
MJ
ME/kg
during
the
final
growth
phase.
The
composition
of
these
diets
for
the
geese
was
241
g
protein
and
11.3
MJ
ME/kg,
179
g
protein
and
11.3
MJ
ME/kg
and
102
g
protein
and
11.1
MJ
ME/kg,
respectively.
Birds
were
weighed
at
7
or
14
d
intervals
up
to
18-28
weeks
of
age
according
to
species
and
growth
period,
with
the
exception
of
the
geese,
which
were
weighed
at
longer
intervals
during
the
final
growth
period.
The
individual
growth
curves
of
chickens,
turkeys,
ducks
and
geese
were
based
on
14, 19,
15
and
13
weight-age
data.
The
body
weight y
t
of
each
individual
during
postnatal
growth
was
described
by
the
4-parameter
Richards
function
(Richards,
1959):
for n > -1, n i=- 0, A and k > O.
The
biological
interpretation
of
the
parameters,
estimated
using
generalised
least
squares
methods,
is
as
follows:
A
=
asymptotic
value
of
size
as
t -
oo,
generally
interpreted
as
average
size
at
maturity,
b
=
integration
constant,
time
scale
parameter,
k
=
ratio
of
the
relative
intensity
of
growth
of
transformed
variable
0
(=
yn)
and
degree
of
maturity
expressed
as
1- (() / An);
this
ratio
estimates
the
maturation
rate
of
the
curve
(ie
the
relative
rate
at
which
A
is
reached),
n
=
shape
parameter
determining
the
position
of
the
inflection
point
of
the
curve
(in
the
original
Richards
function
it
was
designated
as
m
(m
=
n
+
1)
and
by
other
authors
as
M
(M
= -1/n));
it
established
the
degree
of
maturity
in
body
weight
at
the
point
of
inflection.
Weight
(y
+)
and
age
(t
+)
at
the
inflection
point
were
calculated
from
the
parameters
of
the
curve:
Further
parameters
included
the
average
absolute
growth
rate
v
(g/d)
and
maximal
growth
rate
v+
(g/d
at
inflection
point):
The
degree
of
maturity
was
also
characterised
by
ut
(Taylor
and
Fitzhugh,
1971):
The
coefficient
of
determination
(R
2)
characterised
the
fit
of
the
curve
to
the
observed
pattern
of
growth.
The
null
hypothesis
(n
-
0,
y+
/A
=
0.368,
the
value
corresponding
to
the
Gompertz
function)
and
the
differences
between
species
were
tested
by
the
t-test.
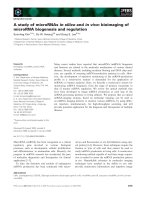
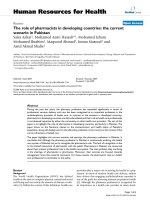
RESULTS
The
observed
and
theoretical
live
weights
of
female
chickens,
turkeys,
ducks
and
geese
are
presented
in
table
I,
and
their
growth
curves
in
figure
1.
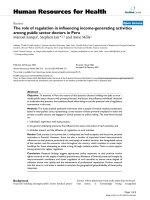
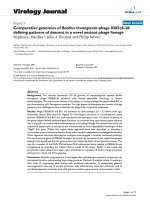
The
interspecific
differences
in
the
degree
of
maturity
in
terms
of
live
weight
are
illustrated
in
figure
2.
The
increase
in
weight
of
ducks
and
geese
was
very
rapid
early
in
life,
and
then
it
declined
quickly
in
ducks.
The
growth
of
geese
continued
at
later
ages.
On
the
other
hand,
turkeys
and
chickens
increased
in
weight
more slowly
during
the
first
few
weeks,
but
they
sustained
weight
gain
for
a
longer
period.
The
waterfowl
were
noticeably
heavier
than
the
gallids
during
the
first
10
weeks
of
life.
Conspicuous
interspecific
differences
were
also
obtained
for
the
ratio
of
mature
weight
to
hatching
weight.
This
ratio
was
59,
70,
114
and
163
in
geese,
ducks,
chickens
and
turkeys,
respectively.
The
high
coefficients
of
determination
(R
2
=
0.9840-0.9994)
indicate
the
Richards
function
was
well
suited
to
all
4
species
(table
I).
In
chickens,
the
the-
oretical
weights
were
underestimated
between
the
ages
of
22
and
26
weeks,
and
overestimated
in
the
middle
of
the
growth
period
(16-18
weeks).
In
turkeys,
the
differences
between
predicted
and
observed
weights
tended
to
alternate
in
sign
at
short
intervals.
The
parameters
of
the
Richards
function
are
shown
in
table
II.
The
shape
of
the
growth
curve
determined
by
the
inflection
point
position
in
terms
of
weight
(ie
ratio
y+
/A)
in
chickens,
turkeys,
ducks
and
geese
was
0.370,
0.358,
0.407
and
0.261,
respectively.
This
ratio
was
not
significantly
different
from
the
value
(0.368)
expected
under
the
Gompertz
type
of
growth
in
chickens
and
turkeys.
Although
the
growth
rate
during
the
first
weeks
of
postnatal
life
is
similar
in
ducks
and
geese,
both
species
are
conspicuously
different
in
the
shape
of
the
growth
curve.
The
growth
pattern
of
ducks
is
characterised
by
a
high
sigmoid
curving.
On
the
other
hand,
the
point
of
inflection
for
the
geese
was
at
the
beginning
of
growth.
This
growth
pattern
seems
to
be
determined
by
the
rapid
onset
of
growth
during
the
first
week
after
hatching
(table
I),
as
well
as
by
a
relatively
long
duration
of
linear
growth
(fig
1)
followed
by
a
slow
decrease.
The
position
of
the
inflection
point
in
terms
of
age
confirmed
the
earliness
of
growth
in
geese
(t
+
=
21.1
d)
and
ducks
(t
+
=
25.5
d).
The
chickens
finished
the
autoacceleration
phase
of
growth
at
47.7
d
and
turkeys
at
74.0
d
of
age.
The
k
parameter
is
largely
determined
by
the
value
of
the
shape
parameter
n
(rp
between n
and
k
was
0.88-0.92).
Since
k
depends
on
dy/dt
(the
instantaneous
absolute
growth
rate),
A,
y+
and
t+,
it
expresses
the
amount
of
growth
rate
as
well
as
the
rate
of
its
change.
The
lowest
value
of
k was
found
in
turkeys
and
the
highest
value
in
ducks.
The
similar
value
of
k
for
chickens
and
geese
was
associated
with
different
maturing
rates
(fig
2).
In
geese,
the
low
value
of
k
was
determined
by
the
position
of
the
inflection
point
at
the
beginning
of
the
linear
growth
phase.
The
parameter
A
(the
asymptotic
weight)
approximated
mature
weight
very
closely
in
the
waterfowl.
In
chickens,
A
was
lower
than
the
observed
live
weight
at
the
age
of
26
weeks.
The
asymptotic
weight
of
turkeys
seemed
to
be
overestimated
(tables
I
and
II).
The
body
weight
at
the
inflection
point
(y
+)
was
substantially
lower
in
the
waterfowl
than
in
the
gallids.
On
the
other
hand,
the
growth
curve
parameters,
the
definition
of
which
includes
both
absolute
values
of
body
weight
the
earliness
of
growth,
as
for
v
and
v+,
had
higher
values
in
ducks
and
geese
than
in
chickens
and
turkeys.
The
interspecific
differences
may
also
be
documented
by
differential
relationships
between
parameters
of
the
Richards
function
(table
III).
In
the
waterfowl,
the
correlation
coefficients
between
k
and
the
inflection
parameters
(y
+
and
t+)
were
positive,
while
in
the
gallids
they
were
negative.
The
differences
were
statistically
significant.
Likewise,
the
relationship
between
A
and
y+
was
significantly
stronger
in
species
with
a
longer
autoacceleration
growth
phase
(chickens,
turkeys),
while
the
correlation
coefficients
between
the
parameters
of
the
inflection
point,
ie
t+
and
y+,
were
generally
higher
in
ducks
and
geese.
DISCUSSION
Growth
pattern
The
growth
patterns
of
chickens,
turkeys,
ducks
and
geese
follow
the
sigmoid
curve
described
by
Brody
(1945).
However,
there
are
large
species-specific
differences.
results
on
the
comparative
analysis
of
growth
curves
of
these
species
confirmed
the
earliness
of
growth
in
Anseriforms
(geese,
ducks)
and
the
late
maturing
in
Galliforms
(chickens,
turkeys)
(Nixey,
1986;
Salomon
et
al,
1988;
Shalev
and
Pasternak,
1989).
This
conclusion
is
also
compatible
with
findings
of
Bj6rnhag
(1979)
who
reported
that
geese
had
the
highest
growth
rate
factor
(1.73),
which
may
be
taken
as
a
measure
of
growth
rate
when
the
difference
of
birth
weight
between
species
is
eliminated.
This
implies
that
geese
grow
about
1.7
times
faster
than
most
other
birds.
The
corresponding
values
for
ducks,
chickens
and
turkeys
were
0.89,
0.57
and
0.47,
respectively.
According
to
the
author,
there
is
reason
to
believe
that
growth
capacity
for
ducks
is
higher
than
the
calculated
growth
rate
factor.
In
a
comparative
study
of
chickens,
ducks
and
turkeys,
Shalev
and
Pasternak
(1989)
found
that
ducks
had
the
highest
and
turkeys
the
lowest
initial
specific
growth
rate
and
rate
of
exponential
decay
of
this
growth
rate
(the
Gompertz
function).
By
using
the
Janoschek
functions.
Salomon
et
al
(1988,
1990)
found
analogous
results
with
0.352, 0.394,
0.414
and
0.303
(y
+
/A)
and
52.3, 74.4,
27.6
and
24.3
d
(t
+)
for
chickens,
turkeys,
ducks
and
geese,
respectively.
The
most
extreme
interspecific
differences
in
the
shape
of
the
growth
curves
have
been
found
between
geese
and
ducks.
The
geese
are
characterised
by
the
lowest
ratio
of
the
inflection
and
asymptotic
weights
(0.261).
This
value
is
nearest
to
that
for
the
Bertalanffy
function
(0.296),
although
higher
values
(0.333)
have
been
obtained
for
commercial
hybrids
(unpublished
data).
In
contrast,
the
values
of
y+
/A
in
the
different
lines
of
Pekin
ducks
ranged
from
0.386
to
0.424
(Knizetova
et
al,
1991b).
Generally,
a
higher
genetic
heterogeneity
in
both
gallinaceous
species
is
due
to
the
long-term
intensive
selection
for
different
objectives
during
domestication.
Examining
4
breeds
(White
Cornish,
New
Hampshire,
White
Leghorn
and
Orping-
ton),
3
highly
inbred
lines
of
White
Leghorn,
and
9
broiler
lines,
we
found
the
ratio
y+
/A
to
range
in
value
from
0.332
to
0.392
(Knizetova
et
al,
1983,
1985,
1991a).
In
turkeys,
3
size
categories
(small,
medium
and
heavy)
have
been
selected,
which
will
probably
affect
the
shape
of
the
growth
curve.
The
medium
type
of
turkeys
was
used
in
both
studies,
but
overestimating
A
in
our
work
(caused
probably
by
the
high
weight
gain
between
27th
and
28th
weeks
of
age)
accounts
for
a
lower
value
of
!+/A
than
that
of
Salomon.
Nevertheless,
the
overall
similarity
between
the
growth
patterns
of
chickens
and
turkeys
found
in
this
work
could
be
expected
as
their
wild
ancestors
had
a
similar
mode
of
life.
Evolution
The
birds
living
in
areas
where
food
supply
changes
dramatically
with
the
seasons,
therefore
causing
them
to
migrate
at
an
early
age,
may
be
expected
to
have
a
higher
growth
rate
than
those
living
in
areas
with
a
more
permanent
food
supply
(Bj6rnhag,
1979).
Indeed,
geese
represent
a
northern
migrating
genus
adapted
to
shorter
summers,
whereas
the
gallids
are
mostly
resident
species.
On
the
other
hand,
the
fast
growth
of
ducks
immediately
after
hatching
might
be
associated
with
semiaquatic
habitats
of
their
wild
ancestors.
Wild
ducks
seek
food
on
water.
Consequently,
natural
selection
might
confer
some
advantage
to
birds
with
rapid
fat
accumulation.
Since
the
body
fat
in
the
waterfowl
is
also
an
insulating
tissue
to
preserve
body
heat.
Differences
in
the
growth
pattern
were
also
found
between
the
altricial
and
pre-
cocious
species.
Early
parental
dependence
in
altricial
birds
is
generally
accompa-
nied
by
rapid
growth
to
fledging,
a
pattern
converse
to
that
observed
in
precocial
species
(Ricklefs,
1968, 1973).
Tyller
(unpublished
results)
found
that
pigeons
(altri-
cial)
and
ducks
(precocious)
had
a
similar
shape
for
their
growth
curve,
even
though
their
mode
of
life
was
different.
The
pigeons
attain
the
inflection
and
mature
weight
at
8
and
24
d
of
age,
respectively,
with
a
ratio
of
these
2
weights,
y+
/A,
around
0.450,
a
result
compatible
with
weight-age
data
of
Aggrey
and
Cheng
(1993).
Animal
improvement
From
a
practical
point
of
view,
the
difference
between
ages
at
slaughter
and
at
the
inflection
point
is
important.
Ducks
and
geese
are
slaughtered
relatively
late
in
the
autoretardation
phase
of
growth,
when
the
growth
rate
has
decreased
substantially.
At
a
slaughter
age
of
7
weeks,
ducks
reach
85%
of
their
mature
weight,
but
the
ratio
is
only
35%
for
chickens.
Geese
and
turkeys
are
usually
killed
around
16
weeks
of
age,
when
they
have
attained
approximately
95
and
65%
of
their
mature
weight.
The
corresponding
value
for
broiler
geese
(at
a
slaughter
age
of
about
9
weeks)
is
74%.
Moreover,
the
waterfowl
have
a
higher
body
weight
and
a
more
intensive
metabolism
than
chickens
and,
consequently,
their
maintenance
requirements
are
higher
(Leeson
et
al,
1982).
They
also
have
more
fat
deposition.
Therefore,
waterfowl
have
a
higher
food
consumption
per
kilogram
of
live
weight
at
slaughter,
compared
with
chickens.
Slaughter
of
turkeys
generally
takes
place
after
the
inflection
point
of
the
growth
curve
as
well,
but
not
as
late
as
for
waterfowl.
The
differences
between
breeds
and
lines
in
the
shape
of
the
growth
curve
suggest
that
selection
for
body
weight
may
alter
the
growth
pattern
(Ricard,
1975;
Marks,
1978;
Tzeng
and
Becker,
1981;
Parks,
1982;
Zelenka
et
al,
1986).
Age
at
selection
may
contribute
to
the
timing
and
magnitude
of
the
growth
response
observed.
Selection
for
high
live
weight
prior
to
t+
(chickens)
appeared
to
result
in
a
younger
age
and
lower
relative
body
weight
at
t+.
Selection
after
t+
(quail
and
turkeys)
had
the
same
effect
on
the
age
at
the
inflection
point,
but
increased
the
relative
weight
at
t+
(Anthony
et
al,
1991).
According
to
these
authors,
most
differences
in
the
shape
of
the
growth
curve
among
quail,
chickens
and
turkeys
occurred
between
hatching
and
the
point
of
inflection.
The
growth
of
all
3
species
after
t+
was
generally
found
to
be
comparable.
Recently,
Barbato
(1992)
reported
that
selection
for
high
growth
rate
immediately
after
hatching
(0-14
d
of
age)
did
not
change
the
body
weight
at
maturity,
while
selection
for
high
body
weight,
at
or
near
the
age
of
the
inflection
point
of
the
growth
curve
resulted
in
increased
adult
body
weight.
REFERENCES
Aggrey
SE,
Cheng
KM
(1993)
Genetic
and
posthatch
parental
influences
on
growth
in
pigeon
squabs.
J
Hered
84,
184-187
Anthony
NB,
Emmerson
DA,
Nestor
KE,
Bacon
WL,
Siegel
PB,
Dunnington
EA
(1991)
Comparison
of
growth
curves
of
weight
selected
populations
of
turkey,
quail,
and
chickens.
Poult
Sci
70,
13-19
Barbato
GF
(1992)
Divergent
selection
for
exponential
rate
at
14
or
42
days
of
age.
1.
Early
responses.
Poult
Sci
72,
687-697
Bjornhag
G
(1979)
Growth
in
newly
hatched
birds.
Swed
J
Agric
Res
9,
121-125
Brody
S
(1945)
Bioenergetics
and
Growth.
Reinhold
Publ
Corp,
New
York,
USA
Knizetova
H,
Knize
B,
Hyinek
J
et
al
(1983)
Growth
curves
of
highly
inbred
lines
of
fowl
and
their
Fl
hybrids.
Genet
Sel
Evol
15,
533-558
Knizetova
H,
Hyinek
J,
Hijkovi
H,
Knize
B,
Siler
R
(1985)
Growth
curves
of
chickens
with
different
type
of
performance.
Z
Tierz
Zuchtungsbiol
102,
256-270
Kní!etová
H,
Hyinek
J,
Knize
B,
Roubicek
J
(1991a)
Analysis
of
growth
curves
of
fowl.
I.
Chickens.
Br
Poult
Sci
32,
1027-1038
Knizetova
H,
Hyinek
J,
Knize
B,
ProchAzkovi
H
(1991b)
Analysis
of
growth
curves
of
fowl.
II.
Ducks.
Br
Poult
Sci
32,
1039-1053
Knizetova
H,
Hyinek
J,
Veselsk!
A
(1994)
Analysis
of
growth
curves
of
fowl.
III.
Geese.
Br
Poult
Sci
35,
415-423
Leeson
S,
Summers
JD,
Proulx
J
(1982)
Production
and
carcass
characteristics
of
the
duck.
Poult
Sci
61,
2456-2464
Marks
HL
(1978)
Growth
curve
changes
associated
with
long-term
selection
for
body
weight
in
Japanese
quail.
Growth
42,
129-140
Nixey
C
(1986)
A
comparison
of
growth
and
fat
deposition
of
commercial
avian
species.
7th
European
Poultry
Conference,
Paris,
August
24-28,
World
Poultry
Science
Association,
671-680
Parks
JR
(1982)
The
growth
parameters
and
the
genetics
of
growth
and
feeding.
In:
A
Theory
of
Feeding
and
Growth
of
Animals
(JR
Parks,
ed),
Springer-Verlag,
Berlin,
Germany
230-242
Ricard
FH
(1975)
Essai
de
selection
sur
la
forme
de
la
courbe
de
croissance
chez
le
poulet.
Ann
Genet
Select
Anim
7,
427-443
Richards
FJ
(1959)
A
flexible
growth
function
for
empirical
use.
J
Exp
Bot
10, 290-300
Ricklefs
RE
(1968)
Patterns
of
growth
in
birds.
Ibis
110,
419-451
Ricklefs
RE
(1973)
Patterns
of
growth
in
birds.
II.
Growth
rate
and
mode
of
development.
Ibis
115,
177-200
Salomon
FV,
Sager
G,
Al
Hallak
M,
Pingel
H
(1988)
Wachstumsspezifische
Approximatio-
nen
von
11
K6rperdimensionen
bei
Gefliigel.
5.
Mitteilung:
Vergleichende
Betrachtung
des
Wachstums
von
Huhnern,
Enten
and
Gansen.
Arch
Gefiügelk
52,
176-180
Salomon
FV,
Anger
Th,
Krug
H,
Gille
U,
Pingel
H
(1990)
Zum
Wachstum
von
Skelett,
K6rpermasse
und
Muskelfaserdurchmesser
der
Pute
(Meleagris
gallopavo)
vom
Schlupf
bis
zum
224.
Lebenstag.
Anat
Histol
Embryol 19,
314-325
Shalev
A,
Pasternak
H
(1989)
Meat
production
efficiencies
of
turkey,
chicken
and
duck
broilers.
World
Poult
Sci
45,
109-114
Taylor
SCS,
Fitzhugh
HA
(1971)
Genetic
relationships
between
mature
weight
and
time
taken to
mature
within
a
breed.
J
Anim
Sci
33,
726-731
Tzeng
RY,
Becker
WA
(1981)
Growth
patterns
of
body
and
abdominal
fat
weight
in
male
broiler
chickens.
Poult
Sci
60,
1101-1106
Zelenka
DJ,
Dunnington
EA,
Siegel
PB
(1986)
Growth
to
sexual
maturity
of
dwarf
and
nondwarf
White
Rock
chickens
divergently
selected
for
juvenile
body
weight.
Theor
Appl
Genet
73,
61-65