Mpeg 7 audio and beyond audio content indexing and retrieval phần 2 doc
Bạn đang xem bản rút gọn của tài liệu. Xem và tải ngay bản đầy đủ của tài liệu tại đây (596.42 KB, 31 trang )
1.3 ORGANIZATION OF THE BOOK 11
The purpose of Chapter 2 is to provide the reader with a detailed overview
of low-level audio descriptors. To a large extent this chapter provides the foun-
dations and definitions for most of the remaining chapters of the book. Since
MPEG-7 provides an established framework with a large set of descriptors, the
standard is used as an example to illustrate the concept. The mathematical def-
initions of all MPEG-7 low-level audio descriptors are outlined in detail. Other
established low-level descriptors beyond MPEG-7 are introduced. To help the
reader visualize the kind of information that these descriptors convey, some
experimental results are given to illustrate the definitions.
In Chapter 3 the reader is introduced to the concepts of sound similarity and
sound classification. Various classifiers and their properties are discussed. Low-
level descriptors introduced in the previous chapter are employed for illustration.
The MPEG-7 standard is again used as a starting point to explain the practical
implementation of sound classification systems. The performance of MPEG-7
systems is compared with the well-established MFCC feature extraction method.
The chapter provides in great detail simulation results of various systems for
sound classification.
Chapter 4 focuses on MPEG-7 SpokenContent description. It is possible to
follow most of the chapter without reading the other parts of the book. The
primary goal is to provide the reader with a detailed overview of ASR and
its use for MPEG-7 SpokenContent description. The structure of the MPEG-7
SpokenContent description itself is presented in detail and discussed in the
context of the spoken document retrieval (SDR) application. The contribution of
the MPEG-7 SpokenContent tool to the standardization and development of future
SDR applications is emphasized. Many application examples and experimental
results are provided to illustrate the concept.
Music description tools for specifying the properties of musical signals are
discussed in Chapter 5. We focus explicitly on MPEG-7 tools. Concepts for
instrument timbre description to specify perceptual features of musical sounds
are discussed using reduced sets of descriptors. Melodies can be described using
MPEG-7 description schemes for melodic similarity matching. We will discuss
query-by-humming applications to provide the reader with examples of how
melody can be extracted from a user’s input and matched against melodies
contained in a database.
An overview of audio fingerprinting and audio signal quality description is
provided in Chapter 6. In general, the MPEG-7 low-level descriptors can be seen
as providing a fingerprint for describing audio content. Audio fingerprinting has
to a certain extent been described in Chapters 2 and 3. We will focus in Chapter 6
on fingerprinting tools specifically developed for the identification of a piece of
audio and for describing its quality.
Chapter 7 finally provides an outline of example applications using the con-
cepts developed in the previous chapters. Various applications and experimental
results are provided to help the reader visualize the capabilities of concepts for
content analysis and description.
2
Low-Level Descriptors
2.1 INTRODUCTION
The MPEG-7 low-level descriptors (LLDs) form the foundation layer of the
standard (Manjunath et al., 2002). It consists of a collection of simple, low-
complexity audio features that can be used to characterize any type of sound.
The LLDs offer flexibility to the standard, allowing new applications to be built
in addition to the ones that can be designed based on the MPEG-7 high-level
tools.
The foundation layer comprises a series of 18 generic LLDs consisting of a
normative part (the syntax and semantics of the descriptor) and an optional, non-
normative part which recommends possible extraction and/or similarity matching
methods. The temporal and spectral LLDs can be classified into the following
groups:
•
Basic descriptors: audio waveform (AWF), audio power (AP).
•
Basic spectral descriptors: audio spectrum envelope (ASE), audio spectrum
centroid (ASC), audio spectrum spread (ASS), audio spectrum flatness (ASF).
•
Basic signal parameters: audio harmonicity (AH), audio fundamental fre-
quency (AFF).
•
Temporal timbral descriptors: log attack time (LAT) and temporal centroid
(TC).
•
Spectral timbral descriptors: harmonic spectral centroid (HSC), harmonic
spectral deviation (HSD), harmonic spectral spread (HSS), harmonic spectral
variation (HSV) and spectral centroid (SC).
•
Spectral basis representations: audio spectrum basis (ASB) and audio spectrum
projection (ASP).
An additional silence descriptor completes the MPEG-7 foundation layer.
MPEG-7 Audio and Beyond: Audio Content Indexing and Retrieval H G. Kim, N. Moreau and T. Sikora
© 2005 John Wiley & Sons, Ltd
14 2 LOW-LEVEL DESCRIPTORS
This chapter gives the mathematical definitions of all low-level audio descrip-
tors according to the MPEG-7 audio standard. To help the reader visualize the
kind of information that these descriptors convey, some experimental results are
given to illustrate the definitions.
1
2.2 BASIC PARAMETERS AND NOTATIONS
There are two ways of describing low-level audio features in the MPEG-7
standard:
•
An LLD feature can be extracted from sound segments of variable lengths
to mark regions with distinct acoustic properties. In this case, the summary
descriptor extracted from a segment is stored as an MPEG-7 AudioSegment
description. An audio segment represents a temporal interval of audio material,
which may range from arbitrarily short intervals to the entire audio portion of
a media document.
•
An LLD feature can be extracted at regular intervals from sound frames. In
this case, the resulting sampled values are stored as an MPEG-7 ScalableSeries
description.
This section provides the basic parameters and notations that will be used
to describe the extraction of the frame-based descriptors. The scalable series
descriptions used to store the resulting series of LLDs will be described in
Section 2.3.
2.2.1 Time Domain
In the time domain, the following notations will be used for the input audio
signal:
•
n is the index of time samples.
•
sn is the input digital audio signal.
•
F
s
is the sampling rate of sn.
And for the time frames:
•
l is the index of time frames.
•
hopSize is the time interval between two successive time frames.
1
See also the LLD extraction demonstrator from the Technische Universität Berlin (MPEG-7 Audio
Analyzer), available on-line at: />2.2 BASIC PARAMETERS AND NOTATIONS 15
•
N
hop
denotes the integer number of time samples corresponding to hopSize.
•
L
w
is the length of a time frame (with L
w
≥ hopSize).
•
N
w
denotes the integer number of time samples corresponding to L
w
.
•
L is the total number of time frames in sn.
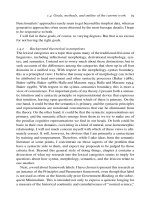
These notations are portrayed in Figure 2.1.
The choice of hopSize and L
w
depends on the kind of descriptor to extract.
However, the standard constrains hopSize to be an integer multiple or divider
of 10 ms (its default value), in order to make descriptors that were extracted at
different hopSize intervals compatible with each others.
2.2.2 Frequency Domain
The extraction of some MPEG-7 LLDs is based on the estimation of short-term
power spectra within overlapping time frames. In the frequency domain, the
following notations will be used:
•
k is the frequency bin index.
•
S
l
k is the spectrum extracted from the lth frame of sn.
•
P
l
k is the power spectrum extracted from the lth frame of sn.
Several techniques for spectrum estimation are described in the literature (Gold
and Morgan, 1999). MPEG-7 does not standardize the technique itself, even
though a number of implementation features are recommended (e.g. an L
w
of
30 ms for a default hopSize of 10 ms). The following just describes the most
classical method, based on squared magnitudes of discrete Fourier transform
(DFT) coefficients. After multiplying the frames with a windowing function
Figure 2.1 Notations for frame-based descriptors
16 2 LOW-LEVEL DESCRIPTORS
wn (e.g. a Hamming window), the DFT is applied as:
S
l
k =
N
FT
−1
n=0
sn +lN
hop
wn exp
−j
2nk
N
FT
0 ≤l ≤ L− 10 ≤k ≤ N
FT
− 1 (2.1)
where N
FT
is the size of the DFT N
FT
≥ N
w
. In general, a fast Fourier transform
(FFT) algorithm is used and N
FT
is the power of 2 just larger than N
w
(the
enlarged frame is then padded with zeros).
According to Parseval’s theorem, the average power of the signal in the lth
analysis window can be written in two ways, as:
P
l
=
1
E
w
N
w
−1
n=0
sn + lN
hop
wn
2
=
1
N
FT
E
w
N
FT
−1
k=0
S
l
k
2
(2.2)
where the window normalization factor E
w
is defined as the energy of wn:
E
w
=
N
w
−1
n=0
wn
2
(2.3)
The power spectrum P
l
k of the lth frame is defined as the squared magnitude
of the DFT spectrum S
l
k. Since the signal spectrum is symmetric around the
Nyquist frequency F
s
/2, it is possible to consider the first half of the power
spectrum only 0 ≤k ≤N
FT
/2 without losing any information. In order to ensure
that the sum of all power coefficients equates to the average power defined in
Equation (2.2), each coefficient can be normalized in the following way:
P
l
k =
1
N
FT
E
w
S
l
k
2
for k = 0 and k =
N
FT
2
P
l
k = 2
1
N
FT
E
w
S
l
k
2
for 0 <k<
N
FT
2
(2.4)
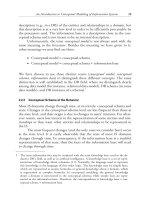
Figure 2.2 depicts the spectrogram of a piece of music (a solo excerpt of cor
anglais recorded at 44.1 kHz). Power spectra are extracted through the FFT
(N
FT
= 2048) every 10 ms from 30 ms frames. They are represented vertically at
the corresponding frame indexes. The frequency range of interest is between 0
and 22.05 kHz, which is the Nyquist frequency in this example. A lighter shade
indicates a higher power value.
In the FFT spectrum, the discrete frequencies corresponding to bin indexes
k are:
fk = kF 0 ≤ k ≤ N
FT
/2 (2.5)
where F = F
s
/N
FT
is the frequency interval between two successive FFT
bins. Inverting the preceding equation, we can map any frequency in the range
0F
s
/2 to a discrete bin in 0 1N
FT
/2:
k = roundf/F 0 ≤ f ≤ F
s
/2 (2.6)
where round(x) means rounding the real value x to the nearest integer.
2.3 SCALABLE SERIES 17
Figure 2.2 Spectrogram of a music signal (cor anglais, 44.1 kHz)
2.3 SCALABLE SERIES
An MPEG-7 ScalableSeries description is a standardized way of representing a
series of LLD features (scalars or vectors) extracted from sound frames at regular
time intervals. Such a series can be described at full resolution or after a scaling
operation. In the latter case, the series of original samples is decomposed into
consecutive sub-sequences of samples. Each sub-sequence is then summarized
by a single scaled sample.
An illustration of the scaling process and the resulting scalable series descrip-
tion is shown in Figure 2.3 (ISO/IEC, 2001), where i is the index of the scaled
Figure 2.3 Structure of a scalable series description
18 2 LOW-LEVEL DESCRIPTORS
series. In this example, the 31 samples of the original series (filled circles) are
summarized by 13 samples of the scaled series (open circles).
The scale ratio of a given scaled sample is the number of original samples
it stands for. Within a scalable series description, the scaled series is itself
decomposed into successive sequences of scaled samples. In such a sequence,
all scaled samples share the same scale ratio. In Figure 2.3, for example, the first
three scaled samples each summarize two original samples (scale ratio is equal
to 2), the next two six, the next two one, etc.
The attributes of a ScalableSeries are the following:
•
Scaling: is a flag that specifies how the original samples are scaled. If absent,
the original samples are described without scaling.
•
totalNumOfSamples: indicates the total number of samples of the original
series before any scaling operation.
•
ratio: is an integer value that indicates the scale ratio of a scaled sample,
i.e. the number of original samples represented by that scaled sample. This
parameter is common to all the elements in a sequence of scaled samples. The
value to be used when Scaling is absent is 1.
•
numOfElements: is an integer value indicating the number of consecutive
elements in a sequence of scaled samples that share the same scale ratio. If
Scaling is absent, it is equal to the value of totalNumOfSamples.
The last sample of the series may summarize fewer than ratio samples. In the
example of Figure 2.3, the last scaled sample has a ratio of 2, but actually
summarizes only one original sample. This situation is detected by comparing
the sum of ratio times numOfElements products to totalNumOfSamples.
Two distinct types of scalable series are defined for representing series of
scalars and series of vectors in the MPEG-7 LLD framework. Both types inherit
from the scalable series description. The following sections present them in
detail.
2.3.1 Series of Scalars
The MPEG-7 standard contains a SeriesOfScalar descriptor to represent a series
of scalar values, at full resolution or scaled. This can be used with any temporal
series of scalar LLDs. The attributes of a SeriesOfScalar description are:
•
Raw: may contain the original series of scalars when no scaling operation is
applied. It is only used if the Scaling flag is absent to store the entire series at
full resolution.
2.3 SCALABLE SERIES 19
•
Weight: is an optional series of weights. If this attribute is present, each weight
corresponds to a sample in the original series. These parameters can be used
to control scaling.
•
Min, Max and Mean: are three real-valued vectors in which each dimension
characterizes a sample in the scaled series. For a given scaled sample, a
Min, Max and Mean coefficient is extracted from the corresponding group of
samples in the original series. The coefficient in Min is the minimum original
sample value, the coefficient in Max is the maximum original sample value
and the coefficient in Mean is the mean sample value. The original samples
are averaged by arithmetic mean, taking the sample weights into account if the
Weight attribute is present (see formulae below). These attributes are absent
if the Raw element is present.
•
Variance: is a real-valued vector. Each element corresponds to a scaled sample.
It is the variance computed within the corresponding group of original samples.
This computation may take the sample weights into account if the Weight
attribute is present (see formulae below). This attribute is absent if the Raw
element is present.
•
Random: is a vector resulting from the selection of one sample at random
within each group of original samples used for scaling. This attribute is absent
if the Raw element is present.
•
First: is a vector resulting from the selection of the first sample in each group
of original samples used for scaling. This attribute is absent if the Raw element
is present.
•
Last: is a vector resulting from the selection of the last sample in each group
of original samples used for scaling. This attribute is absent if the Raw element
is present.
These different attributes allow us to summarize any series of scalar features.
Such a description allows scalability, in the sense that a scaled series can be
derived indifferently from an original series (scaling operation) or from a previ-
ously scaled SeriesOfScalar (rescaling operation).
Initially, a series of scalar LLD features is stored in the Raw vector. Each
element Raw(l) 0 ≤ l ≤ L − 1 contains the value of the scalar feature extracted
from the lth frame of the signal. Optionally, the Weight series may contain the
weights Wl associated to each Raw(l) feature.
When a scaling operation is performed, a new SeriesOfScalar is generated
by grouping the original samples (see Figure 2.3) and calculating the above-
mentioned attributes. The Raw attribute is absent in the scaled series descriptor.
Let us assume that the ith scaled sample stands for the samples Raw(l) contained
between l = lLoi and l = lHii with:
lHii = lLoi + ratio − 1 (2.7)
20 2 LOW-LEVEL DESCRIPTORS
where ratio is the scale ratio of the ith scaled sample (i.e. the number of original
samples it stands for). The corresponding Min and Max values are then defined as:
Mini = min
lHii
l=lLoi
Rawl and Maxi = max
lHii
l=lLoi
Rawl (2.8)
The Mean value is given by:
Meani =
1
ratio
lHii
l=lLoi
Rawl (2.9)
if no sample weights Wl are specified in Weight. If weights are present, the
Mean value is computed as:
Meani =
lHii
l=lLoi
WlRawl
lHii
l=lLoi
Wl (2.10)
In the same way, there are two computational methods for the Variance depend-
ing on whether the original sample weights are absent:
Variancei =
1
ratio
lHii
l=lLoi
Rawl − Meani
2
(2.11)
or present:
Variancei =
lHii
l=lLoi
Wl
Rawl − Meani
2
lHii
l=lLoi
Wl (2.12)
Finally, the weights Wi of the new scaled samples are computed, if necessary,
as:
Wi =
1
ratio
lHii
l=lLoi
Wl (2.13)
2.3.2 Series of Vectors
Some LLDs do not consist of single scalar values, but of multi-dimensional
vectors. To store these LLDs as scalable series, the MPEG-7 standard contains
a SeriesOfVector descriptor to represent temporal series of feature vectors. As
before, a series can be stored at the full original resolution or scaled. The
attributes of a SeriesOfVector description are:
•
vectorSize: is the number of elements of each vector in the series.
•
Raw: may contain the original series of vectors when no scaling operation is
applied. It is only used if the Scaling flag is absent to store the entire series at
full resolution.
2.3 SCALABLE SERIES 21
•
Weight: is an optional series of weights. If this attribute is present, each weight
corresponds to a vector in the original series. These parameters can be used
to control scaling in the same way as for the SeriesOfScalar description.
•
Min, Max and Mean: are three real-valued matrices. The number of rows is
equal to the sum of numOfElements over the scaled series (i.e. the number
of scaled vectors). The number of columns is equal to vectorSize. Each row
characterizes a scaled vector. For a given scaled vector, a Min, Max and Mean
row vector is extracted from the corresponding group of vectors in the original
series. The row vector in Min contains the minimum coefficients observed
among the original vectors, the row vector in Max contains the maximum
coefficients observed among the original vectors and the row vector in Mean
is the mean of the original vectors. Each vector coefficient is averaged in the
same way as the Mean scalars in the previous section. These attributes are
absent if the Raw element is present.
•
Variance: is a series of variance vectors whose size is set to vectorSize.
Each vector corresponds to a scaled vector. Its coefficients are equal to the
variance computed within the corresponding group of original vectors. This
computation may take the sample weights into account if the Weight attribute
is present. This attribute is absent if the Raw element is present.
•
Covariance: is a series of covariance matrices. It is represented as a three-
dimensional matrix: the number of rows is equal to the sum of numOfElements
parameters over the scaled series; the number of columns and number of pages
are both equal to vectorSize. Each row is a covariance matrix describing a
given scaled vector. It is estimated from the corresponding group of original
vectors (see formula below). This attribute is absent if the Raw element is
present.
•
VarianceSummed: is a series of summed variance coefficients. Each coefficient
corresponds to a scaled vector. For a given scaled vector, it is obtained by
summing the elements of the corresponding Variance vector (see formula
below). This attribute is absent if the Raw element is present.
•
MaxSqDist: is a series of maximum squared distance (MSD) coefficients. For
each scaled vector, an MSD coefficient is estimated (see formula below),
representing an upper bound of the distance between the corresponding group
of original vectors and their mean. This attribute is absent if the Raw element
is present.
•
Random: is a series of vectors resulting from the selection of one vector at
random within each group of original vectors used for scaling. This attribute
is absent if the Raw element is present.
•
First: is a series of vectors resulting from the selection of the first vector in
each group of original vectors used for scaling. This attribute is absent if the
Raw element is present.
•
Last: is a series of vectors resulting from the selection of the last vector in
each group of original samples used for scaling. This attribute is absent if the
Raw element is present.
22 2 LOW-LEVEL DESCRIPTORS
As in the case of SeriesOfScalar, these attributes aim at summarizing a series of
vectors through scaling and/or rescaling operations.
Initially, a series of vector LLD features is stored in the Raw attribute. Each
element Raw(l)(0≤ l≤L −1 contains the vector extracted from the lth frame of
the signal. Optionally, the Weight series may contain the weights Wl associated
to each vector.
When a scaling operation is performed, a new SeriesOfVector is generated.
The Min, Max, Mean and Weight attributes of the scaled series are defined in the
same way as for the SeriesOfScalar scaling operation described in Section 2.3.1
(the same formulae are applied with vectors instead of scalars). The elements of
the Covariance matrix of the ith scaled sample are defined as:
Covi bb
=
1
ratio
lHii
l=lLoi
Rawl b − MeanibRawl b
− Meani b
(2.14)
with (0 ≤ b ≤ B − 1) and (0 ≤ b
≤ B − 1), where B is the size of vector Raw(l),
and b and b
are indexes of vector dimensions. Raw(l b) and Mean(i b) are the
bth coefficients of vectors Raw(l) and Mean(i). The VarianceSummed attribute
of the ith scaled sample is defined as:
VarianceSummedi =
1
ratio
B−1
b=0
lHii
l=lLoi
Rawl b − Meanib
2
(2.15)
If weights are specified for original vectors Raw(l), the computation of Covariance
andVarianceSummed takes theminto accountin the sameway asin Equation (2.12).
The MaxSqDist attribute of the ith scaled sample is defined as:
MaxSqDisti = max
lHii
l=lLoi
Rawl − Meani
2
(2.16)
2.3.3 Binary Series
The standard defines a binary form of the aforementioned SeriesOfScalar and
SeriesOfVector descriptors: namely, the SeriesOfScalarBinary and SeriesOfVec-
torBinary descriptors. These descriptors are used to instantiate series of scalars
or vectors with a uniform power-of-2 ratio. The goal is to ease the comparison of
series with different scaling ratios, as the decimation required for the comparison
between two binary series is also a power of 2.
2.4 BASIC DESCRIPTORS
The goal of the following two descriptors is to provide a simple and economical
description of the temporal properties of an audio signal.
2.4 BASIC DESCRIPTORS 23
2.4.1 Audio Waveform
A simple way to get a compact description of the shape of an audio sig-
nal sn is to consider its minimum and maximum samples within successive
non-overlapping frames (i.e. L
w
= hopSize). For each frame, two values are
stored:
•
minRange: the lower limit of audio amplitude in the frame.
•
maxRange: the upper limit of audio amplitude in the frame.
The audio waveform (AWF) descriptor consists of the resulting temporal series
of these (minRange, maxRange) pairs. The temporal resolution of the AWF is
given by the hopSize parameter. If desired, the raw signal can be stored in an
AWF descriptor by setting hopSize to the sampling period 1/F
s
of sn.
The AWF provides an estimate of the signal envelope in the time domain.
It also allows economical and straightforward storage, display or comparison
techniques of waveforms. The display of the AWF description of a signal consists
in drawing for each frame a vertical line from minRange to maxRange. The time
axis is then labelled according to the hopSize information.
Figure 2.4 gives graphical representations of the series of basic LLDs extracted
from the music excerpt used in Figure 2.2. We can see that the MPEG-7 AWF
provides a good approximation of the shape of the original waveform.
Figure 2.4 MPEG-7 basic descriptors extracted from a music signal (cor anglais,
44.1 kHz)
24 2 LOW-LEVEL DESCRIPTORS
2.4.2 Audio Power
The audio power (AP) LLD describes the temporally smoothed instantaneous
power of the audio signal. The AP coefficients are the average square of wave-
form values sn within successive non-overlapping frames (L
w
= hopSize). The
AP coefficient of the lth frame of the signal is thus:
APl =
1
N
hop
N
hop
−1
n=0
sn + lN
hop
2
0 ≤ l ≤ L − 1 (2.17)
where L is the total number of time frames. The AP allows us to measure the
evolution of the amplitude of the signal as a function of time. In conjunction
with other basic spectral descriptors (described below), it provides a quick
representation of the spectrogram of a signal.
An example of the AP description of a music signal is given in Figure 2.4.
The AP is measured in successive signal frames and given as a function of time
(expressed in terms of frame index l). This provides a very simple representation
of the signal content: the power peaks correspond to the parts where the original
signal has a higher amplitude.
2.5 BASIC SPECTRAL DESCRIPTORS
The four basic spectral LLDs provide time series of logarithmic frequency
descriptions of the short-term audio power spectrum. The use of logarithmic
frequency scales is supposed to approximate the response of the human ear.
All these descriptors are based on the estimation of short-term power spectra
within overlapping time frames. This section describes the descriptors, based on
the notations and definitions introduced in Section 2.2. For reasons of clarity,
the frame index l will be discarded in the following formulae.
2.5.1 Audio Spectrum Envelope
The audio spectrum envelope (ASE) is a log-frequency power spectrum that can
be used to generate a reduced spectrogram of the original audio signal. It is
obtained by summing the energy of the original power spectrum within a series
of frequency bands.
The bands are logarithmically distributed (base 2 logarithms) between two
frequency edges loEdge (lower edge) and hiEdge (higher edge). The spectral
resolution r of the frequency bands within the [loEdge,hiEdge] interval can be
chosen from eight possible values, ranging from 1/16 of an octave to 8 octaves:
r = 2
j
octaves −4 ≤ j ≤+3 (2.18)
2.5 BASIC SPECTRAL DESCRIPTORS 25
Both loEdge and hiEdge must be related to 1 kHz in the following way:
Edge = 2
rn
× 1 kHz (2.19)
where r is the resolution in octaves and n is an integer value.
The default value of hiEdge is 16 kHz, which corresponds to the upper limit
of hearing. The default value of loEdge is 62.5 Hz so that the default [loEdge,
hiEdge] range corresponds to an 8-octave interval, logarithmically centred at a
frequency of 1 kHz.
Within the default [loEdge, hiEdge] range, the number of logarithmic bands
that corresponds to r is B
in
= 8/r . The low (loF
b
) and high (hiF
b
) frequency
edges of each band are given by:
loF
b
= loEdge × 2
b−1r
hiF
b
= loEdge × 2
br
1 ≤ b ≤ B
in
(2.20)
The sum of power coefficients in band b loF
b
hiF
b
gives the ASE coefficient
for this frequency range. The coefficient for the band b is:
ASEb =
hiK
b
k=loK
b
Pk 1 ≤ b ≤ B
in
(2.21)
where Pk are the power spectrum coefficients defined in Equation (2.4),
and loK
b
(resp. hiK
b
) is the integer frequency bin corresponding to the lower
edge of the band loF
b
(the higher edge of the band hiF
b
) obtained from
Equation (2.6).
However, the repartition of the power spectrum coefficients Pk among the
different frequency bands can be a problem, particularly for the narrower low-
frequency bands when the resolution r is high. It is reasonable to assume that a
power spectrum coefficient whose distance to a band edge is less than half the
FFT resolution (i.e. less than F/2) contributes to the ASE coefficients of both
neighbouring bands. How such a coefficient should be shared by the two bands
is not specified by the standard. A possible method is depicted in Figure 2.5.
The B
in
within-band band power coefficients are completed by two additional
values: the powers of the spectrum between 0 Hz and loEdge and between hiEdge
and the Nyquist frequency F
s
/2 (provided that hiEdge < Nyquist frequency).
These two values represent the out-of-band energy.
In the following, B = B
in
+ 2 will describe the total number of coefficients
ASEb 0 ≤ b ≤ B − 1 forming the ASE descriptor extracted from one frame.
With loEdge and hiEdge default values, the dimension of an ASE can be chosen
between B = 3 B
in
= 1 with the minimal resolution of 8 octaves and B = 130
B
in
= 128 with the maximal resolution of 1/16 octave.
The extraction of an ASE vector from a power spectrum is depicted in
Figure 2.6 with, as an example, the loEdge and hiEdge default values and a
26 2 LOW-LEVEL DESCRIPTORS
Figure 2.5 Method for weighting the contribution of a power coefficient shared by two
bands
Figure 2.6 Extraction of ASE from a power spectrum with a single-octave resolution
1-octave resolution. The ASE vectors comprise 10 coefficients: 8 within-band
coefficients plus 2 out-of-band coefficients.
The summation of all ASE coefficients equals the power in the analysis
window, according to Parseval’s theorem. More generally, this descriptor has
useful scaling properties: the power spectrum over an interval is equal to the
sum of power spectra over subintervals.
Figure 2.7 gives graphical representations of the basic LLDs extracted from the
same music excerpt as in Figure 2.4. The ASE description is depicted in (b). Each
2.5 BASIC SPECTRAL DESCRIPTORS 27
Figure 2.7 MPEG-7 basic spectral descriptors extracted from a music signal (cor
anglais, 44.1 kHz)
ASE vector is extracted from 34 frequency bands and consists of 32 within-band
coefficients between loEdge = 250 Hz and hiEdge = 16kHz (i.e. a 1/4-octave
resolution) and two out-of-band coefficients. ASE vectors are extracted every
10 ms from 30 ms frames and represented vertically at the corresponding frame
indexes. A lighter shade indicates a higher band power value. The ASE provides
a compact representation of the spectrogram of the input signal.
2.5.2 Audio Spectrum Centroid
The audio spectrum centroid (ASC) gives the centre of gravity of a log-frequency
power spectrum. All power coefficients below 62.5 Hz are summed and repre-
sented by a single coefficient, in order to prevent a non-zero DC component
28 2 LOW-LEVEL DESCRIPTORS
and/or very low-frequency components from having a disproportionate weight.
On the discrete frequency bin scale, this corresponds to every power coefficient
falling below the index:
K
low
= floor625/F (2.22)
where floor(x) gives the largest integer less than or equal to x, and F = F
s
/N
FT
is the frequency interval between two FFT bins.
This results in a new power spectrum P
k
whose relation to the original
spectrum Pk of Equation (2.4) is given by:
P
k
=
K
low
k=0
Pk for k
= 0
Pk
+ K
low
for 1 ≤ k
≤
N
FT
2
− K
low
(2.23)
The frequencies f
k
corresponding to the new bins k
are given by:
f
k
=
3125 for k
= 0
fk
+ K
low
for 1 ≤ k
≤
N
FT
2
− K
low
(2.24)
where fk is defined as in Equation (2.5). The nominal frequency of the low-
frequency coefficient is chosen at the middle of the low-frequency band: f
0 =
3125 Hz.
Finally, for a given frame, the ASC is defined from the modified power
coefficients P
k
and their corresponding frequencies f
k
as:
ASC =
N
FT
/2−K
low
k
=0
log
2
f
k
1000
P
k
N
FT
/2−K
low
k
=0
P
k
(2.25)
Each frequency f
k
of the modified power spectrum is weighted by the
corresponding power coefficient P
k
.
Several other definitions of the spectrum centroid can be found in the literature
(Wang et al., 2000), using different spectrum coefficients (amplitude, log-power,
etc.) or frequency scales (logarithmic or linear). The MPEG-7 definition, based
on an octave frequency scale centred at 1 kHz, is designed to be coherent with
the ASE descriptor defined in Section 2.5.1.
The ASC measure gives information on the shape of the power spectrum. It
indicates whether a power spectrum is dominated by low or high frequencies
and can be regarded as an approximation of the perceptual sharpness of the
signal. The log-frequency scaling approximates the perception of frequencies in
the human hearing system.
Figure 2.7 depicts the temporal series of ASC values. In this example, the
spectrum is dominated by lower frequencies. The ASC values remain around 0,
2.5 BASIC SPECTRAL DESCRIPTORS 29
which means, according to Equation (2.25), that the corresponding frequency
centroids remain around 1 kHz.
2.5.3 Audio Spectrum Spread
The audio spectrum spread (ASS) is another simple measure of the spectral
shape. The spectral spread, also called instantaneous bandwidth, can be defined
in several different ways (Li, 2000). In MPEG-7, it is defined as the second
central moment of the log-frequency spectrum. For a given signal frame, the
ASS feature is extracted by taking the root-mean-square (RMS) deviation of the
spectrum from its centroid ASC:
ASS =
N
FT
/2−K
low
k
=0
log
2
f
k
1000
− ASC
2
P
k
N
FT
/2−K
low
k
=0
P
k
(2.26)
where the modified power spectrum coefficients P
k
and the corresponding
frequencies f
k
are calculated in the same way as for the ASC descriptor (see
Equations (2.23) and (2.24)).
The ASS gives indications about how the spectrum is distributed around its
centroid. A low ASS value means that the spectrum may be concentrated around
the centroid, whereas a high value reflects a distribution of power across a wider
range of frequencies. It is designed to help differentiate noise-like and tonal sounds.
Figure 2.7 depicts the temporal series of ASS values. Except at the onsets of
notes and for the noise-like end silence, the spread remains rather low (an ASS
of 0.5 corresponding to a 500 Hz spread), as expected with a solo instrument
excerpt.
2.5.4 Audio Spectrum Flatness
The audio spectrum flatness (ASF) reflects the flatness properties of the power
spectrum. More precisely, for a given signal frame, it consists of a series of
values, each one expressing the deviation of the signal’s power spectrum from
a flat shape inside a predefined frequency band. As such, it is a measure of
how similar an audio signal is to white noise, or, vice versa, how correlated a
signal is.
The first step of the ASF extraction is the calculation of the power spectrum
of each signal frame as specified in Equation (2.4). In this case, the power
coefficients Pk are obtained from non-overlapping frames (i.e. the hopSize
parameter is set to L
w
, the length of the analysis windows, which is recommended
to be 30 ms in this case).
30 2 LOW-LEVEL DESCRIPTORS
Within a [loEdge, hiEdge] range, the spectrum is then divided into 1/4-
octave-spaced log-frequency bands. These parameters must be distinguished
from the loEdge and hiEdge edges used in the definition of the ASE descriptor
in Section 2.5.1. Here, the values of loEdge and hiEdge must be chosen so that
the intervals separating them from 1 kHz are integer multipliers of a 1/4 octave.
We thus have:
loEdge = 2
1
4
n
× 1 kHz
hiEdge = 2
1
4
B
× loEdge
(2.27)
where n and B are integer parameters with the following meanings:
•
The value of n determines the lower band edge. The minimum value for
loEdge is recommended to be 250 Hz (i.e. n =−8).
•
B is the desired number of frequency bands. After loEdge has been set, the
value of B determines the higher band edge. The value of hiEdge should not
exceed a frequency limit beyond which no flatness features can be properly
extracted. The most obvious limitation to hiEdge is the Nyquist frequency.
Another limitation could be the bandwidth of the original signal. The choice
of parameter B must be made accordingly within these limitations.
The resulting frequency bands are proportional to those used in the definition of
the ASE, thus ensuring compatibility among the different basic spectral descrip-
tors.
However, defining frequency bands with no overlap could make the calcu-
lation of ASF features too sensitive to slight variations in sampling frequency.
Therefore, the nominal edge frequencies of Equation (2.27) are modified so that
the B frequency bands slightly overlap each other. Each band is thus made 10%
larger in the following manner:
loF
b
= 095 × loEdge × 2
1
4
b−1
hiF
b
= 105 × loEdge × 2
1
4
b
1 ≤ b ≤ B (2.28)
with loF
b
and hiF
b
being the lower and upper limits of band b. We denote as
loK
b
and hiK
b
the corresponding bins in the power spectrum, obtained from
Equation (2.6).
Furthermore, in order to reduce computational costs and to adjust the frequency
resolution of the spectrum to the log-frequency bands, the MPEG-7 standard
specifies a method for grouping the power spectrum coefficients Pk in bands
above the edge frequency of 1 kHz. The grouping is defined as follows:
•
For all bands between 1 kHz and 2 kHz (i.e. four bands if hiEdge is greater
than 2 kHz), power spectrum coefficients Pk are grouped by pairs. Two
successive coefficients Pk and Pk + 1 are replaced by a single average
coefficient Pk + Pk + 1/2.
2.5 BASIC SPECTRAL DESCRIPTORS 31
Figure 2.8 Power coefficient grouping within two consecutive bands around 2 kHz
•
This grouping procedure is generalized to the following intervals of 1 octave
as follows. Within all bands between 2
n
kHz and 2
n+1
kHz (where n is an
integer and n ≥ 1), each group of 2
n+1
successive power coefficients is replaced
by a single coefficient equal to their arithmetic mean. Figure 2.8 illustrates
the coefficient grouping procedure within two consecutive bands b (between
f = 2
3/4
kHz ≈ 16818 Hz and f = 2 kHz) and b + 1 (between f = 2 kHz and
f =2
5/4
kHz ≈ 23784Hz). As specified in Equation (2.28), these nominal edge
frequencies are actually modified to introduce a 10% overlap represented on
the schema.
•
At the end of each band, the last group of coefficients may not contain
the required number of values. If at least 50% of the required coefficients
are available (i.e. 2
n
coefficients for bands between 2
n
kHz and 2
n+1
kHz),
the group is completed by using the appropriate number of coefficients at the
beginning of the next band. Otherwise, no average coefficient is yielded;
the power coefficients contained in the last group are simply ignored. In
the example of Figure 2.8, the last group of band b + 1 only contain one
coefficient, which is ignored in the calculation of the three grouped power
coefficients finally associated to b + 1.
This grouping procedure results in a new set of power coefficients P
g
k
.We
call loK
b
and hiK
b
the new band edge indexes of frequency bands b in the
modified power spectrum (see Figure 2.8).
32 2 LOW-LEVEL DESCRIPTORS
For each band b, a spectral flatness coefficient is then estimated as the ratio
between the geometric mean and the arithmetic mean of the spectral power
coefficients within this band:
ASFb =
hiK
b
−loK
b
+1
hiK
b
k
=loK
b
P
g
k
1
hiK
b
−loK
b
+1
hiK
b
k
=loK
b
P
g
k
1 ≤ b ≤ B (2.29)
For all bands under the edge of 1 kHz, the power coefficients are averaged
in the normal way. In that case, for each band b, we have P
g
k
= Pk
between k
= loK
b
= loK
b
and k
= hiK
b
= hiK
b
. For all bands above 1 kHz, for
which a power coefficient grouping was required, only the reduced number of
grouped coefficients is taken into account in the calculation of the geometric and
arithmetic means.
A flat spectrum shape corresponds to a noise or an impulse signal. Hence, high
ASF coefficients are expected to reflect noisiness. On the contrary, low values
may indicate a harmonic structure of the spectrum. From a psycho-acoustical
point of view, a large deviation from a flat shape (i.e. a low spectral flatness
measure) generally characterizes the tonal sounds.
Figure 2.7 shows the temporal series of ASF vectors. Each ASF vector
is extracted from 24 frequency bands within a 6-octave frequency interval,
between loEdge = 250 Hz and hiEdge = 16 kHz (chosen to be smaller than the
22.05 kHz Nyquist frequency). A lighter shade indicates a higher spectral flat-
ness value, meaning that the tonal component is less present in the corresponding
bands.
The spectral flatness coefficients may be used as a feature vector for robust
matching between pairs of audio signals. It is also possible to reduce the spectral
flatness features to a single scalar by computing the mean value across the fre-
quency band coefficients ASF(b) for each frame. The resulting feature measures
the overall flatness of a frame and can be used by an audio classifier (Burred
and Lerch 2003, 2004).
2.6 BASIC SIGNAL PARAMETERS
The above-mentioned basic spectral LLDs give a smoothed representation of
power spectra. They cannot reflect the detailed harmonic structure of periodic
sounds because of a lack of frequency resolution. The following descriptors pro-
vide some complementary information, by describing the degree of harmonicity
of audio signals.
2.6 BASIC SIGNAL PARAMETERS 33
2.6.1 Audio Harmonicity
The audio harmonicity (AH) descriptor provides two measures of the harmonic
properties of a spectrum:
•
the harmonic ratio: the ratio of harmonic power to total power.
•
the upper limit of harmonicity: the frequency beyond which the spectrum
cannot be considered harmonic.
They both rely on a standardized fundamental frequency estimation method,
based on the local normalized autocorrelation function of the signal. This
approach, widely used for local pitch estimation, is independent of the extraction
of the audio fundamental frequency descriptor presented below.
2.6.1.1 Harmonic Ratio
The harmonic ratio (HR) is a measure of the proportion of harmonic components
in the power spectrum. An HR coefficient is computed for each N
w
sample
frame of the original signal sn, with a hop of N
hop
samples between successive
frames. The extraction of an HR frame feature is standardized as follows.
For a given frame index l, the normalized autocorrelation function of the
signal is first estimated as:
l
m =
N
w
−1
n=0
s
l
ns
l
n − m
N
w
−1
n=0
s
l
n
2
N
w
−1
n=0
s
l
n − m
2
l ≤ m ≤ M 0 ≤ l ≤ L − 1 (2.30)
where s
l
n is defined as slN
hop
+ n m is the lag index of the autocorrelation
and L is the total number of frames in sn. In the definition of Equation (2.30),
autocorrelation values are computed at lags ranging from m = 1tom = M.
The maximum lag M corresponds to the maximum fundamental period T
0
(or
equivalently the minimum fundamental frequency) that can be estimated:
M = T
max
0
F
s
=
F
s
f
min
0
(2.31)
The default expected maximum period T
max
0
is 40 ms, which corresponds to a
minimum fundamental frequency of 25 Hz.
If the signal is purely periodic, the maximum values of
l
m will be at lags
m corresponding to multiples of T
0
. At lags near m = 0 a high peak will appear,
which will very likely reach values near to 1 for almost any type of audio signal,
34 2 LOW-LEVEL DESCRIPTORS
independently of its degree of periodicity. To obtain the HR, the autocorrelation
is searched for the maximum, after having ignored the zero-lag peak:
HR = max
M
0
≤m≤M
l
m (2.32)
where M
0
denotes a lag immediately to the right of the zero-lag peak. One
straightforward possibility is to define M
0
as the lag corresponding to the first
zero crossing of the autocorrelation.
It should be noted that, in the MPEG-7 standard, the above equation is writ-
ten as:
HR = max
l≤m≤N
hop
l
m (2.33)
It can be seen that, on the one side, the zero-lag peak is not ignored, which
would result in HR values virtually always close to 1. On the other side, the
rightmost limit corresponds only to a frame length, and not to the maximum lag
M corresponding to the maximum fundamental period expected.
The lag that maximizes
l
m corresponds to the estimated local fundamental
period. The HR values will be close to 0 for white noise and to 1 for purely
periodic signals.
Figure 2.9 gives the temporal series of HR values extracted from three different
types of sounds: flute, laughter and noise. It is clear that the modified definition
described in Equation (2.32) differentiates more clearly the three types of sounds.
Figure 2.9 MPEG-7 HR extracted from three different types of sounds (44.1 kHz) with:
top, the original HR of Equation (2.33); and bottom, the modified HR of Equation (2.32)
2.6 BASIC SIGNAL PARAMETERS 35
With both methods, flute has an HR uniformly equal to 1, as expected for
a purely harmonic signal, whereas the lack of harmonicity of noise is better
described with the modified HR, whose value stays below 0.5 across the whole
audio segment. The results obtained with the laughter sound are also clearly
different. With the original HR definition, laughter cannot be distinguished from
music, whereas the modified HR definition clearly separates the two curves.
This indicates, as expected, less harmonicity in laughter than in flute.
2.6.1.2 Upper Limit of Harmonicity
The upper limit of harmonicity (ULH) is an estimation of the frequency beyond
which the spectrum no longer has any harmonic structure. It is based on the
output/input power ratio of a time domain comb filter (Moorer, 1974) tuned
to the fundamental period of the signal estimated in the previous section. The
algorithm is performed as follows:
1. The comb-filtered signal is calculated as:
˜s
l
n = s
l
n − G
l
s
l
n −ˆm
0 ≤ n ≤ N
w
− 1 (2.34)
where ˆm is the lag maximizing the autocorrelation function
l
m in Equa-
tion (2.32), which corresponds to the estimated fundamental period of frame
l. The G
l
factor is the optimal gain of the comb filter:
G
l
=
N
w
−1
j=0
s
l
js
l
j −ˆm
N
w
−1
j=0
s
l
j −ˆm
2
(2.35)
2. The power spectra of the original and comb-filtered signals (P
k and P
c
k,
respectively) are computed for each frame l as described in Equation (2.23).
3. For each of the spectra P
k and P
c
k, all the power samples falling beyond
a given frequency bin k
lim
are summed. The ratio of the two sums is then
taken as follows:
Rk
lim
=
N
FT
/2−K
low
k=k
lim
P
c
k
N
FT
/2−K
low
k=k
lim
P
k
(2.36)
The maximum frequency bin of the spectra k
max
= N
FT
/2 − K
low
has been
explained in Equation (2.23).
4. The ratios Rk
lim
are computed sequentially, decrementing k
lim
from k
lim
=
k
max
down to the first frequency bin k
ulh
for which Rk
lim
is smaller than a
threshold of 0.5.