Economic impact of mobile communications in sudan phần 3 pdf
Bạn đang xem bản rút gọn của tài liệu. Xem và tải ngay bản đầy đủ của tài liệu tại đây (139.44 KB, 11 trang )
Figure 8: Mobile network operators in Sudan
Mobile
operator
Market
share
Zain
MTN
Sudani
1997
2005
2006
Market intelligence reports and Deloitte Analysis
TechnologyLaunched
Ownership
structure
100% Zain Group
85% MTN Group
15% Larrycom company ltd
74% Private investors
26% Sudanese Government
GSM 900
3G 2100
GSM 900/1800
3G 2100
CDMA2000
3G 2100
58%
Q3 (2009)
23.44%
28.10%
Initial uptake of mobile telephony in Sudan was slow with less than 4% of the
population owning a mobile phone in 2003. This slow uptake is partially attributable
to a lack of coverage, availability of pre-paid services and price incurred by customers
receiving calls. However, as these impediments have eased penetration has increased,
growing by 500% since 2005 and standing at the end of 2008 at 40% Q3 2009.
10
Compared to a sample of African countries, Sudan historically has suffered from
lower mobile telephony usage and penetration. This deficit has been overturned as
growth in Sudan’s mobile sector has outpaced other African countries. Mobile network
operators (MNOs) are providing the types of services and universal access that may
have traditionally been associated with fixed line technology. Specifically, population
10
Penetration here and in the remainder of the report reflects number of SIM cards rather than people
and no account is made for one user possessing several SIM cards. This is common inaccuracy
across data pertaining to estimate penetration. This issue is discussed in: Wireless Intelligence. 2007.
‘Multiple SIMs per user compared to market penetration’.
Figure 9: Historic customers and penetration in Sudan
12,000
10,000
8,000
6,000
4,000
2,000
0
30%
25%
20%
15%
10%
5%
0%
2002 2003 2004 2005 2006 2007 2008
Penetration
Customers (thousands)
Wireless intelligence and Deloitte estimates
45
2 Overview of Sudan market
Mobile telephony in Sudan has gone through a period of substantial development and
change. Today, there are three operators licensed who are facilitating large advances
in population coverage, penetration and service offering. Mobile services have helped
bridge the communications gap between urban and rural areas by moving towards
providing universal access to communications, promoting economic development and
promoting innovation.
2.1 Operators, coverage and penetration
Mobile communications were first licensed to Sudatel, the fixed incumbent, in 1996.
Sudatel commenced mobile services under the Sudanese Mobile Telephone Co.
branded Mobitel. Mobitel now Zain launched services in 1997 rolling out a GSM
based network. After acquiring an initial minority holding in Mobitel, Zain became sole
owners in February 2006. Zain, through its subsidiary Celtel, has a large presence in
Africa, operating in 15 countries and reportedly investing over $12 billion in the
continent to date
8
.
In the last three years two further operators have been licensed and launched services.
The first of the new entrants to launch was Bashair Telecom in 2005, later acquired
and re-branded by South African operator MTN in May 2006. MTN, like Zain,
is well established in providing mobile telephony in Africa having a presence also
in 15 countries
9
.
The final license was awarded to Sudatel who, after disposing of their original mobile
arm, re-entered the market branded Sudani. Sudani is the only operator to have rolled
out a 2G network based on CDMA technology as opposed to GSM technology.
8
Celtel website. 2008. ‘Our company’. />9
MTN website. 2008. ‘Company overview’.
overview.asp.
44
It is difficult to compare the price of calls in Sudan to other African countries given
the lack of pricing data reported. However, Figure 12 shows that average prices are
relatively low compared to African countries where data is available.
Falling prices have resulted in average revenues per user (ARPU) also falling by
around 40% from 2006 to 2008. However ARPU remains high relative to other
African countries.
2.3 Foreign direct investment and network technology
Foreign direct investment (FDI) into Sudan has risen subsequent to the lifting of UN
sanctions in 2002 and the signing of the peace agreement in 2005. From 2005 to 2006
Figure 12: Average mobile call price per minute (USD) for 2007
Deloitte estimates and Wireless intelligence data
0.25
0.20
0.15
0.10
0.05
0.00
Angola
South Africa
Morocco
Algeria
Sudan
Ghana
Egypt
Figure 13: ARPU in selected African countries (USD) for 2007
Wireless intelligence
25
20
15
10
5
0
Congo
Swaziland
Sudan
Chad
Nigeria
Ghana
Rwanda
Morocco
Algeria
Uganda
Tanzania
Kenya
47
coverage has increased from around 30% in 2004 to a projected 85% by the end of
2008
12
. Mobile customers also currently outnumber fixed customers, 36:1 in 2008
13
.
Prepaid mobile services represent over 95% of total mobile connections in Sudan.
2.2 Prices and average revenues per user
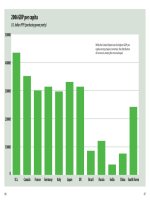
Even following recent influxes of oil revenue, Sudan remains a poor country with gross
domestic product (GDP) per capita of around $1,000
14
. With this financial constraint,
the price of mobile telephony services largely dictates access people have to these
services. Increased competition has led to persistent reductions in the retail prices
charged by MNOs for mobile calls. Average prices blended across pre and post-paid
services in 2008 were less than half of 2005 levels.
11
The sample of comparator countries is made up of: Sudan, Morocco, Egypt, Swaziland, Nigeria, The
Republic of Congo, Ghana, Kenya, Tanzania, Uganda, Libya, Chad, Rwanda, Central African Republic,
Eritrea and Ethiopia. These countries were picked on the basis of GDP per capita and geographic proximity.
12
Budde. 2007. ‘Sudan - Telecoms Market Overview & Statistics’.
13
Mobile customers based on Deloitte estimates, fixed taken from Budde. 2009. ‘Sudan - Telecoms
Market Overview & Statistics’.
14
IMF. April 2008. ‘World Economic Outlook Database’.
Figure 11: Average price of outgoing mobile call per minute in Sudan (SDG)
Deloitte estimates based on call revenues and outgoing minutes in Sudan
2004 2005 2006
2007
2008
0.4
0.3
0.2
0.1
0
46
Figure 10: Comparison of penetration in a sample of African countries in 2007
11
Wireless intelligence and Deloitte estimates
Morocco
Egypt
Swaziland
Nigeria
Congo
Ghana
Kenya
Sudan
Tanzania
Uganda
Libya
Chad
Rwanda
Central African
Republic
Eritrea
Ethiopia
70%
60%
50%
40%
30%
20%
10%
0%
Much of the MNOs investment in Sudan has been spent on mobile network
technology. Network infrastructure within Sudan is provided by a range of
providers including Ericsson, Siemens and Huawei. These providers import
high technology capital whilst a number of Egyptian and local firms provide
lower technology items such as shelter and towers. As rollout of the network
has come at a later time than in other African countries, the mobile network
is comparatively more advanced. Generally network infrastructure providers
observe few impediments in installing and maintaining capital equipment
17
and
significant achievements in deployment have been realised since Mobitel now
Zain
initially started its network deployment in 1997. These include:
• Extensionofpopulationcoverage:theMNOsareforecastedtocover85%
of the population by the end of 2008, as opposed to 43% at the end of
2006;
• Extensionofgeographiccoverage:atotalof2000sitesareestimated
to exist in Sudan, 1,680 of which are deployed by Zain. They cover over
790 towns and cities
18
;
• InvestmentintheSouthregion:forexample,Zainnowcoversover22
cities in the South region and investment will become increasingly
significant in the future. Installation of new sites in the South region
is slowed by the fact that operators require a permission from the
Southern authorities; and
• InvestmentinDarfur:securityisnowlessofabarriertoadditional
investment in the area as shown, for example, by the fact that Zain has
deployed around 40 sites in seven cities in Darfur. However,
security problems remain and are now associated with the theft of fixed
transmission equipment and in particular of copper cables. MNOs have
overcome this issue by installing radio equipment for transmission;
3G licenses were bid for and awarded in 2007. All three MNOs have licenses
and began rollout focussing initially on Khartoum. MNOs are planning to
increase coverage to other cities and towns. Zain currently deploys over 200
3G sites in Khartoum and is planning to increase 3G coverage to 16 cities by
year end 2009.
17
Deloitte interviews.
18
In Appendix A.1 detailed coverage maps of Sudan are presented.
49
FDI is estimated to have grown by 50% whilst total inflows to Sudan are becoming
an increasing proportion of total flows to Africa
15
. Rising FDI is occurring despite the
trade embargo which commenced in 1997 and prohibits both the purchase and sale of
goods or services by US firms from Sudan without license
16
.
The size of the mobile sector investment is substantial. We estimate that
in 2008 MNOs invested over SDG 242 million ($107 million) in new capital
equipment whilst foreign ownership of the fixed operators has also driven
further inward investment. The benefits of these inflows include:
• ForeignMNOsbringingtechnicalexpertiseinthecountryandattracting
business partners, such as network equipment suppliers, to register
business in Sudan;
• ForeignMNOsandnetworkequipmentsuppliershavingabenecial
effect on employment particularly by offering opportunities to high-
skilled Sudanese labour, thus reversing the so called ‘brain drain’ of high
skill labour to foreign countries; and
• ThepresenceofMNOsincreasinginwardinvestmentactingasasignal
to other international investors’ confidence in the Sudanese market as
well as serving the needs of investors.
Figure 14: Foreign Direct Investment in Sudan (USD millions)
4,000
3,500
3,000
2,500
2,000
1,500
1,000
500
0
12.0%
10.0%
8.0%
6.0%
4.0%
2.0%
0.0%
2003 2004 2005 2006
Proportion of total African FDI
Sudan
UN World Investment Report 2007
48
15
UN. 2007. ‘UN World Investment Report’.
16
For further information on the embargo refer to US Treasury Department documents, see http://www.
ustreas.gov/offices/enforcement/ofac/programs/sudan/sudan.pdf
The overall impact of current regulation to date has been positive with
increases in competition reducing prices which drive uptake and usage.
However, there remain areas where this positive effect could be furthered.
Areas include:
• Retailtariffapproval:MNOscurrentlystillrequireapprovalforchanges
in their retail tariffs. Although no retail tariff change has been rejected by
the regulator this process creates additional regulatory burden;
• Interconnectioncharges:TheNTCregulatestheinterconnectioncharges
between mobile and fixed networks. The regulated charge is usually set
on the basis of the cost of providing interconnection. However, the NTC
is not currently regulating the charge on this basis and it is unclear what
basis it is using;
• Regulationofwholesaleleasedlinesandinfrastructuresharing:
currently providers of leased lines are not obligated to provide access to
competitors and wholesale prices are not regulated. This results in the
fixed incumbent refusing to negotiate access in strategic areas or offering
extremely high prices for leased line rental and network access. This
problem has been eased by the entrance of Canar Telecom to the market;
however it remains a barrier for MNOs deployment policies. Lack of
access regulation has forced MNOs to supply their services through the
radio network, including at backhaul level in some areas of the country; and
• Accesstotheinternationalgateway:theSudaninternationalgatewayis
formed by a number of submarine cables running to Saudi Arabia
which open up access to Saudi, the Middle East and other international
traffic destinations. Further international access is provided by a direct
fibre connection to Egypt which then links to Egypt’s extensive
international connections. Wholesale access is available only through
licensed fixed line operators and there is no obligation for them to
offer access to MNOs. This leaves mobile operators to purchase
wholesale international from satellites operators. A potential remedy to
this is for the regulator to provide MNOs with gateway licenses as is the
case in Egypt and Kenya.
51
The significance of 3G and EDGE technology in Sudan is large as access to
internet via the fixed line operator is low. In 2006 fixed internet penetration
was reported to be less than 1%
19
. Evidence of the importance of 3G is further
demonstrated in the capital Khartoum where data card usage is proliferating
20
.
2.4 Regulatory environment
Telecommunications within Sudan are regulated by the National
Telecommunication Council (NTC) established in 1996. The NTC has been
driving reform through privatisation and the opening up of markets to
competition as set out in the Telecommunications Act in 2001. The regulator
has highlighted four ‘dimensions’ which form the basis of its policy
21
:
• Establishingandsupervisingstate-of-the-artnetworksandtechnologies;
• Liberalisingandfacilitatingmarketentryandquality;
• Reducingthedigitaldivide;and
• Playinganactiveroleinensuringthe‘InformationAge’isrealised.
Of particular visibility has been the regulator’s role in pursuing the second
dimension. Specifically NTC initiatives have included ending Sudatel’s
monopoly position in fixed line provision with the licensing of Canar Telecom in
late 2005 and the licensing of three MNOs. Liberalisation has also included the
privatisation of Sudatel, although the government still retains a 26% share.
In order to fund its activities and to achieve the latter two aims, the regulator
has levied an ‘Information Technology and Communication’ (ITC) tax on all
telecommunications services. The NTC is currently levying the tax without
ratification from the central government
22
. This tax is paid by operators on
local and international calls and is charged at a rate of SDG 0.005 ($0.002)
per minute on local calls and SDG 0.01 ($0.004) per minute on international
calls. Although this tax makes up less than 5% of a typical mobile call price
per minute, the costs of using mobile communications is ultimately increased.
These increases may reduce access and therefore uptake of mobile telephony.
19
Based on internet subscribers data from: Central Bureau of Statistics, 2007. ‘Transport and
communication’. Population data is an average of Central Bureau of Statistics and International Monetary
Fund data.
20
Based on interviews conducted by Deloitte.
21
NTC, 2008. ‘The Regulator’s Fourth Dimension’. />22
Specific information on projects the fund has already financed can be found on the NTC website.
50
We have structured this static analysis as illustrated by the following figure. The
different impacts are summed together to give the total economic impact.
Figure 15: Structure of our analysis of economic impact on GDP and employment
Supply Side Impact Demand Side Impact Intangible Impact
Mobile
Operators
Related
Industries
General
Economy
Value Chain
Improved
Productivity
Social
Benefit
Research
and interviews
Willingness
to pay
Direct
Indirect
Multiplier
Analysis
Deloitte
It should be noted that this methodology calculates the total contribution of MNOs
taking account a broader impact than found in the Sudan national accounts. Our
calculation is broader for several reasons:
• Supplysideimpact:Whencalculatingthesupplysideimpactweestimateows
which originate in the mobile sector but then permeate through the economy
into unrelated sectors through the spend of wages and profit. In the national
accounts these flows will not fall under mobile telephony;
• Demandsideimpact:Productivitygainsareenjoyedbyworkerswhocontribute
to the output of a number of sectors. For example, we define the efficiency
gains agricultural workers derive from mobile usage as being mobile related.
In the national accounts the extra output these workers derive will be found in
the agricultural side of the accounts; and
53
3 Economic impact of the mobile industry in Sudan today
In this section we outline the approach we have taken in estimating the static
economic impact of the mobile industry in Sudan. In sum, we estimate that the
economic impact of the mobile sector in Sudan represents 4.0% in 2008 and with a
further intangible impact worth up to 1.0% of GDP. This amounts to SDG 5,415 million
($2,414 million).
3.1 Methodology
We initially calculate the economic impact of the mobile industry between 2006 and
2008 using a static analysis, which provides a snapshot of the economic impact in a
given year. Our estimates are based on:
• InterviewsanddatacollectedfrompublicsourcesincludingtheNational
Telecommunication Council, Central Bureau of Statistics, Bank of Sudan,
International Monetary fund and the World Bank;
• InterviewsanddatacollectedfromZain;
• InterviewsanddatacollectedfromEricsson;
• Interviewsanddatacollectedfromothersinthemobilevaluechainincluding
handset dealers, airtime wholesalers and retailers and other key stakeholders;
• TelecommunicationsmarketdatafromWirelessIntelligenceandtheBudde
report; and
• Internationalbenchmarksandstudies.
We have not verified the accuracy or robustness of the information provided to us and
where there have been discrepancies between data sources then we have opted to
use information provided to us by Zain and Ericsson.
We estimate the value of the mobile communications industry to the Sudanese
economy in terms of employment and GDP, analysing both direct MNO and indirect
contributions. We have defined the total economic impact as consisting of the
following elements:
• Thedirectimpactfromthemobileoperators;
• Theindirectimpactfromotherindustriesrelatedtomobileservices;
• Theindirectimpactduetothesurplusenjoyedbyendusersintermsof
productivity improvements; and
• Theindirectimpactduetomorequalitativesocialbenetsenjoyedby
the population.
52
3.2.1 Value chain impact
Firstly, we analysed the value add of the mobile network operators in Sudan. We have
determined five categories of economic value which are directly created by the MNOs
in Sudan:
• Wagesandemployeebenets;
• Contractorcosts;
• Taxesandregulatoryfees;
• Corporatesocialresponsibility(CSR);and
• Dividends.
For each of these categories we identify the proportion of value add which relates
to the domestic economy only. This analysis is based upon operator management
accounts which identify the final destination of monetary flows or where these have
not been available, industry reports.
We find that they directly contributed SDG 887 million ($396 million) in 2008. The
breakdown by category is provided below:
Taxes and regulatory fees (including spectrum fees) make up the largest proportion
in the above table, accounting for over 85% of the total domestic value-add. VAT
represents 64% of all taxes and regulatory fees paid in 2008. The next largest
contributor is employee wages and benefits.
Figure 17: Value add of mobile network operators (excluding multiplier effect)
Value Add (millions SDG)
2008
Employee wages and benefits
Contractors
Taxes and regulatory fees
Corporate and social responsibility
Dividends
Total
23
-
350
20
1
394
Deloitte analysis based on information provided by MNOs, interviews with players in related industries
and publicly available information.
2007
2006
60
1
514
29
-
603
89
1
769
28
-
887
55
• Intangibleimpact:Thepositiveimpactofsocialcohesionetc.generatedby
mobile telephony may implicitly effect a number of sectors of the economy and
thus the accounts. However, our approach tries to quantify these effects and
directly attribute these to mobile telephony.
3.2 Supply side impact of mobile communications
We have estimated the value add created by the mobile communications industry. We
quantify the contribution of the mobile industry to the Sudanese economy, covering
the industry and its adjacent sectors. This is calculated by aggregating the direct,
indirect and economy wide (multiplier) effects that have occurred in each year. The
multiplier captures the idea that an initial spending rise can cause a further change in
aggregate output for the economy as money circulates through the economy.
A customer’s spend on mobile services flows along the value chain to the players
within the industry (the operators, suppliers, distributors and others); and ultimately
in part to the Government via tax revenues. Money flows between those in the
industry, and the amounts retained are used to pay wages, taxes, buy inputs and pay
other costs. Finally, the Government collects tax revenues from all operators within
its jurisdiction. In this study, we focus on the supply side impact on Sudan and ignore
international impacts.
We have estimated the”leakages” from the system, i.e. what percentage of any SDG
spend will remain within the national economy to be spent in the next round and use
this to isolate the impact on the Sudan economy from the total international impact of
the mobile communications industry.
Figure 16: Structure of our supply side analysis
Direct impact
from MNOs
Indirect impact
from related
industries
Economic
multiplier
Total annual supply side impact
Deloitte
54
This estimate is based primarily on the degree of openness in the Sudanese economy
which, given the US embargo, we expect to be low meaning a high level of further
value add will be generated domestically.
Figure 18: Various multiplier benchmark studies
Value Add (millions SDG)
Multiplier
The contribution of mobile phones to the UK economy, 02 for ONS
Ovum studies on economic impact of mobile telephony in Bangladesh and USA
based on review of various other studies*
Association Française des Opérateurs Mobiles*
Economic impact of spectrum use in the UK, Europe economics, based on ONS
Sicrana, R., and de Bonis, R. ‘TheMultiplier Effects of Telecommunications
Investments on Economic Growth and Restructuring’. **
Radio authority UK. 1995. ‘Economic impact of radio’
Deloitte for GSMA. 2006. ‘Economic Impact of mobile telephony in
East Africa’
Deloitte for GSMA. 2007. ‘Economic Impact of mobile telephony in Pakistan’
Deloitte for Telenor. 2008. ‘Economic Impact of mobile telephony in Serbia,
Ukraine, Malaysia, Thailand, Sudan and Pakistan’
* refers to GDP
** refers to employment
1.13
1.6
1.7
1.1
1.5
1.4
1.2
1.2-1.3
1.2 - 1.4
57
CSR programmes received SDG 29 million ($12.5 million) in 2007, which fell slightly to
SDG 28 million ($12 million) in 2008. This level of expenditure is larger than in other
African countries where previous studies have been undertaken
23
.
In calculating the value add for all operators, disaggregated dividend data was
unavailable for both MTN and Sudani
24
. To estimate the dividends we have uplifted
data for Zain and applied appropriate ownership structures to retain only that
proportion which remains in Sudan. These estimates are conservative as Zain did not
pay dividends for 2008.
We then analysed the revenue flows from the mobile operators to others in the
industry, quantifying the share of revenue received which is then subsequently
translated into value add. In order to do this firstly we identified the following
categories of value add:
• Firmprots;
• Wagesandemployeebenets;
• Taxexpenditure;and
• SpendonCSRactivities.
Based on interviews with industry players, a review of annual reports of similar
companies and similar studies, we then calculated the percentage of revenue
corresponding to indirect value add. These margins range from 21% to 71% of
revenue received by each industry player. Particularly high margins were found
in labour intensive industries as wage expenditure is comparatively high. A full
breakdown of the margins used in this study is included in section A.2.
The calculated margins were then applied to the revenues flowing to the different
domestic industry players to calculate the value add generated by each related
industry. Revenues received by each industry were quantified by uplifting domestic
only revenues provided by Zain.
Estimates of value add include a multiplier effect which is assumed to be 20% of
value-add. The multiplier can be thought of capturing two specific further value add
effects; firstly, the additional value add created by further payments from indirect
players to further players and secondly, additional spend of indirect players wages and
profit on goods and services. We have estimated the multiplier to be 1.2 in Sudan.
23
Deloitte for GSMA. 2006. ‘Economic Impact of mobile telephony in East Africa’. This report is for 2006
spend, Kenya has the highest spend of USD 6.5 million which compares to USD 9.5 million in 2006 in
Sudan.
24
Sudani only reports dividends for Sudatel as a whole, hence corresponding to both the fixed and mobile
business. MTN on the other hand only reports dividends at a group level allowing no way of quantifying
dividend payments corresponding purely to Sudanese interests.
56
Figure 20: Calculation of value add from mobile communications in Sudan in 2008
Total
revenue
Value add
with
multiplier
3,453
280
512
1,810
75
658
286
7,074
2,566
214
218
1,250
46
138
158
4,590
Deloitte analysis based on information provided by MNO and other industry players, interviews and
analysis of company accounts and industry reports
Total value
add
Total
cost
Domestic value add,
SDG millions
Mobile network operators
Fixed operator
Network equipment
suppliers
Handset dealers and
repairers
Other suppliers of
capital items
Support services
Airtime/SIM distributors
and retailers
Total
887
65
127
560
29
215
128
2,012
1,064
79
152
672
35
258
154
2,415
Handset dealers and repairers
The largest portion of indirect value was found to be generated from handset dealers
and repairers, a result consistent to findings in previous studies in Rwanda and
Uganda
25
. Value add from these players comes from several sources:
• Importersanddealersoflegalandparallelhandsets;
• Retailersofnewlegalandparallelhandsets;
• Secondhandhandsetretailers;and
• Handsetrepairersandservicing.
In Sudan the parallel handset market is estimated to be as large as the legal handset
market. Parallel handsets are imported in Sudan from Dubai and other neighbouring
markets with importers evading import duties
26
. In interviews with markets participants
this problem was thought to be growing in 2008 as further duty increases widen the
profit margin differential between illegal and legal handset imports. Further pressure
25
Deloitte for GSMA. 2006. ‘Economic Impact of mobile telephony in East Africa’.
26
Based on interviews with a variety of stakeholders in the handset supply chain.
59
The Figure 19 provides revenue flows between providers and estimates of value add.
The figures next to the arrows represent the flow of money from one group to another.
The figures inside the boxes represent the value retained by each group. Figures
shown relate solely to domestic flows and domestic value add. The indirect players in
the mobile supply-side value chain include:
Deloitte analysis based on information provided by MNOs and industry players, interviews and analysis of
company accounts and industry reports
Network
equipment
suppliers
(127)
Fixed
line
operators
(65)
Suppliers
of support
services
(215)
Other
suppliers of
capital items
(29)
127 280 353 75
Mobile network operators (864)
Fixed
line
operators
(65)
21 3,253
39
Handset
dealers &
repairers
(560)
1810
Fixed to
mobile calls
Payment for mobile
services & connections
Payment for handsets
Airtime
and SIM
sellers
(128)
286
20
Manufacturer subsidy
End users
Interconnection
payments
Figure 19: Mobile value chain in Sudan in 2008 (SDG millions)
58
Multiplier
(402)
Government
tax
revenue
(1,945)
Figure 20 below shows the calculation of value add.
range from informal sales on the street, small market stalls, grocery stores,
pharmacies and larger shops also selling handsets and occasionally repairs;
• Thedealerbypassesthesubdealersandsellsdirecttoindependentpointsof
sale; and
• AirtimeandSIMsaredirectlysoldbylargedealerswhoacquirethemfrom
MNOs and sell directly to the customer through the dealers own point of sale.
These different channels are illustrated in Figure 21.
In the figure above, the percentage without brackets represent the proportion of
total sales through each channel, whilst those in brackets are the proportion of total
commission flowing through the channel retained by each participant. From interviews
68% of sales occur through channel one and with the point of sale retaining the
majority of the commissions.
Airtime in Sudan can be purchased both from scratch cards and increasingly by
credit transfers. Credit transfers are particularly important in Sudan as the lowest
denomination of scratch card is often unaffordable.
Figure 21: Airtime and SIM supply chain
Channel and proportion of total
commission held at each stage
Dealer
(17%)
Deloitte interviews with key stakeholders. Percentages on the left side represent the size of sales through
each channel. Percentages in brackets are the proportion of commission which are retained by each
player in the various channel.
Proportion of sales
through channel
60%
Sub
Dealer
(23%)
POS
(60%)
Dealer
(32%)
38%
POS
(68%)
Dealer
(100%)
2%
Customer
61
on legal handsets importer and distributors is coming from falling wholesale prices
and insufficient offset from manufacturer charged prices. Import duties currently stand
at 20% but are expected to increase this year. It was estimated that 30% of handsets
sales are parallel imports without duty being paid.
The second hand market for handsets is becoming increasingly large in Sudan as those
with high willingness to pay sell old handsets for newer advanced models. For 2008
industry sources estimated around 20% of all handset sales were second hand
27
.
In markets in Khartoum, and other cities, shops and vendors are increasingly providing
handset repairing facilities. The price of repairing a handset ranges from a few SDG for
a minor fault to around SDG 50
28
($22) for repairs requiring expensive parts. Repairers
tend to locate in larger shops that provide airtime, SIMs and handsets.
Network equipment suppliers
Network capital suppliers generated SDG 150 million ($67 million) in value add in
2008. Significant value add is being generated due to increasing investment by
MNOs, see section 2.3. To calculate the value add generated by network equipment
providers, we considered three types of providers:
• InternationalequipmentproviderssuchasEricssonandNSN,whoprovidehigh
technology radio equipment and the services associated to it. The local
branches of these providers receive no flows of money directly from the MNOs
but rather receive a budget from the international business sufficient to cover
a range of domestically incurred expenses and CSR programs. Domestic value
add is thus generated from the budget brought back into Sudan;
• OtherAfricanproviders,whoprovidetowersandsheltersandinstallthem;and
• LocalSudaneseproviders,whopreparethesitesandhelpintheinstallation.
Airtime and SIM sellers
Sellers of airtime and SIMs were found to contribute 6% to total value add. This value
add is generated on commissions which are paid by MNOs on airtime and SIM sales.
These commissions are retained by the different players in the supply chain. There are
primarily three channels through which airtime and SIMs are sold:
• AirtimeandSIMsareresoldbymaindealerstosmaller‘subdealers’whothenin
turn sell to multiple independent points of sale. Independent points of sale can
27
This value is also consistent to the results of a recent survey by Zain of 800 mobile users.
28
Based on interviews with handset repairers.
60
Further contributions made by companies and employees have also been taken
account of including Zakat, social insurance and Union contributions
29
. Zakat within
Sudan is collected and then distributed by the Zakat chamber
30
.
We note that, analogous to the ITC tax, the stamp duty and ‘wounded’ stamp duty
raise the cost of mobile telephony potentially creating financial barriers to further
penetration gains and usage. These taxes are also asymmetric, in that they raise the
cost of post-paid services relative to pre-paid services. This creates distortions in the
market generating an inherent bias towards pre-paid services.
The majority of tax revenue is raised through VAT which accounted for 70% of tax paid
in 2008. The second largest tax contributor is the ITC tax.
Figure 22: Tax revenues in Sudan from mobile operators in 2008
Tax revenue, SDG millions
Tax revenue
excluding multiplier
Tax revenue includ-
ing multiplier
VAT
ICT fund
Regulator fees
Other MNO paid taxes and Zakat
Import fees
Income tax paid
Other employee taxes
Stamp duties paid by customers
Total
545
94
58
23
9
17
18
5
769
654
113
69
27
11
20
22
6
923
Deloitte analysis based on operator data. * Other employee taxes include social insurance, union
membership and Zakat.
Figure 23: Breakdown of 2008 tax revenues from mobile operators by source
1%
71%
2%
2%
1%
3%
8%
12%
VAT
IT fund
Regulator fees
Other MNO paid taxes and Zakat
Import fees
Income tax paid
Other employee taxes
Stamp duties paid by customers
Deloitte analysis based on operator data
29
Zakat forms one of the five pillars of Islam and is an obligation on Muslims to pay a proportion of
their income when their annual wealth exceeds a predetermined threshold. These payments are then
distributed to the economically disadvantaged.
30
For details on collection and distribution refer to />63
Support services
We identified several support services where MNOs incur significant expenditure.
Substantial expenditure was found to flow to network repairers, building rents,
advertising and promotion, training and consulting services. 69% of expenditure on
support services was found to be domestic and of this flow value add amounted to
SDG 215 million ($96 million) in 2008.
3.2.2 Contribution to Government revenue
Tax revenues for the Government and the Regulator are raised through taxes specific
to telecommunications, income tax and regulatory fees. The following taxes are
relevant to the supply chain:
• Corporatetax:MNOscurrentlyhaveexemptionasthegovernmentisproviding
incentives for telecommunications investment whilst other players in the supply
chain pay around 2%. However, the current exemption is expected to fall from
this year.
• ValueAddTax(VAT)paidonpurchases:VATwas10%in2006untilJune2007
when it increased to 12%. In 2008 VAT has further increased to 15%;
• Incometax:Paidbyemployeesatarateof13%ofgrossincome;
• Stampduty:Paidbypost-paidmobilecustomersandleviedatarateof
SDG 0.02 ($0.009) per invoice received by the customer. Stamp duty is further
paid by employees at a flat rate of SGD 0.5 ($0.22) per month;
• Woundedstampduty:Paidbypost-paidmobilecustomersatarateofSDG2.5
($1.1) per invoice and collected by the Army;
• ITCtax,asdescribedsection2.4:ITCtaxischargedatarateofSDG0.005
($0.002) per minute on local calls and SDG 0.01 ($0.004) per minute on
international calls;
• Handsetduty:Handsetsimportedaresubjecttoanimportdutyof20%paidon
the invoice value of the sets. Interview evidence however suggests there is a
tendency for taxes to be paid on an inflated invoice value instead;
• Capitalimportduty:MNOscurrentlyareexemptedfromimportdutyoncapital
items such as network equipment;
• Otherimporttaxes:Inadditiontotherelevantimportdutyseveralfeessuchas
the 1.2% civil aviation tax, 2.5% seaport tax and 1% handling tax are levied on
most imports; and
• Regulatoryfees:ThesefeesarepaidtotheRegulatorandincludeaGSMannual
license renewal fee, administrative charges and 3G license renewal.
62
These projects are chosen by an independent advisory board comprising of
representatives of different regions and a variety of positions within Sudan society.
Some recent projects Zain have undertaken include:
• CapacityBuilding:SupporthasbeenprovidedtoTogetherforSudan,aUK
basedcharity,whichtrainslocaladultstoprovidelocaleducationservices.
These activities have been undertaken in the war effect areas of the
Nuba Mountains;
• Provisionofhealthinsuranceandambulances:3,000familieswithdisabilities
and poor economic backgrounds have been provided with health insurance.
Inaddition,16ambulanceshavebeendonated,outofwhich7arefour-wheel-
drive,toregionalhospitals,includingDarfur(farWestern)andKasala(farEastern);
• BuildingamaternityandchildwelfareCentreinSharkela:Projectwillprovide
maternityservicestoanisolatednumberofvillagesintheWestofSudan.
Previouslymaternityserviceswerelocatedover60kmaway;and
• SupportingschoolsandcollegesinSouthernSudaninadditiontoextending
supporttopatientsinKidneyDialysisCentresinEasternSudan.
ProjectswhichhavebeenrunbyMTNandSudanihaveincluded:
• Assistanceinincreasingblooddonations:fundingofaKhartoumbased
program aiming to increase blood donations; and
• Disasterrelief:inwaraffectedareaschildrenhavebeenprovidedwithfood
and clothes.
3.2.4 Impact on employment numbers
Wehavealsoestimatedthefulltimeequivalent(FTE)employmentgeneratedby
MNOs’activities.ToquantifythiswehaveestimatedtheFTEscreatedthroughthree
routes:
• Directemploymentoftheindustryandrelatedindustries;
• Supportemploymentcreatedbyoutsourcedworkandtaxesthatthe
Governmentsubsequentlyspendsonemploymentgenerating
activities; and
• Inducedemploymentresultingfromtheaboveemployeesandbeneciaries
spendingtheirearnings,andcreatingmoreemployment.
65
Inadditiontothedirecttaxrevenuereceivedfrommobileoperators,itisnecessaryto
considerthetaxrevenuereceivedfromothersinthevaluechain.Wehaveconsidered
import,sales,corporationandemployeetaxesinourcalculationsbelow.
Handsetdealersandrepairerscontributesubstantiallytotaxrevenues.Thesizeof
the parallel market for handsets though is constraining these revenues as this route
avoidsdutypaidonimporting.Overallfor2008weestimatethattheGovernmenthas
foregone revenues on potential duty receipts on illegally imported handset of over
SDG100million($44.6million).
3.2.3 Corporate social responsibility
WeestimatethatCSRprogrammesorganisedbyMNOsreceivedoverSDG28million
($12.5million)in2007andoverSDG5million($2million)in2008.
MNOshaveestablishedanumberofinternationallyrecognisedCSRprogramsin
Sudan. These programs tend to focus on capacity building as opposed to pure
philanthropy.Zainforexample,focusesitsCSRactivitiesonsustainableprojects
intheareasofhealth,education,capacitybuildingandenvironmentalprotection.
Figure 24: Breakdown of 2008 tax revenues by indirect players
Total
revenue
Value add
with
multiplier
3,453
280
345
1,810
75
353
286
6,602
2,566
214
218
1,250
46
138
158
4,590
Deloitte analysis based on operator data, interviews and public information
Total value
add
Total
cost
Domestic value add,
SDG millions
Mobile network operators
Fixed operator
Network equipment
suppliers
Handset dealers and
repairers
Other suppliers of
capital items
Support services
Airtime/SIM distributors
and retailers
Total
887
65
127
560
29
215
128
2,012
1,064
79
152
672
35
258
154
2,415
64